Zip Codes with the Highest Percentage of Population Employed in Farming, Fishing & Forestry in Bellingham, WA
RELATED REPORTS & OPTIONS
Farming, Fishing & Forestry
Bellingham
Compare Zip Codes
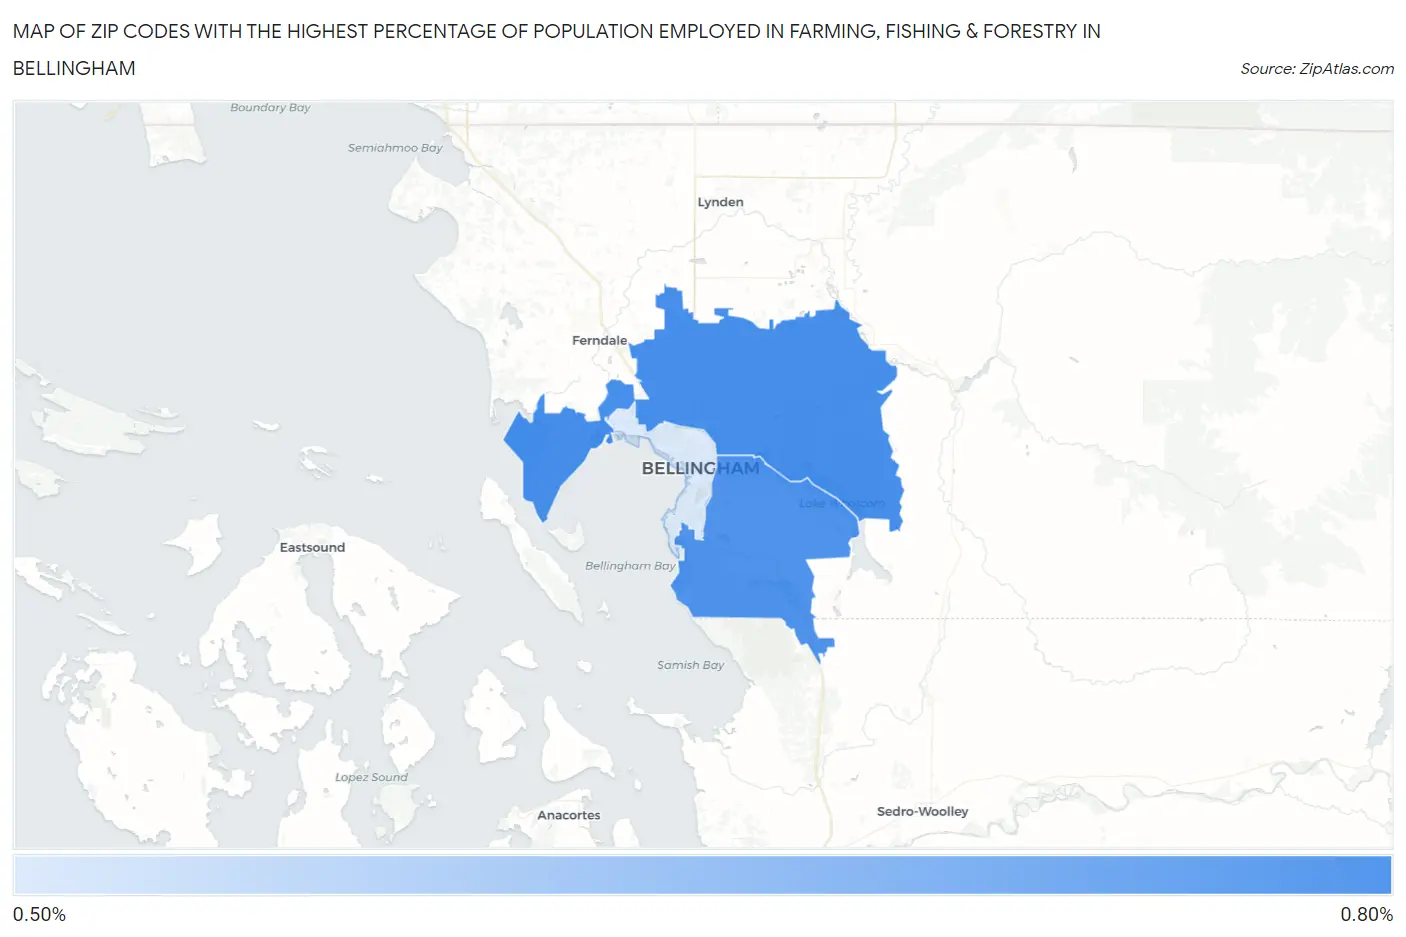
Map of Zip Codes with the Highest Percentage of Population Employed in Farming, Fishing & Forestry in Bellingham
0.53%
0.75%
Zip Codes with the Highest Percentage of Population Employed in Farming, Fishing & Forestry in Bellingham, WA
| Zip Code | % Employed | vs State | vs National | |
| 1. | 98226 | 0.75% | 1.5%(-0.765)#270 | 0.61%(+0.141)#11,096 |
| 2. | 98229 | 0.74% | 1.5%(-0.774)#273 | 0.61%(+0.131)#11,154 |
| 3. | 98225 | 0.53% | 1.5%(-0.983)#300 | 0.61%(-0.077)#12,619 |
1
Common Questions
What are the Top Zip Codes with the Highest Percentage of Population Employed in Farming, Fishing & Forestry in Bellingham, WA?
Top Zip Codes with the Highest Percentage of Population Employed in Farming, Fishing & Forestry in Bellingham, WA are:
What zip code has the Highest Percentage of Population Employed in Farming, Fishing & Forestry in Bellingham, WA?
98226 has the Highest Percentage of Population Employed in Farming, Fishing & Forestry in Bellingham, WA with 0.75%.
What is the Percentage of Population Employed in Farming, Fishing & Forestry in Bellingham, WA?
Percentage of Population Employed in Farming, Fishing & Forestry in Bellingham is 0.57%.
What is the Percentage of Population Employed in Farming, Fishing & Forestry in Washington?
Percentage of Population Employed in Farming, Fishing & Forestry in Washington is 1.5%.
What is the Percentage of Population Employed in Farming, Fishing & Forestry in the United States?
Percentage of Population Employed in Farming, Fishing & Forestry in the United States is 0.61%.