Zip Codes with the Highest Percentage of Population Employed in Mining, Quarrying, & Extraction in Bellingham, WA
RELATED REPORTS & OPTIONS
Mining, Quarrying, & Extraction
Bellingham
Compare Zip Codes
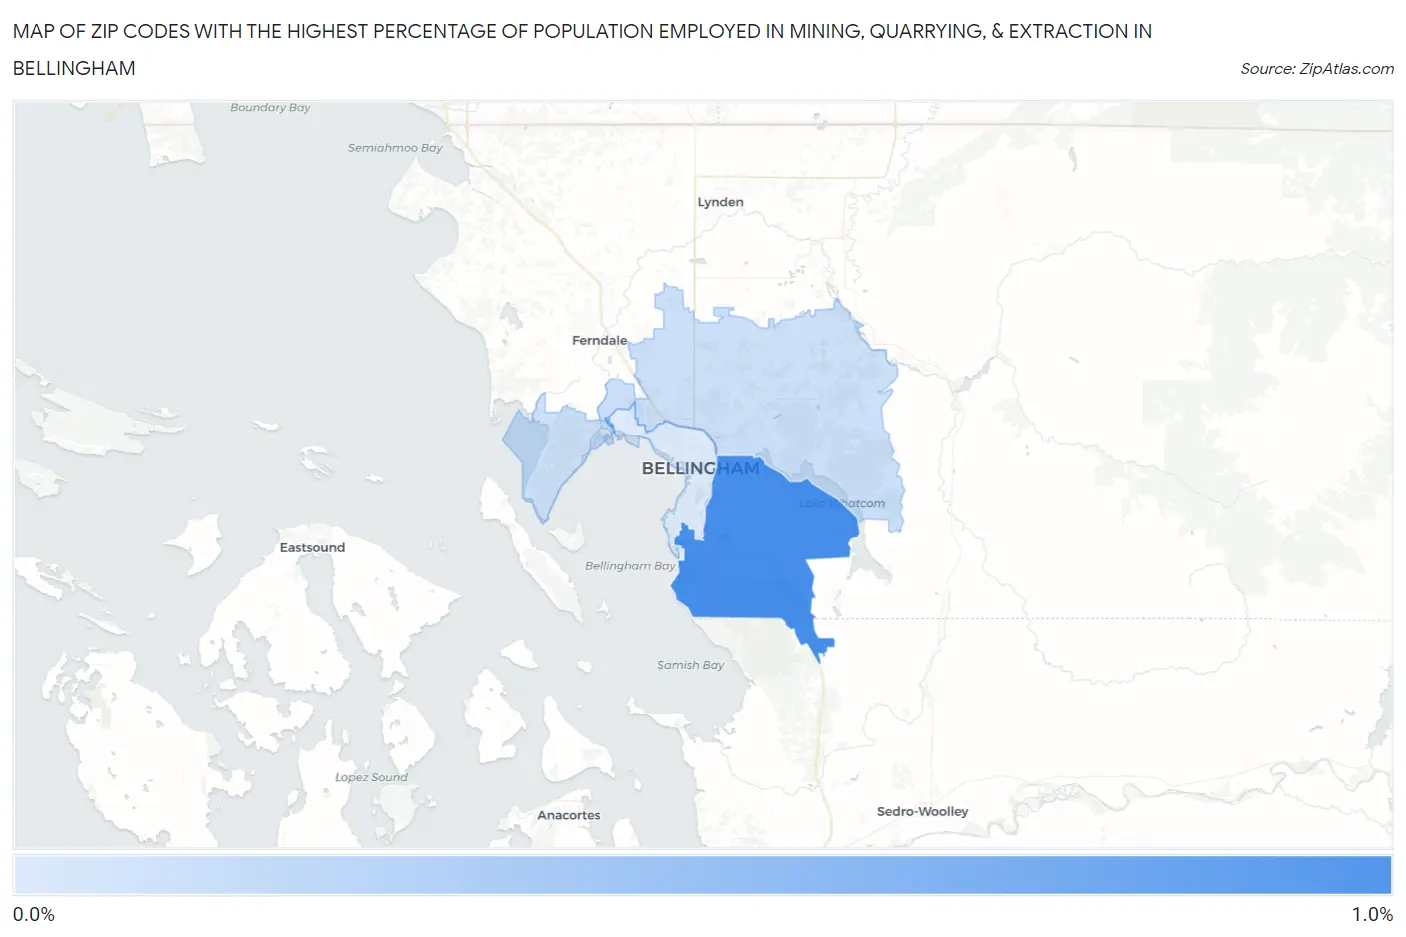
Map of Zip Codes with the Highest Percentage of Population Employed in Mining, Quarrying, & Extraction in Bellingham
0.056%
0.90%
Zip Codes with the Highest Percentage of Population Employed in Mining, Quarrying, & Extraction in Bellingham, WA
| Zip Code | % Employed | vs State | vs National | |
| 1. | 98229 | 0.90% | 0.087%(+0.816)#25 | 0.44%(+0.463)#5,647 |
| 2. | 98226 | 0.14% | 0.087%(+0.054)#101 | 0.44%(-0.300)#10,228 |
| 3. | 98225 | 0.056% | 0.087%(-0.030)#132 | 0.44%(-0.384)#11,569 |
1
Common Questions
What are the Top Zip Codes with the Highest Percentage of Population Employed in Mining, Quarrying, & Extraction in Bellingham, WA?
Top Zip Codes with the Highest Percentage of Population Employed in Mining, Quarrying, & Extraction in Bellingham, WA are:
What zip code has the Highest Percentage of Population Employed in Mining, Quarrying, & Extraction in Bellingham, WA?
98229 has the Highest Percentage of Population Employed in Mining, Quarrying, & Extraction in Bellingham, WA with 0.90%.
What is the Percentage of Population Employed in Mining, Quarrying, & Extraction in Bellingham, WA?
Percentage of Population Employed in Mining, Quarrying, & Extraction in Bellingham is 0.090%.
What is the Percentage of Population Employed in Mining, Quarrying, & Extraction in Washington?
Percentage of Population Employed in Mining, Quarrying, & Extraction in Washington is 0.087%.
What is the Percentage of Population Employed in Mining, Quarrying, & Extraction in the United States?
Percentage of Population Employed in Mining, Quarrying, & Extraction in the United States is 0.44%.