Turkish vs Laotian 2 or more Vehicles in Household
COMPARE
Turkish
Laotian
2 or more Vehicles in Household
2 or more Vehicles in Household Comparison
Turks
Laotians
54.3%
2 OR MORE VEHICLES IN HOUSEHOLD
13.0/ 100
METRIC RATING
207th/ 347
METRIC RANK
58.6%
2 OR MORE VEHICLES IN HOUSEHOLD
99.7/ 100
METRIC RATING
67th/ 347
METRIC RANK
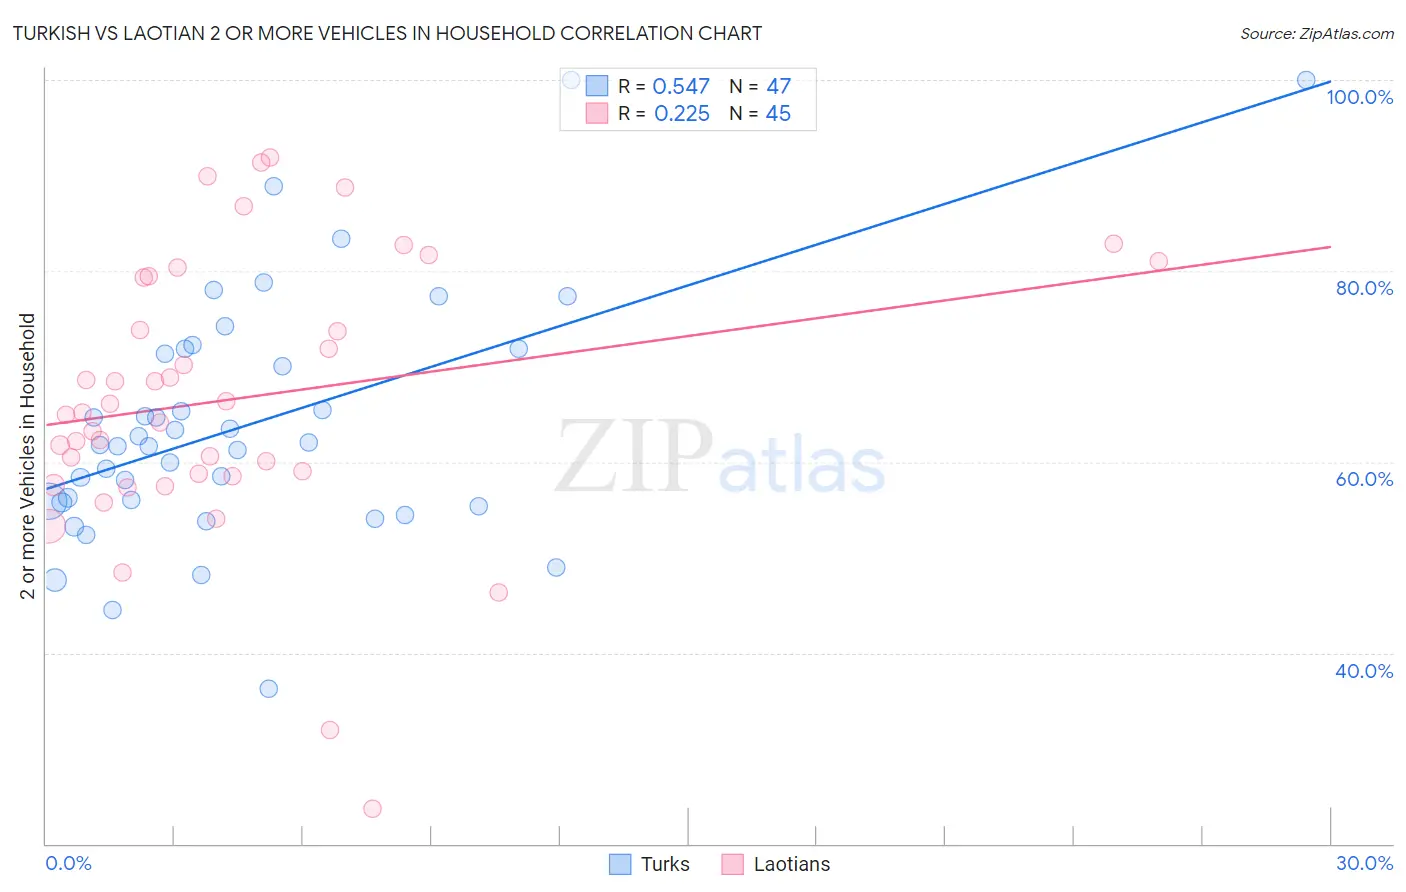
Turkish vs Laotian 2 or more Vehicles in Household Correlation Chart
The statistical analysis conducted on geographies consisting of 271,715,533 people shows a substantial positive correlation between the proportion of Turks and percentage of households with 2 or more vehicles available in the United States with a correlation coefficient (R) of 0.547 and weighted average of 54.3%. Similarly, the statistical analysis conducted on geographies consisting of 224,647,130 people shows a weak positive correlation between the proportion of Laotians and percentage of households with 2 or more vehicles available in the United States with a correlation coefficient (R) of 0.225 and weighted average of 58.6%, a difference of 7.9%.
2 or more Vehicles in Household Correlation Summary
| Measurement | Turkish | Laotian |
| Minimum | 36.3% | 23.7% |
| Maximum | 100.0% | 91.9% |
| Range | 63.7% | 68.2% |
| Mean | 63.9% | 66.6% |
| Median | 61.8% | 65.2% |
| Interquartile 25% (IQ1) | 55.8% | 58.6% |
| Interquartile 75% (IQ3) | 71.8% | 79.4% |
| Interquartile Range (IQR) | 16.0% | 20.8% |
| Standard Deviation (Sample) | 12.9% | 14.5% |
| Standard Deviation (Population) | 12.8% | 14.3% |
Similar Demographics by 2 or more Vehicles in Household
Demographics Similar to Turks by 2 or more Vehicles in Household
In terms of 2 or more vehicles in household, the demographic groups most similar to Turks are Immigrants from Latin America (54.3%, a difference of 0.010%), Cheyenne (54.3%, a difference of 0.060%), Immigrants from Belgium (54.3%, a difference of 0.070%), Egyptian (54.3%, a difference of 0.090%), and Immigrants from Bulgaria (54.3%, a difference of 0.090%).
| Demographics | Rating | Rank | 2 or more Vehicles in Household |
| Houma | 15.8 /100 | #200 | Poor 54.4% |
| Immigrants | Italy | 15.5 /100 | #201 | Poor 54.4% |
| Immigrants | North Macedonia | 14.9 /100 | #202 | Poor 54.4% |
| Immigrants | Peru | 14.3 /100 | #203 | Poor 54.4% |
| Immigrants | Belgium | 13.7 /100 | #204 | Poor 54.3% |
| Cheyenne | 13.6 /100 | #205 | Poor 54.3% |
| Immigrants | Latin America | 13.1 /100 | #206 | Poor 54.3% |
| Turks | 13.0 /100 | #207 | Poor 54.3% |
| Egyptians | 12.0 /100 | #208 | Poor 54.3% |
| Immigrants | Bulgaria | 12.0 /100 | #209 | Poor 54.3% |
| Immigrants | Saudi Arabia | 11.3 /100 | #210 | Poor 54.2% |
| Immigrants | Hungary | 11.3 /100 | #211 | Poor 54.2% |
| Immigrants | Chile | 11.1 /100 | #212 | Poor 54.2% |
| Guatemalans | 9.6 /100 | #213 | Tragic 54.1% |
| Immigrants | Czechoslovakia | 9.4 /100 | #214 | Tragic 54.1% |
Demographics Similar to Laotians by 2 or more Vehicles in Household
In terms of 2 or more vehicles in household, the demographic groups most similar to Laotians are Canadian (58.6%, a difference of 0.010%), Immigrants from Central America (58.6%, a difference of 0.020%), Croatian (58.6%, a difference of 0.020%), Portuguese (58.6%, a difference of 0.070%), and Pennsylvania German (58.5%, a difference of 0.13%).
| Demographics | Rating | Rank | 2 or more Vehicles in Household |
| French Canadians | 99.8 /100 | #60 | Exceptional 58.9% |
| Osage | 99.8 /100 | #61 | Exceptional 58.8% |
| Immigrants | Nonimmigrants | 99.8 /100 | #62 | Exceptional 58.8% |
| Mexican American Indians | 99.8 /100 | #63 | Exceptional 58.7% |
| Portuguese | 99.7 /100 | #64 | Exceptional 58.6% |
| Immigrants | Central America | 99.7 /100 | #65 | Exceptional 58.6% |
| Croatians | 99.7 /100 | #66 | Exceptional 58.6% |
| Laotians | 99.7 /100 | #67 | Exceptional 58.6% |
| Canadians | 99.7 /100 | #68 | Exceptional 58.6% |
| Pennsylvania Germans | 99.7 /100 | #69 | Exceptional 58.5% |
| Italians | 99.6 /100 | #70 | Exceptional 58.4% |
| Bangladeshis | 99.6 /100 | #71 | Exceptional 58.4% |
| Austrians | 99.6 /100 | #72 | Exceptional 58.4% |
| Bolivians | 99.6 /100 | #73 | Exceptional 58.3% |
| Immigrants | Afghanistan | 99.6 /100 | #74 | Exceptional 58.3% |