Turkish vs Immigrants from Jordan 2 or more Vehicles in Household
COMPARE
Turkish
Immigrants from Jordan
2 or more Vehicles in Household
2 or more Vehicles in Household Comparison
Turks
Immigrants from Jordan
54.3%
2 OR MORE VEHICLES IN HOUSEHOLD
13.0/ 100
METRIC RATING
207th/ 347
METRIC RANK
57.2%
2 OR MORE VEHICLES IN HOUSEHOLD
96.6/ 100
METRIC RATING
116th/ 347
METRIC RANK
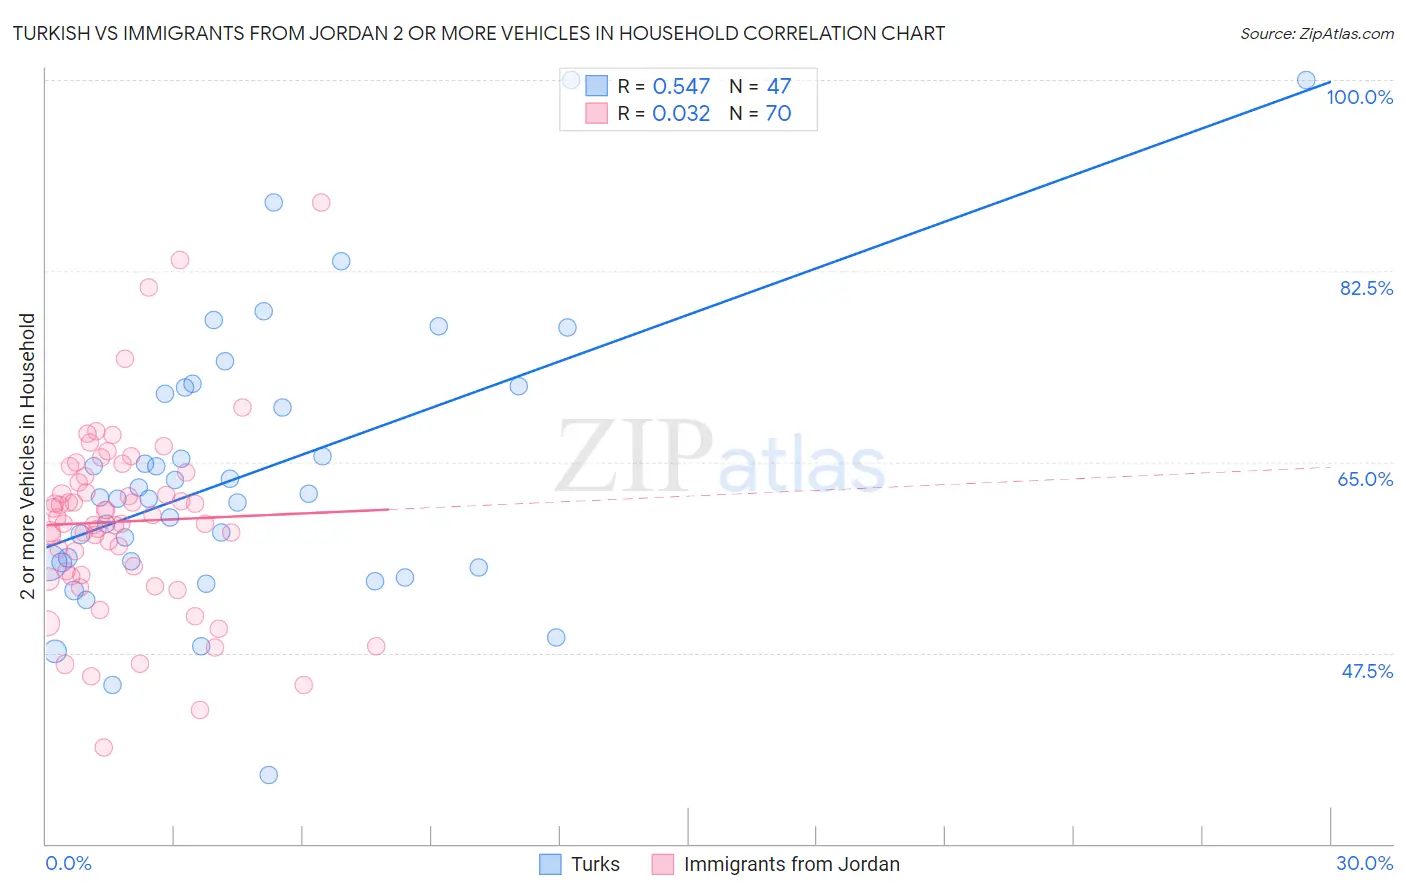
Turkish vs Immigrants from Jordan 2 or more Vehicles in Household Correlation Chart
The statistical analysis conducted on geographies consisting of 271,715,533 people shows a substantial positive correlation between the proportion of Turks and percentage of households with 2 or more vehicles available in the United States with a correlation coefficient (R) of 0.547 and weighted average of 54.3%. Similarly, the statistical analysis conducted on geographies consisting of 181,252,999 people shows no correlation between the proportion of Immigrants from Jordan and percentage of households with 2 or more vehicles available in the United States with a correlation coefficient (R) of 0.032 and weighted average of 57.2%, a difference of 5.3%.
2 or more Vehicles in Household Correlation Summary
| Measurement | Turkish | Immigrants from Jordan |
| Minimum | 36.3% | 38.9% |
| Maximum | 100.0% | 88.8% |
| Range | 63.7% | 49.9% |
| Mean | 63.9% | 59.5% |
| Median | 61.8% | 59.7% |
| Interquartile 25% (IQ1) | 55.8% | 54.7% |
| Interquartile 75% (IQ3) | 71.8% | 63.6% |
| Interquartile Range (IQR) | 16.0% | 8.9% |
| Standard Deviation (Sample) | 12.9% | 8.6% |
| Standard Deviation (Population) | 12.8% | 8.6% |
Similar Demographics by 2 or more Vehicles in Household
Demographics Similar to Turks by 2 or more Vehicles in Household
In terms of 2 or more vehicles in household, the demographic groups most similar to Turks are Immigrants from Latin America (54.3%, a difference of 0.010%), Cheyenne (54.3%, a difference of 0.060%), Immigrants from Belgium (54.3%, a difference of 0.070%), Egyptian (54.3%, a difference of 0.090%), and Immigrants from Bulgaria (54.3%, a difference of 0.090%).
| Demographics | Rating | Rank | 2 or more Vehicles in Household |
| Houma | 15.8 /100 | #200 | Poor 54.4% |
| Immigrants | Italy | 15.5 /100 | #201 | Poor 54.4% |
| Immigrants | North Macedonia | 14.9 /100 | #202 | Poor 54.4% |
| Immigrants | Peru | 14.3 /100 | #203 | Poor 54.4% |
| Immigrants | Belgium | 13.7 /100 | #204 | Poor 54.3% |
| Cheyenne | 13.6 /100 | #205 | Poor 54.3% |
| Immigrants | Latin America | 13.1 /100 | #206 | Poor 54.3% |
| Turks | 13.0 /100 | #207 | Poor 54.3% |
| Egyptians | 12.0 /100 | #208 | Poor 54.3% |
| Immigrants | Bulgaria | 12.0 /100 | #209 | Poor 54.3% |
| Immigrants | Saudi Arabia | 11.3 /100 | #210 | Poor 54.2% |
| Immigrants | Hungary | 11.3 /100 | #211 | Poor 54.2% |
| Immigrants | Chile | 11.1 /100 | #212 | Poor 54.2% |
| Guatemalans | 9.6 /100 | #213 | Tragic 54.1% |
| Immigrants | Czechoslovakia | 9.4 /100 | #214 | Tragic 54.1% |
Demographics Similar to Immigrants from Jordan by 2 or more Vehicles in Household
In terms of 2 or more vehicles in household, the demographic groups most similar to Immigrants from Jordan are Chippewa (57.2%, a difference of 0.010%), Immigrants from Lebanon (57.2%, a difference of 0.070%), Zimbabwean (57.2%, a difference of 0.10%), Iraqi (57.1%, a difference of 0.19%), and Asian (57.0%, a difference of 0.36%).
| Demographics | Rating | Rank | 2 or more Vehicles in Household |
| Immigrants | North America | 98.1 /100 | #109 | Exceptional 57.5% |
| Japanese | 98.0 /100 | #110 | Exceptional 57.5% |
| Greeks | 98.0 /100 | #111 | Exceptional 57.5% |
| Pueblo | 98.0 /100 | #112 | Exceptional 57.5% |
| Zimbabweans | 96.9 /100 | #113 | Exceptional 57.2% |
| Immigrants | Lebanon | 96.8 /100 | #114 | Exceptional 57.2% |
| Chippewa | 96.6 /100 | #115 | Exceptional 57.2% |
| Immigrants | Jordan | 96.6 /100 | #116 | Exceptional 57.2% |
| Iraqis | 95.8 /100 | #117 | Exceptional 57.1% |
| Asians | 95.1 /100 | #118 | Exceptional 57.0% |
| Natives/Alaskans | 95.0 /100 | #119 | Exceptional 57.0% |
| Costa Ricans | 94.7 /100 | #120 | Exceptional 56.9% |
| Sioux | 93.8 /100 | #121 | Exceptional 56.8% |
| Immigrants | South Africa | 92.5 /100 | #122 | Exceptional 56.7% |
| Australians | 91.8 /100 | #123 | Exceptional 56.7% |