Turkish vs Immigrants from Dominican Republic 2 or more Vehicles in Household
COMPARE
Turkish
Immigrants from Dominican Republic
2 or more Vehicles in Household
2 or more Vehicles in Household Comparison
Turks
Immigrants from Dominican Republic
54.3%
2 OR MORE VEHICLES IN HOUSEHOLD
13.0/ 100
METRIC RATING
207th/ 347
METRIC RANK
33.2%
2 OR MORE VEHICLES IN HOUSEHOLD
0.0/ 100
METRIC RATING
345th/ 347
METRIC RANK
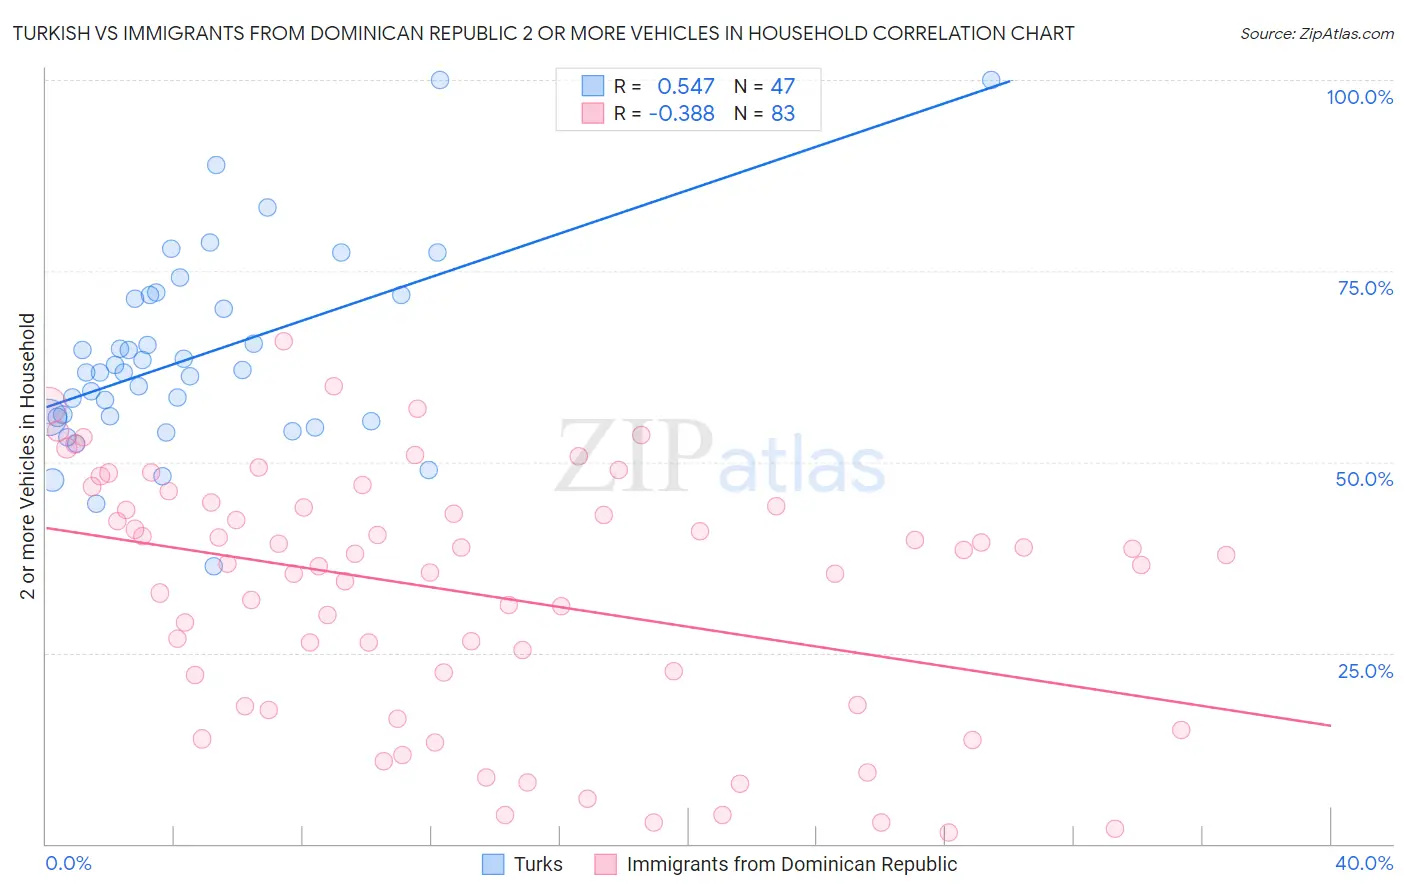
Turkish vs Immigrants from Dominican Republic 2 or more Vehicles in Household Correlation Chart
The statistical analysis conducted on geographies consisting of 271,715,533 people shows a substantial positive correlation between the proportion of Turks and percentage of households with 2 or more vehicles available in the United States with a correlation coefficient (R) of 0.547 and weighted average of 54.3%. Similarly, the statistical analysis conducted on geographies consisting of 274,967,737 people shows a mild negative correlation between the proportion of Immigrants from Dominican Republic and percentage of households with 2 or more vehicles available in the United States with a correlation coefficient (R) of -0.388 and weighted average of 33.2%, a difference of 63.4%.
2 or more Vehicles in Household Correlation Summary
| Measurement | Turkish | Immigrants from Dominican Republic |
| Minimum | 36.3% | 1.5% |
| Maximum | 100.0% | 65.8% |
| Range | 63.7% | 64.3% |
| Mean | 63.9% | 32.9% |
| Median | 61.8% | 36.6% |
| Interquartile 25% (IQ1) | 55.8% | 18.1% |
| Interquartile 75% (IQ3) | 71.8% | 44.2% |
| Interquartile Range (IQR) | 16.0% | 26.1% |
| Standard Deviation (Sample) | 12.9% | 16.2% |
| Standard Deviation (Population) | 12.8% | 16.1% |
Similar Demographics by 2 or more Vehicles in Household
Demographics Similar to Turks by 2 or more Vehicles in Household
In terms of 2 or more vehicles in household, the demographic groups most similar to Turks are Immigrants from Latin America (54.3%, a difference of 0.010%), Cheyenne (54.3%, a difference of 0.060%), Immigrants from Belgium (54.3%, a difference of 0.070%), Egyptian (54.3%, a difference of 0.090%), and Immigrants from Bulgaria (54.3%, a difference of 0.090%).
| Demographics | Rating | Rank | 2 or more Vehicles in Household |
| Houma | 15.8 /100 | #200 | Poor 54.4% |
| Immigrants | Italy | 15.5 /100 | #201 | Poor 54.4% |
| Immigrants | North Macedonia | 14.9 /100 | #202 | Poor 54.4% |
| Immigrants | Peru | 14.3 /100 | #203 | Poor 54.4% |
| Immigrants | Belgium | 13.7 /100 | #204 | Poor 54.3% |
| Cheyenne | 13.6 /100 | #205 | Poor 54.3% |
| Immigrants | Latin America | 13.1 /100 | #206 | Poor 54.3% |
| Turks | 13.0 /100 | #207 | Poor 54.3% |
| Egyptians | 12.0 /100 | #208 | Poor 54.3% |
| Immigrants | Bulgaria | 12.0 /100 | #209 | Poor 54.3% |
| Immigrants | Saudi Arabia | 11.3 /100 | #210 | Poor 54.2% |
| Immigrants | Hungary | 11.3 /100 | #211 | Poor 54.2% |
| Immigrants | Chile | 11.1 /100 | #212 | Poor 54.2% |
| Guatemalans | 9.6 /100 | #213 | Tragic 54.1% |
| Immigrants | Czechoslovakia | 9.4 /100 | #214 | Tragic 54.1% |
Demographics Similar to Immigrants from Dominican Republic by 2 or more Vehicles in Household
In terms of 2 or more vehicles in household, the demographic groups most similar to Immigrants from Dominican Republic are Yup'ik (34.9%, a difference of 5.2%), Immigrants from Guyana (35.0%, a difference of 5.3%), Dominican (35.3%, a difference of 6.3%), Guyanese (35.4%, a difference of 6.5%), and British West Indian (35.4%, a difference of 6.5%).
| Demographics | Rating | Rank | 2 or more Vehicles in Household |
| Immigrants | Ecuador | 0.0 /100 | #333 | Tragic 40.5% |
| Immigrants | Trinidad and Tobago | 0.0 /100 | #334 | Tragic 40.3% |
| Immigrants | Bangladesh | 0.0 /100 | #335 | Tragic 38.8% |
| Vietnamese | 0.0 /100 | #336 | Tragic 38.5% |
| Barbadians | 0.0 /100 | #337 | Tragic 38.3% |
| Immigrants | Uzbekistan | 0.0 /100 | #338 | Tragic 37.9% |
| Immigrants | Barbados | 0.0 /100 | #339 | Tragic 35.8% |
| British West Indians | 0.0 /100 | #340 | Tragic 35.4% |
| Guyanese | 0.0 /100 | #341 | Tragic 35.4% |
| Dominicans | 0.0 /100 | #342 | Tragic 35.3% |
| Immigrants | Guyana | 0.0 /100 | #343 | Tragic 35.0% |
| Yup'ik | 0.0 /100 | #344 | Tragic 34.9% |
| Immigrants | Dominican Republic | 0.0 /100 | #345 | Tragic 33.2% |
| Immigrants | St. Vincent and the Grenadines | 0.0 /100 | #346 | Tragic 31.0% |
| Immigrants | Grenada | 0.0 /100 | #347 | Tragic 28.7% |