Area Code 731 Map & Demographics
Area Code 731 Map
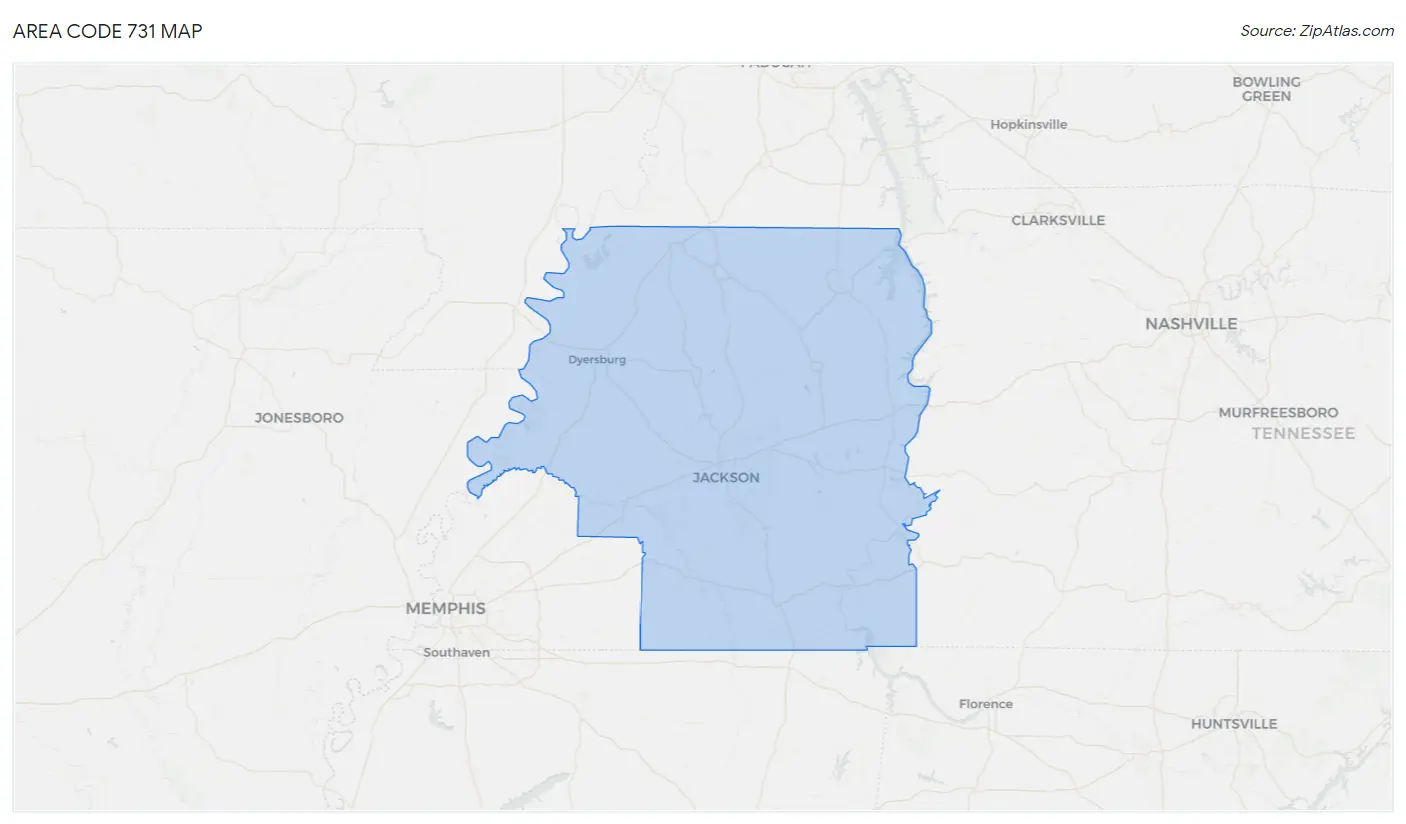
Area Code 731 Overview
$26,846
PER CAPITA INCOME
$63,642
AVG FAMILY INCOME
$50,976
AVG HOUSEHOLD INCOME
26.1%
WAGE / INCOME GAP [ % ]
73.9¢/ $1
WAGE / INCOME GAP [ $ ]
$10,623
FAMILY INCOME DEFICIT
42.95
INEQUALITY / GINI INDEX
523,654
TOTAL POPULATION
257,163
MALE POPULATION
266,491
FEMALE POPULATION
96.50
MALES / 100 FEMALES
103.63
FEMALES / 100 MALES
44.0
MEDIAN AGE
3.1
AVG FAMILY SIZE
2.5
AVG HOUSEHOLD SIZE
228,162
LABOR FORCE [ PEOPLE ]
53.9%
PERCENT IN LABOR FORCE
6.5%
UNEMPLOYMENT RATE
Income in Area Code 731
Income Overview in Area Code 731
Per Capita Income in Area Code 731 is $26,846, while median incomes of families and households are $63,642 and $50,976 respectively.
| Characteristic | Number | Measure |
| Per Capita Income | 523,654 | $26,846 |
| Median Family Income | 131,850 | $63,642 |
| Mean Family Income | 131,850 | $7,802,487 |
| Median Household Income | 203,854 | $50,976 |
| Mean Household Income | 203,854 | $6,607,809 |
| Income Deficit | 131,850 | $10,623 |
| Wage / Income Gap (%) | 523,654 | 26.11% |
| Wage / Income Gap ($) | 523,654 | 73.89¢ per $1 |
| Gini / Inequality Index | 523,654 | 42.95 |
Earnings by Sex in Area Code 731
Average Earnings in Area Code 731 are $35,118, $40,914 for men and $30,055 for women, a difference of 26.5%.
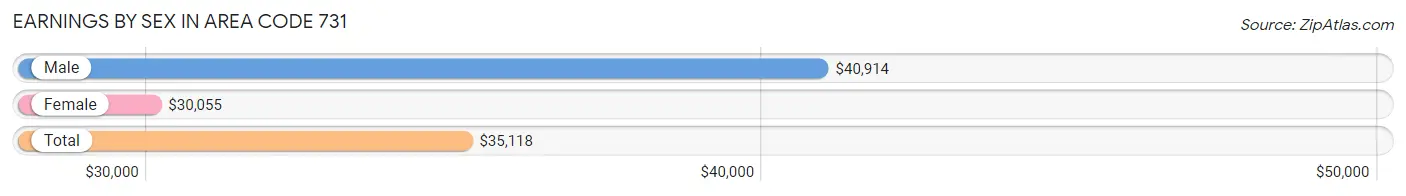
| Sex | Number | Average Earnings |
| Male | 125,463 (51.7%) | $40,914 |
| Female | 117,025 (48.3%) | $30,055 |
| Total | 242,488 (100.0%) | $35,118 |
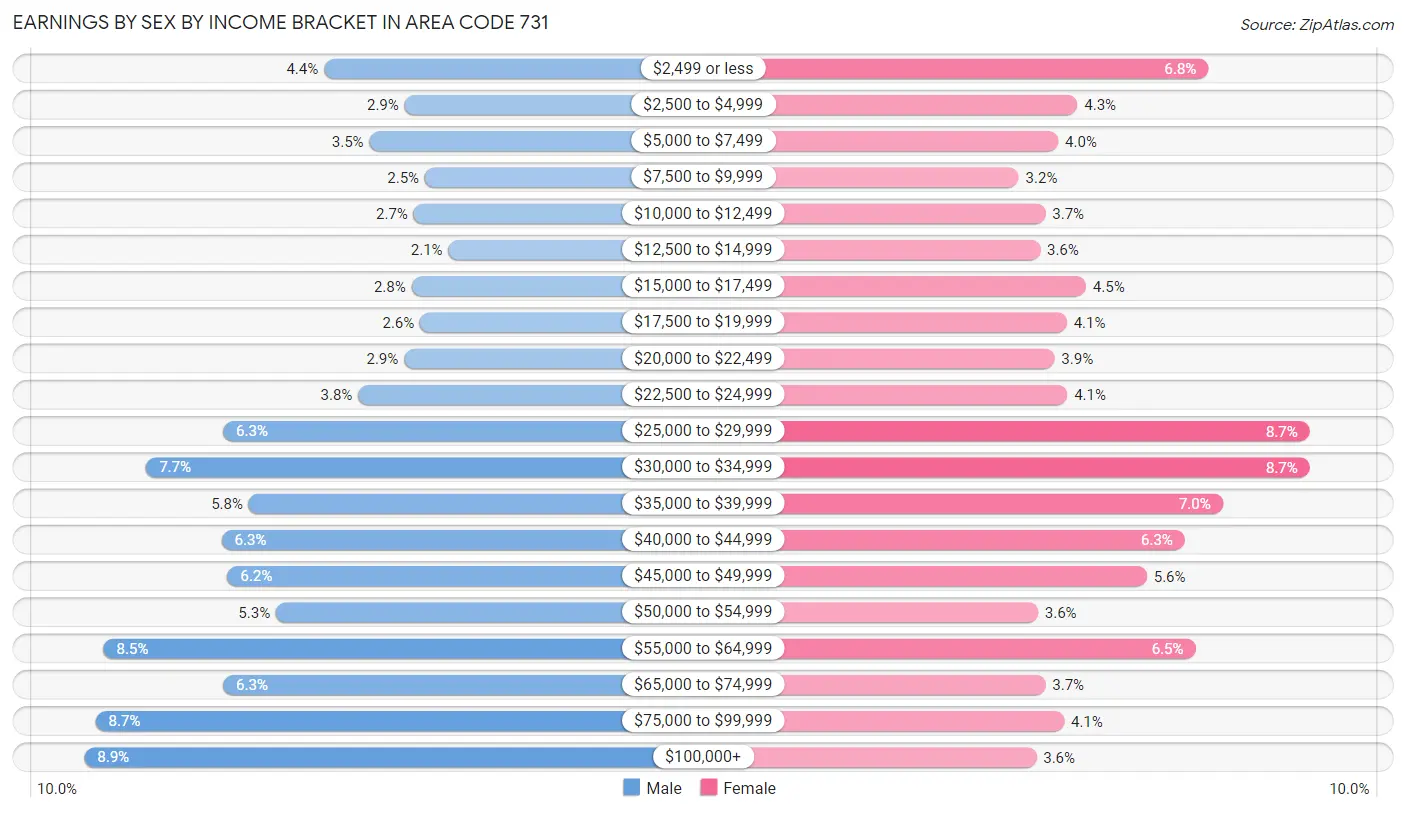
Earnings by Sex by Income Bracket in Area Code 731
The most common earnings brackets in Area Code 731 are $100,000+ for men (11,137 | 8.9%) and $25,000 to $29,999 for women (10,141 | 8.7%).
| Income | Male | Female |
| $2,499 or less | 5,506 (4.4%) | 7,925 (6.8%) |
| $2,500 to $4,999 | 3,612 (2.9%) | 5,056 (4.3%) |
| $5,000 to $7,499 | 4,443 (3.5%) | 4,637 (4.0%) |
| $7,500 to $9,999 | 3,131 (2.5%) | 3,767 (3.2%) |
| $10,000 to $12,499 | 3,395 (2.7%) | 4,351 (3.7%) |
| $12,500 to $14,999 | 2,581 (2.1%) | 4,236 (3.6%) |
| $15,000 to $17,499 | 3,446 (2.8%) | 5,244 (4.5%) |
| $17,500 to $19,999 | 3,250 (2.6%) | 4,816 (4.1%) |
| $20,000 to $22,499 | 3,623 (2.9%) | 4,549 (3.9%) |
| $22,500 to $24,999 | 4,708 (3.7%) | 4,836 (4.1%) |
| $25,000 to $29,999 | 7,875 (6.3%) | 10,141 (8.7%) |
| $30,000 to $34,999 | 9,690 (7.7%) | 10,141 (8.7%) |
| $35,000 to $39,999 | 7,279 (5.8%) | 8,239 (7.0%) |
| $40,000 to $44,999 | 7,921 (6.3%) | 7,406 (6.3%) |
| $45,000 to $49,999 | 7,776 (6.2%) | 6,574 (5.6%) |
| $50,000 to $54,999 | 6,642 (5.3%) | 4,195 (3.6%) |
| $55,000 to $64,999 | 10,694 (8.5%) | 7,640 (6.5%) |
| $65,000 to $74,999 | 7,878 (6.3%) | 4,353 (3.7%) |
| $75,000 to $99,999 | 10,876 (8.7%) | 4,768 (4.1%) |
| $100,000+ | 11,137 (8.9%) | 4,151 (3.5%) |
| Total | 125,463 (100.0%) | 117,025 (100.0%) |
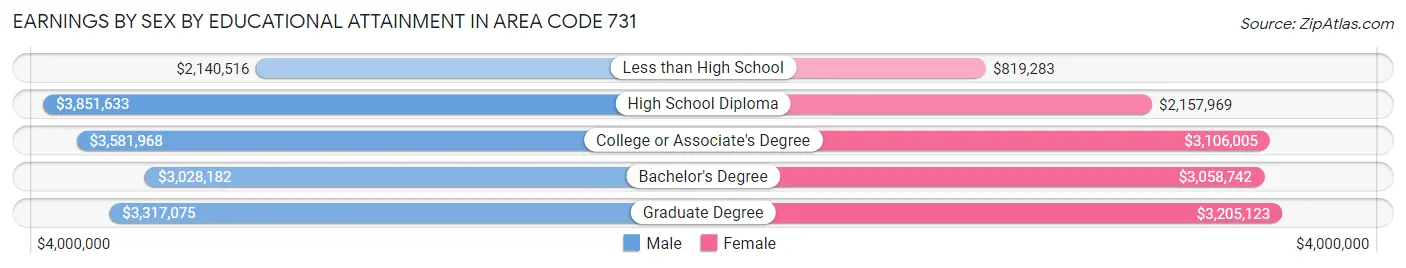
Earnings by Sex by Educational Attainment in Area Code 731
Average earnings in Area Code 731 are $4,440,792 for men and $3,179,694 for women, a difference of 28.4%. Men with an educational attainment of high school diploma enjoy the highest average annual earnings of $3,851,633, while those with less than high school education earn the least with $2,140,516. Women with an educational attainment of graduate degree earn the most with the average annual earnings of $3,205,123, while those with less than high school education have the smallest earnings of $819,283.
| Educational Attainment | Male Income | Female Income |
| Less than High School | $2,140,516 | $819,283 |
| High School Diploma | $3,851,633 | $2,157,969 |
| College or Associate's Degree | $3,581,968 | $3,106,005 |
| Bachelor's Degree | $3,028,182 | $3,058,742 |
| Graduate Degree | $3,317,075 | $3,205,123 |
| Total | $4,440,792 | $3,179,694 |
Family Income in Area Code 731
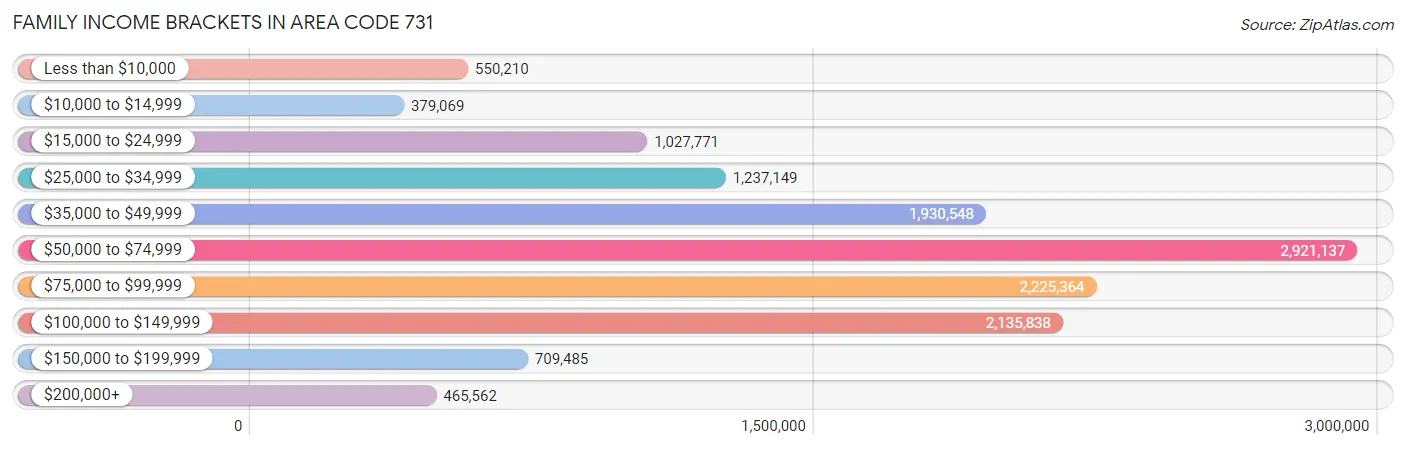
Family Income Brackets in Area Code 731
According to the Area Code 731 family income data, there are 2,921,137 families falling into the $50,000 to $74,999 income range, which is the most common income bracket and makes up 2,215.5% of all families. Conversely, the $10,000 to $14,999 income bracket is the least frequent group with only 379,069 families (287.5%) belonging to this category.
| Income Bracket | # Families | % Families |
| Less than $10,000 | 550,210 | 417.3% |
| $10,000 to $14,999 | 379,069 | 287.5% |
| $15,000 to $24,999 | 1,027,771 | 779.5% |
| $25,000 to $34,999 | 1,237,149 | 938.3% |
| $35,000 to $49,999 | 1,930,548 | 1,464.2% |
| $50,000 to $74,999 | 2,921,137 | 2,215.5% |
| $75,000 to $99,999 | 2,225,364 | 1,687.8% |
| $100,000 to $149,999 | 2,135,838 | 1,619.9% |
| $150,000 to $199,999 | 709,485 | 538.1% |
| $200,000+ | 465,562 | 353.1% |
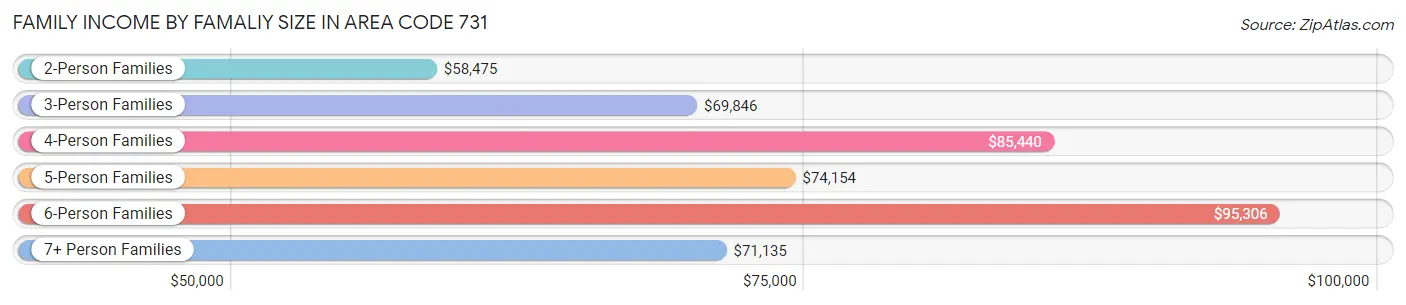
Family Income by Famaliy Size in Area Code 731
6-person families (3,002 | 2.3%) account for the highest median family income in Area Code 731 with $95,306 per family, while 2-person families (67,728 | 51.4%) have the highest median income of $29,237 per family member.
| Income Bracket | # Families | Median Income |
| 2-Person Families | 67,728 (51.4%) | $58,475 |
| 3-Person Families | 29,748 (22.6%) | $69,846 |
| 4-Person Families | 20,623 (15.6%) | $85,440 |
| 5-Person Families | 9,289 (7.0%) | $74,154 |
| 6-Person Families | 3,002 (2.3%) | $95,306 |
| 7+ Person Families | 1,460 (1.1%) | $71,135 |
| Total | 131,850 (100.0%) | $63,642 |
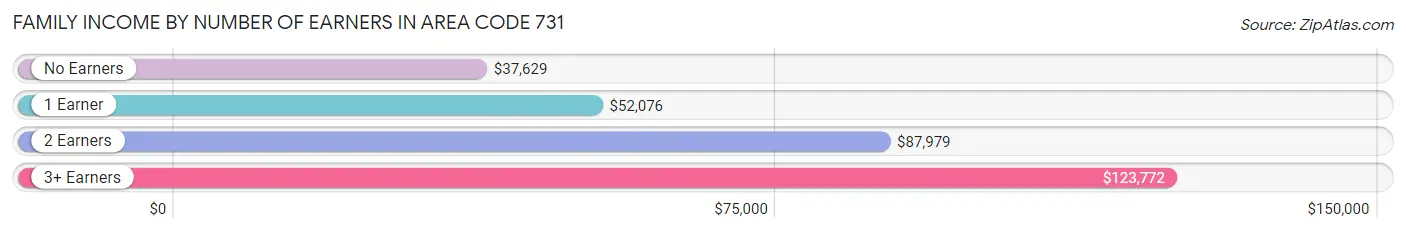
Family Income by Number of Earners in Area Code 731
The median family income in Area Code 731 is $63,642, with families comprising 3+ earners (10,415) having the highest median family income of $123,772, while families with no earners (26,541) have the lowest median family income of $37,629, accounting for 7.9% and 20.1% of families, respectively.
| Number of Earners | # Families | Median Income |
| No Earners | 26,541 (20.1%) | $37,629 |
| 1 Earner | 46,623 (35.4%) | $52,076 |
| 2 Earners | 48,271 (36.6%) | $87,979 |
| 3+ Earners | 10,415 (7.9%) | $123,772 |
| Total | 131,850 (100.0%) | $63,642 |
Household Income in Area Code 731
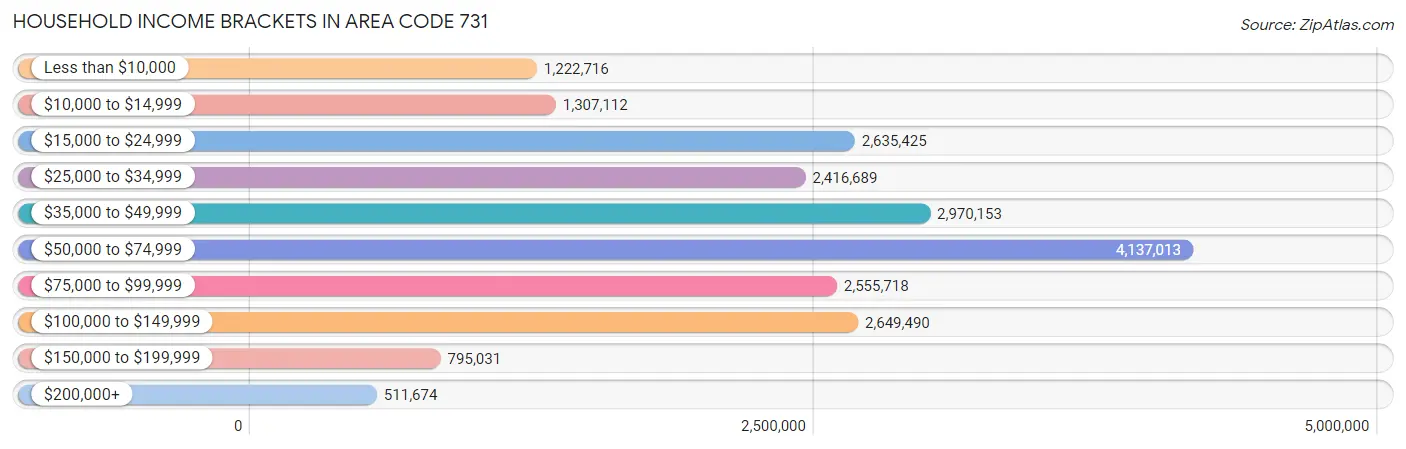
Household Income Brackets in Area Code 731
With 4,137,013 households falling in the category, the $50,000 to $74,999 income range is the most frequent in Area Code 731, accounting for 2,029.4% of all households. In contrast, only 511,674 households (251.0%) fall into the $200,000+ income bracket, making it the least populous group.
| Income Bracket | # Households | % Households |
| Less than $10,000 | 1,222,716 | 599.8% |
| $10,000 to $14,999 | 1,307,112 | 641.2% |
| $15,000 to $24,999 | 2,635,425 | 1,292.8% |
| $25,000 to $34,999 | 2,416,689 | 1,185.5% |
| $35,000 to $49,999 | 2,970,153 | 1,457.0% |
| $50,000 to $74,999 | 4,137,013 | 2,029.4% |
| $75,000 to $99,999 | 2,555,718 | 1,253.7% |
| $100,000 to $149,999 | 2,649,490 | 1,299.7% |
| $150,000 to $199,999 | 795,031 | 390.0% |
| $200,000+ | 511,674 | 251.0% |
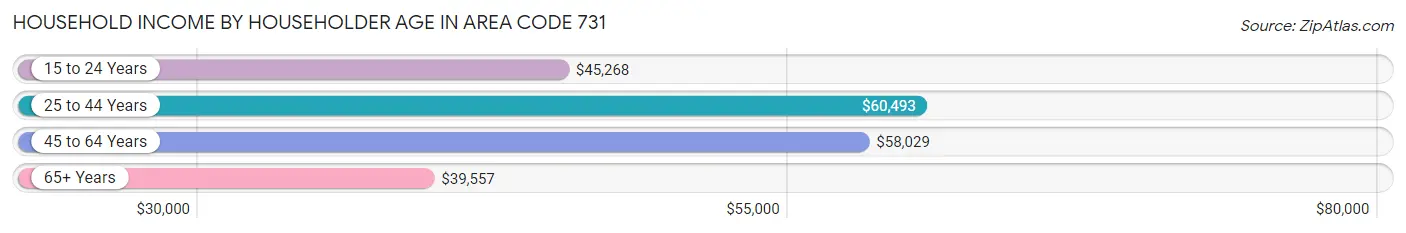
Household Income by Householder Age in Area Code 731
The median household income in Area Code 731 is $50,976, with the highest median household income of $60,493 found in the 25 to 44 years age bracket for the primary householder. A total of 58,147 households (28.5%) fall into this category. Meanwhile, the 65+ years age bracket for the primary householder has the lowest median household income of $39,557, with 62,042 households (30.4%) in this group.
| Income Bracket | # Households | Median Income |
| 15 to 24 Years | 7,516 (3.7%) | $45,268 |
| 25 to 44 Years | 58,147 (28.5%) | $60,493 |
| 45 to 64 Years | 76,149 (37.3%) | $58,029 |
| 65+ Years | 62,042 (30.4%) | $39,557 |
| Total | 203,854 (100.0%) | $50,976 |
Poverty in Area Code 731
Income Below Poverty by Sex and Age in Area Code 731
With 15.7% poverty level for males and 19.1% for females among the residents of Area Code 731, under 5 year old males and 6 to 11 year old females are the most vulnerable to poverty, with 3,963 males (28.2%) and 4,720 females (25.8%) in their respective age groups living below the poverty level.
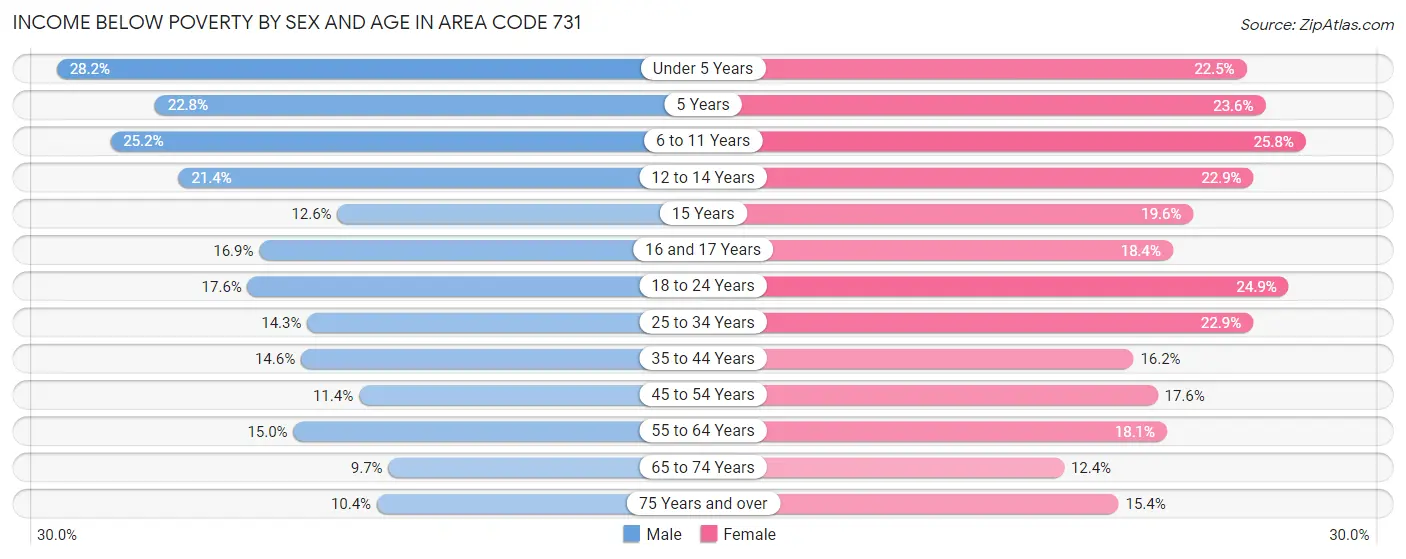
| Age Bracket | Male | Female |
| Under 5 Years | 3,963 (28.2%) | 3,122 (22.5%) |
| 5 Years | 709 (22.8%) | 884 (23.6%) |
| 6 to 11 Years | 4,899 (25.2%) | 4,720 (25.8%) |
| 12 to 14 Years | 2,134 (21.4%) | 2,104 (22.9%) |
| 15 Years | 465 (12.6%) | 653 (19.6%) |
| 16 and 17 Years | 1,131 (16.9%) | 1,246 (18.4%) |
| 18 to 24 Years | 3,803 (17.6%) | 5,278 (24.9%) |
| 25 to 34 Years | 4,180 (14.3%) | 6,963 (22.9%) |
| 35 to 44 Years | 4,101 (14.6%) | 4,970 (16.2%) |
| 45 to 54 Years | 3,461 (11.4%) | 5,598 (17.6%) |
| 55 to 64 Years | 5,173 (15.0%) | 6,670 (18.1%) |
| 65 to 74 Years | 2,563 (9.7%) | 3,740 (12.4%) |
| 75 Years and over | 1,608 (10.4%) | 3,466 (15.4%) |
| Total | 38,190 (15.7%) | 49,414 (19.1%) |
Income Above Poverty by Sex and Age in Area Code 731
According to the poverty statistics in Area Code 731, males aged 65 to 74 years and females aged 65 to 74 years are the age groups that are most secure financially, with 90.3% of males and 87.6% of females in these age groups living above the poverty line.
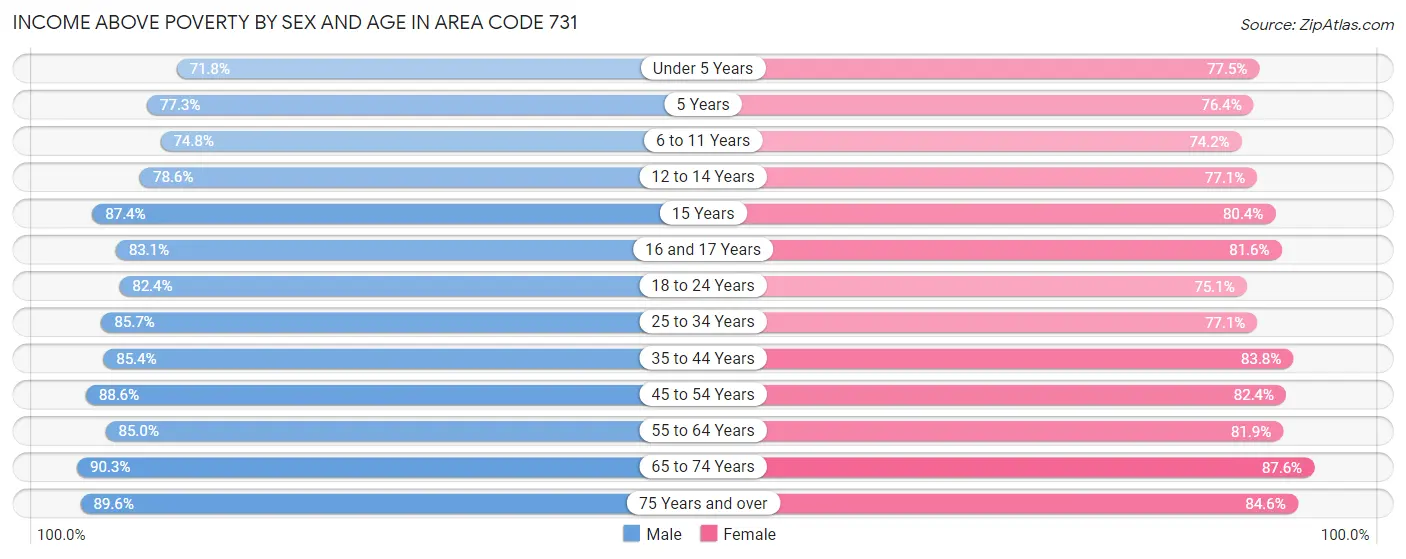
| Age Bracket | Male | Female |
| Under 5 Years | 10,083 (71.8%) | 10,738 (77.5%) |
| 5 Years | 2,408 (77.2%) | 2,865 (76.4%) |
| 6 to 11 Years | 14,521 (74.8%) | 13,550 (74.2%) |
| 12 to 14 Years | 7,825 (78.6%) | 7,077 (77.1%) |
| 15 Years | 3,232 (87.4%) | 2,683 (80.4%) |
| 16 and 17 Years | 5,548 (83.1%) | 5,515 (81.6%) |
| 18 to 24 Years | 17,829 (82.4%) | 15,939 (75.1%) |
| 25 to 34 Years | 25,135 (85.7%) | 23,445 (77.1%) |
| 35 to 44 Years | 23,969 (85.4%) | 25,629 (83.8%) |
| 45 to 54 Years | 26,943 (88.6%) | 26,245 (82.4%) |
| 55 to 64 Years | 29,243 (85.0%) | 30,171 (81.9%) |
| 65 to 74 Years | 23,755 (90.3%) | 26,492 (87.6%) |
| 75 Years and over | 13,883 (89.6%) | 19,027 (84.6%) |
| Total | 204,374 (84.3%) | 209,376 (80.9%) |
Income Below Poverty Among Married-Couple Families in Area Code 731
The poverty statistics for married-couple families in Area Code 731 show that 6.4% or 6,018 of the total 94,141 families live below the poverty line. Families with 5 or more children have the highest poverty rate of 24.2%, comprising of 156 families. On the other hand, families with no children have the lowest poverty rate of 5.3%, which includes 3,132 families.
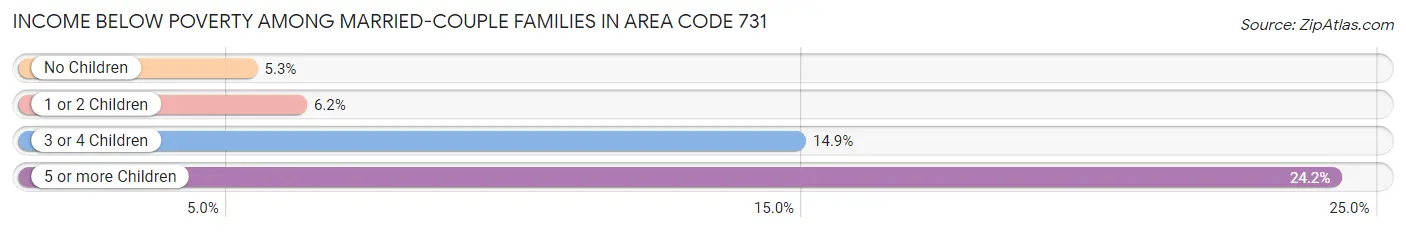
| Children | Above Poverty | Below Poverty |
| No Children | 55,551 (94.7%) | 3,132 (5.3%) |
| 1 or 2 Children | 26,488 (93.8%) | 1,751 (6.2%) |
| 3 or 4 Children | 5,596 (85.1%) | 979 (14.9%) |
| 5 or more Children | 488 (75.8%) | 156 (24.2%) |
| Total | 88,123 (93.6%) | 6,018 (6.4%) |
Income Below Poverty Among Single-Parent Households in Area Code 731
According to the poverty data in Area Code 731, 19.7% or 1,865 single-father households and 34.4% or 9,704 single-mother households are living below the poverty line. Among single-father households, those with 5 or more children have the highest poverty rate, with 43 households (93.5%) experiencing poverty. Likewise, among single-mother households, those with 5 or more children have the highest poverty rate, with 166 households (79.8%) falling below the poverty line.
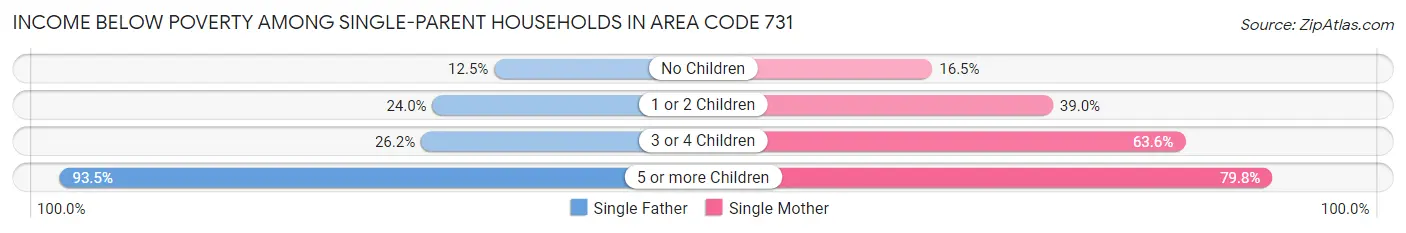
| Children | Single Father | Single Mother |
| No Children | 501 (12.5%) | 1,634 (16.5%) |
| 1 or 2 Children | 1,153 (24.0%) | 5,738 (39.0%) |
| 3 or 4 Children | 168 (26.2%) | 2,166 (63.6%) |
| 5 or more Children | 43 (93.5%) | 166 (79.8%) |
| Total | 1,865 (19.7%) | 9,704 (34.4%) |
Income Below Poverty Among Married-Couple vs Single-Parent Households in Area Code 731
The poverty data for Area Code 731 shows that 6,018 of the married-couple family households (6.4%) and 11,569 of the single-parent households (30.7%) are living below the poverty level. Within the married-couple family households, those with 5 or more children have the highest poverty rate, with 156 households (24.2%) falling below the poverty line. Among the single-parent households, those with 5 or more children have the highest poverty rate, with 209 household (82.3%) living below poverty.
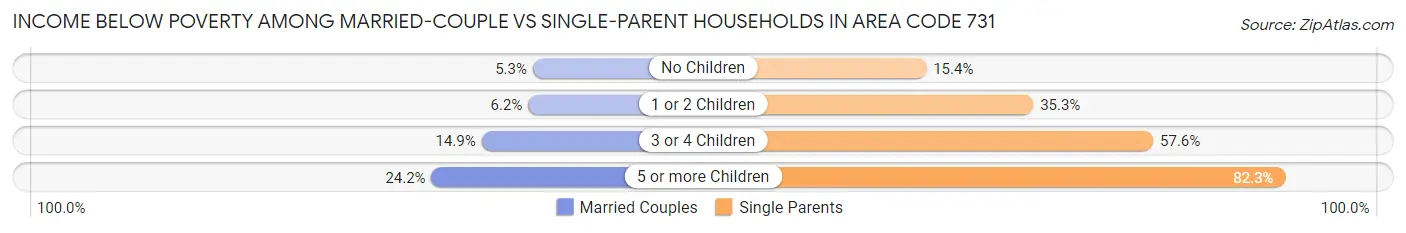
| Children | Married-Couple Families | Single-Parent Households |
| No Children | 3,132 (5.3%) | 2,135 (15.4%) |
| 1 or 2 Children | 1,751 (6.2%) | 6,891 (35.3%) |
| 3 or 4 Children | 979 (14.9%) | 2,334 (57.6%) |
| 5 or more Children | 156 (24.2%) | 209 (82.3%) |
| Total | 6,018 (6.4%) | 11,569 (30.7%) |
Race in Area Code 731
The most populous races in Area Code 731 are White / Caucasian (389,214 | 74.3%), Black / African American (103,250 | 19.7%), and Two or more Races (20,315 | 3.9%).
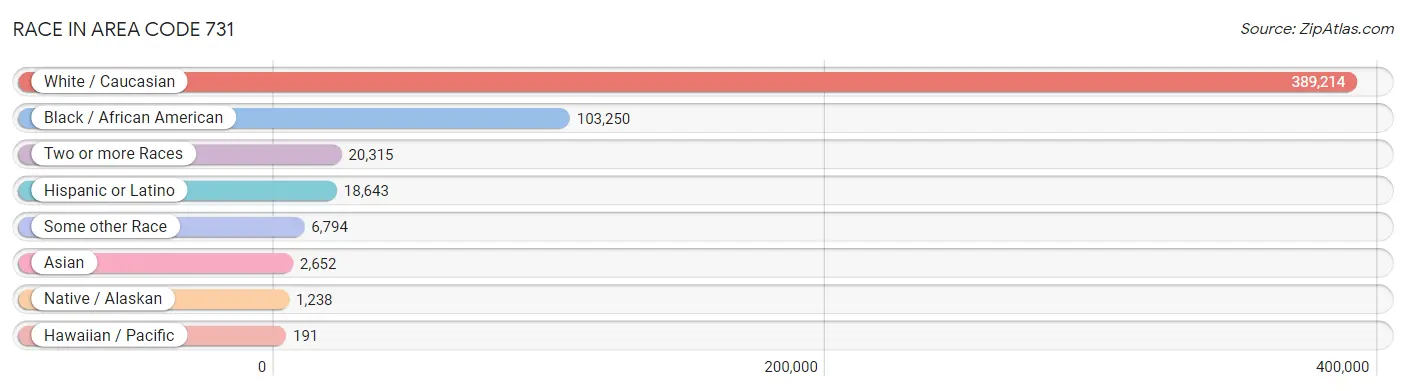
| Race | # Population | % Population |
| Asian | 2,652 | 0.5% |
| Black / African American | 103,250 | 19.7% |
| Hawaiian / Pacific | 191 | 0.0% |
| Hispanic or Latino | 18,643 | 3.6% |
| Native / Alaskan | 1,238 | 0.2% |
| White / Caucasian | 389,214 | 74.3% |
| Two or more Races | 20,315 | 3.9% |
| Some other Race | 6,794 | 1.3% |
| Total | 523,654 | 100.0% |
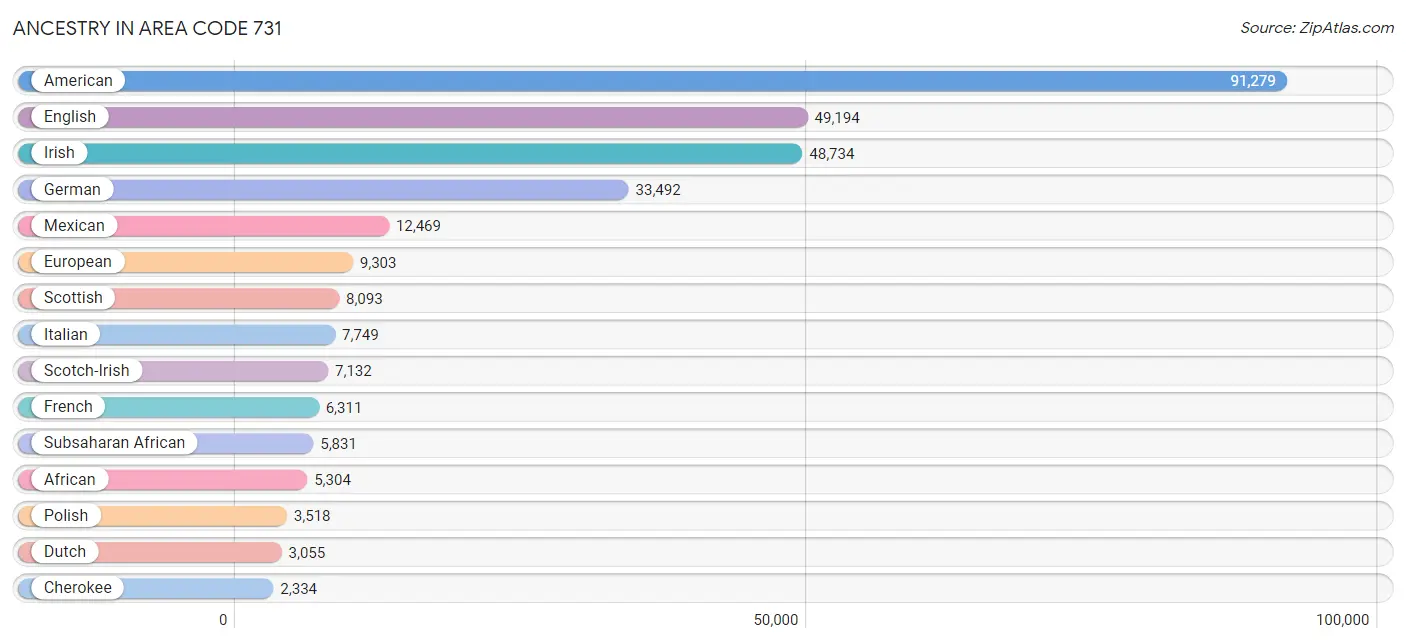
Ancestry in Area Code 731
The most populous ancestries reported in Area Code 731 are American (91,279 | 17.4%), English (49,194 | 9.4%), Irish (48,734 | 9.3%), German (33,492 | 6.4%), and Mexican (12,469 | 2.4%), together accounting for 44.9% of all Area Code 731 residents.
| Ancestry | # Population | % Population |
| African | 5,304 | 1.0% |
| Albanian | 191 | 0.0% |
| Aleut | 26 | 0.0% |
| Alsatian | 6 | 0.0% |
| American | 91,279 | 17.4% |
| Apache | 43 | 0.0% |
| Arab | 724 | 0.1% |
| Argentinean | 36 | 0.0% |
| Armenian | 34 | 0.0% |
| Australian | 107 | 0.0% |
| Austrian | 433 | 0.1% |
| Barbadian | 20 | 0.0% |
| Belgian | 40 | 0.0% |
| Belizean | 29 | 0.0% |
| Bhutanese | 286 | 0.1% |
| Blackfeet | 263 | 0.1% |
| Brazilian | 26 | 0.0% |
| British | 2,164 | 0.4% |
| Burmese | 583 | 0.1% |
| Cajun | 98 | 0.0% |
| Canadian | 257 | 0.1% |
| Celtic | 49 | 0.0% |
| Central American | 1,906 | 0.4% |
| Central American Indian | 79 | 0.0% |
| Cherokee | 2,334 | 0.4% |
| Cheyenne | 12 | 0.0% |
| Chickasaw | 48 | 0.0% |
| Chilean | 1 | 0.0% |
| Chippewa | 55 | 0.0% |
| Choctaw | 209 | 0.0% |
| Colombian | 75 | 0.0% |
| Comanche | 25 | 0.0% |
| Costa Rican | 27 | 0.0% |
| Cree | 19 | 0.0% |
| Creek | 62 | 0.0% |
| Croatian | 128 | 0.0% |
| Cuban | 868 | 0.2% |
| Czech | 322 | 0.1% |
| Czechoslovakian | 67 | 0.0% |
| Danish | 303 | 0.1% |
| Delaware | 6 | 0.0% |
| Dominican | 41 | 0.0% |
| Dutch | 3,055 | 0.6% |
| Dutch West Indian | 43 | 0.0% |
| Eastern European | 371 | 0.1% |
| Ecuadorian | 25 | 0.0% |
| Egyptian | 59 | 0.0% |
| English | 49,194 | 9.4% |
| Ethiopian | 92 | 0.0% |
| European | 9,303 | 1.8% |
| Finnish | 46 | 0.0% |
| French | 6,311 | 1.2% |
| French American Indian | 7 | 0.0% |
| French Canadian | 691 | 0.1% |
| German | 33,492 | 6.4% |
| German Russian | 14 | 0.0% |
| Ghanaian | 37 | 0.0% |
| Greek | 280 | 0.1% |
| Guamanian / Chamorro | 16 | 0.0% |
| Guatemalan | 327 | 0.1% |
| Haitian | 110 | 0.0% |
| Honduran | 969 | 0.2% |
| Houma | 6 | 0.0% |
| Hungarian | 383 | 0.1% |
| Icelander | 8 | 0.0% |
| Indian (Asian) | 711 | 0.1% |
| Indonesian | 22 | 0.0% |
| Iranian | 108 | 0.0% |
| Irish | 48,734 | 9.3% |
| Iroquois | 51 | 0.0% |
| Israeli | 37 | 0.0% |
| Italian | 7,749 | 1.5% |
| Jamaican | 119 | 0.0% |
| Japanese | 20 | 0.0% |
| Korean | 820 | 0.2% |
| Laotian | 32 | 0.0% |
| Latvian | 15 | 0.0% |
| Lebanese | 157 | 0.0% |
| Lithuanian | 145 | 0.0% |
| Lumbee | 23 | 0.0% |
| Malaysian | 28 | 0.0% |
| Mexican | 12,469 | 2.4% |
| Mexican American Indian | 18 | 0.0% |
| Moroccan | 35 | 0.0% |
| Native Hawaiian | 153 | 0.0% |
| Navajo | 104 | 0.0% |
| New Zealander | 13 | 0.0% |
| Nicaraguan | 34 | 0.0% |
| Nigerian | 194 | 0.0% |
| Northern European | 267 | 0.1% |
| Norwegian | 1,618 | 0.3% |
| Osage | 6 | 0.0% |
| Ottawa | 8 | 0.0% |
| Pakistani | 256 | 0.1% |
| Palestinian | 247 | 0.1% |
| Panamanian | 181 | 0.0% |
| Pennsylvania German | 6 | 0.0% |
| Peruvian | 268 | 0.1% |
| Pima | 21 | 0.0% |
| Polish | 3,518 | 0.7% |
| Portuguese | 260 | 0.1% |
| Potawatomi | 17 | 0.0% |
| Puerto Rican | 1,312 | 0.3% |
| Romanian | 139 | 0.0% |
| Russian | 439 | 0.1% |
| Salvadoran | 347 | 0.1% |
| Samoan | 71 | 0.0% |
| Scandinavian | 866 | 0.2% |
| Scotch-Irish | 7,132 | 1.4% |
| Scottish | 8,093 | 1.5% |
| Seminole | 14 | 0.0% |
| Serbian | 10 | 0.0% |
| Sierra Leonean | 39 | 0.0% |
| Sioux | 14 | 0.0% |
| Slavic | 45 | 0.0% |
| Slovak | 70 | 0.0% |
| Slovene | 31 | 0.0% |
| Somali | 64 | 0.0% |
| South African | 107 | 0.0% |
| South American | 588 | 0.1% |
| South American Indian | 10 | 0.0% |
| Spaniard | 493 | 0.1% |
| Spanish | 395 | 0.1% |
| Spanish American | 18 | 0.0% |
| Sri Lankan | 462 | 0.1% |
| Subsaharan African | 5,831 | 1.1% |
| Swedish | 1,277 | 0.2% |
| Swiss | 355 | 0.1% |
| Syrian | 44 | 0.0% |
| Thai | 414 | 0.1% |
| Trinidadian and Tobagonian | 7 | 0.0% |
| Turkish | 12 | 0.0% |
| Ukrainian | 172 | 0.0% |
| Uruguayan | 9 | 0.0% |
| Venezuelan | 135 | 0.0% |
| Vietnamese | 19 | 0.0% |
| Welsh | 2,201 | 0.4% |
| West Indian | 10 | 0.0% |
| Yugoslavian | 38 | 0.0% | View All 139 Rows |
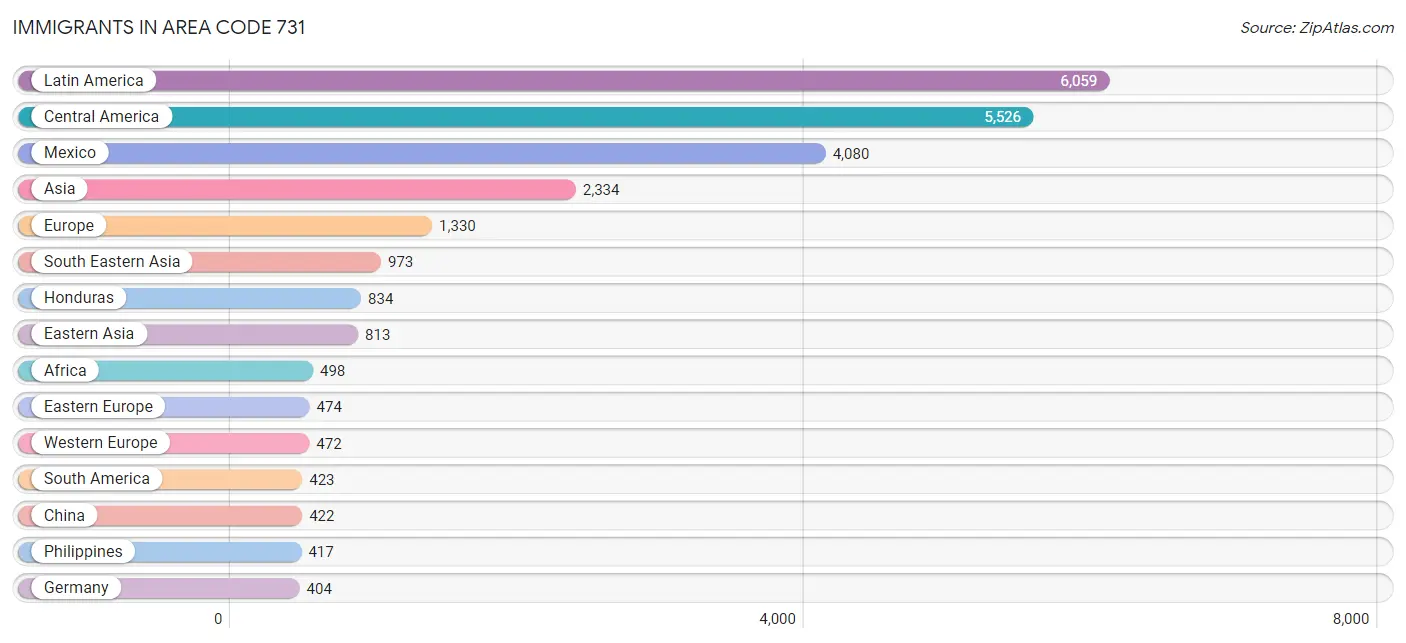
Immigrants in Area Code 731
The most numerous immigrant groups reported in Area Code 731 came from Latin America (6,059 | 1.2%), Central America (5,526 | 1.1%), Mexico (4,080 | 0.8%), Asia (2,334 | 0.4%), and Europe (1,330 | 0.3%), together accounting for 3.7% of all Area Code 731 residents.
| Immigration Origin | # Population | % Population |
| Africa | 498 | 0.1% |
| Albania | 191 | 0.0% |
| Argentina | 46 | 0.0% |
| Asia | 2,334 | 0.4% |
| Australia | 117 | 0.0% |
| Austria | 5 | 0.0% |
| Bangladesh | 19 | 0.0% |
| Belarus | 11 | 0.0% |
| Belgium | 13 | 0.0% |
| Bosnia and Herzegovina | 9 | 0.0% |
| Brazil | 24 | 0.0% |
| Cambodia | 20 | 0.0% |
| Canada | 224 | 0.0% |
| Caribbean | 110 | 0.0% |
| Central America | 5,526 | 1.1% |
| Chile | 1 | 0.0% |
| China | 422 | 0.1% |
| Colombia | 44 | 0.0% |
| Costa Rica | 62 | 0.0% |
| Croatia | 7 | 0.0% |
| Cuba | 49 | 0.0% |
| Dominican Republic | 17 | 0.0% |
| Eastern Africa | 124 | 0.0% |
| Eastern Asia | 813 | 0.2% |
| Eastern Europe | 474 | 0.1% |
| Ecuador | 16 | 0.0% |
| Egypt | 118 | 0.0% |
| El Salvador | 40 | 0.0% |
| England | 271 | 0.1% |
| Ethiopia | 84 | 0.0% |
| Europe | 1,330 | 0.3% |
| France | 44 | 0.0% |
| Germany | 404 | 0.1% |
| Ghana | 37 | 0.0% |
| Greece | 49 | 0.0% |
| Guatemala | 390 | 0.1% |
| Guyana | 4 | 0.0% |
| Haiti | 19 | 0.0% |
| Honduras | 834 | 0.2% |
| Hong Kong | 93 | 0.0% |
| Hungary | 14 | 0.0% |
| India | 312 | 0.1% |
| Indonesia | 16 | 0.0% |
| Iran | 10 | 0.0% |
| Iraq | 48 | 0.0% |
| Ireland | 6 | 0.0% |
| Israel | 6 | 0.0% |
| Italy | 10 | 0.0% |
| Japan | 112 | 0.0% |
| Jordan | 4 | 0.0% |
| Kenya | 6 | 0.0% |
| Korea | 279 | 0.1% |
| Laos | 23 | 0.0% |
| Latin America | 6,059 | 1.2% |
| Latvia | 37 | 0.0% |
| Lebanon | 13 | 0.0% |
| Lithuania | 17 | 0.0% |
| Malaysia | 42 | 0.0% |
| Mexico | 4,080 | 0.8% |
| Micronesia | 3 | 0.0% |
| Netherlands | 6 | 0.0% |
| Nicaragua | 17 | 0.0% |
| Nigeria | 54 | 0.0% |
| Northern Africa | 137 | 0.0% |
| Northern Europe | 315 | 0.1% |
| Oceania | 141 | 0.0% |
| Panama | 103 | 0.0% |
| Peru | 132 | 0.0% |
| Philippines | 417 | 0.1% |
| Poland | 28 | 0.0% |
| Portugal | 10 | 0.0% |
| Romania | 20 | 0.0% |
| Russia | 104 | 0.0% |
| South Africa | 107 | 0.0% |
| South America | 423 | 0.1% |
| South Central Asia | 341 | 0.1% |
| South Eastern Asia | 973 | 0.2% |
| Southern Europe | 69 | 0.0% |
| Sudan | 19 | 0.0% |
| Taiwan | 10 | 0.0% |
| Thailand | 152 | 0.0% |
| Trinidad and Tobago | 17 | 0.0% |
| Ukraine | 19 | 0.0% |
| Venezuela | 156 | 0.0% |
| Vietnam | 281 | 0.1% |
| Western Africa | 91 | 0.0% |
| Western Asia | 133 | 0.0% |
| Western Europe | 472 | 0.1% |
| Yemen | 62 | 0.0% |
| Zimbabwe | 31 | 0.0% | View All 90 Rows |
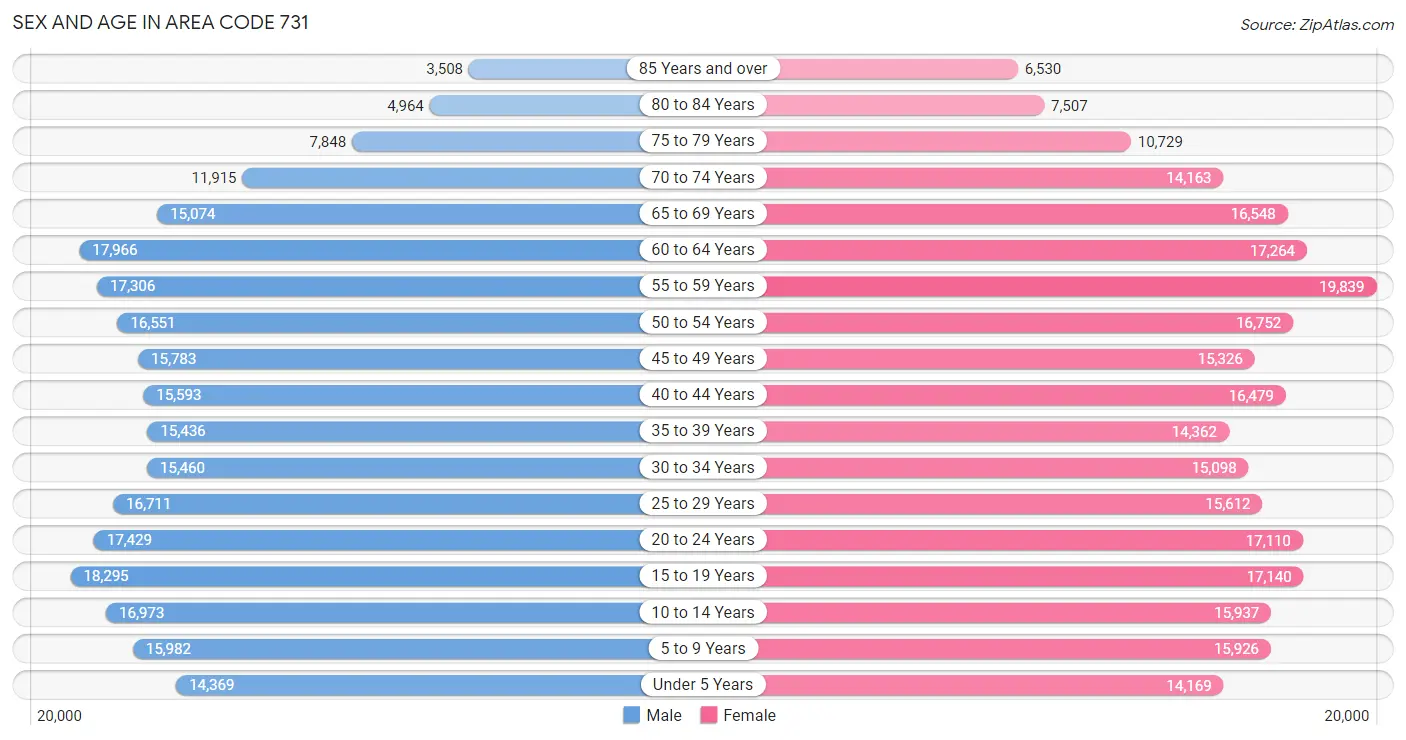
Sex and Age in Area Code 731
Sex and Age in Area Code 731
The most populous age groups in Area Code 731 are 15 to 19 Years (18,295 | 7.1%) for men and 55 to 59 Years (19,839 | 7.4%) for women.
| Age Bracket | Male | Female |
| Under 5 Years | 14,369 (5.6%) | 14,169 (5.3%) |
| 5 to 9 Years | 15,982 (6.2%) | 15,926 (6.0%) |
| 10 to 14 Years | 16,973 (6.6%) | 15,937 (6.0%) |
| 15 to 19 Years | 18,295 (7.1%) | 17,140 (6.4%) |
| 20 to 24 Years | 17,429 (6.8%) | 17,110 (6.4%) |
| 25 to 29 Years | 16,711 (6.5%) | 15,612 (5.9%) |
| 30 to 34 Years | 15,460 (6.0%) | 15,098 (5.7%) |
| 35 to 39 Years | 15,436 (6.0%) | 14,362 (5.4%) |
| 40 to 44 Years | 15,593 (6.1%) | 16,479 (6.2%) |
| 45 to 49 Years | 15,783 (6.1%) | 15,326 (5.8%) |
| 50 to 54 Years | 16,551 (6.4%) | 16,752 (6.3%) |
| 55 to 59 Years | 17,306 (6.7%) | 19,839 (7.4%) |
| 60 to 64 Years | 17,966 (7.0%) | 17,264 (6.5%) |
| 65 to 69 Years | 15,074 (5.9%) | 16,548 (6.2%) |
| 70 to 74 Years | 11,915 (4.6%) | 14,163 (5.3%) |
| 75 to 79 Years | 7,848 (3.0%) | 10,729 (4.0%) |
| 80 to 84 Years | 4,964 (1.9%) | 7,507 (2.8%) |
| 85 Years and over | 3,508 (1.4%) | 6,530 (2.5%) |
| Total | 257,163 (100.0%) | 266,491 (100.0%) |
Families and Households in Area Code 731
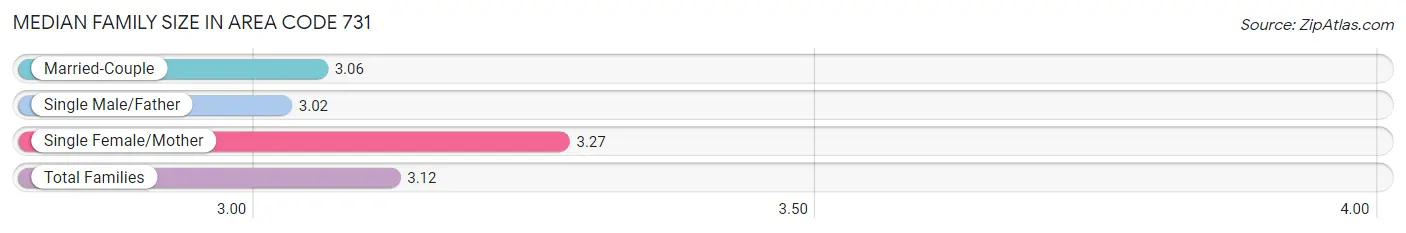
Median Family Size in Area Code 731
The median family size in Area Code 731 is 3.12 persons per family, with single female/mother families (28,229 | 21.4%) accounting for the largest median family size of 3.27114 persons per family. On the other hand, single male/father families (9,480 | 7.2%) represent the smallest median family size with 3.02 persons per family.
| Family Type | # Families | Family Size |
| Married-Couple | 94,141 (71.4%) | 3.06 |
| Single Male/Father | 9,480 (7.2%) | 3.02 |
| Single Female/Mother | 28,229 (21.4%) | 3.27 |
| Total Families | 131,850 (100.0%) | 3.12 |
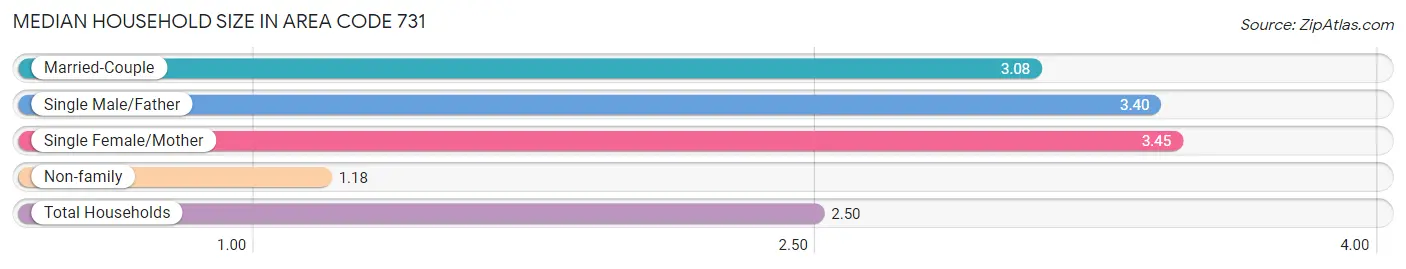
Median Household Size in Area Code 731
The median household size in Area Code 731 is 2.50 persons per household, with single female/mother households (28,229 | 13.9%) accounting for the largest median household size of 3.45458 persons per household. non-family households (72,004 | 35.3%) represent the smallest median household size with 1.18 persons per household.
| Household Type | # Households | Household Size |
| Married-Couple | 94,141 (46.2%) | 3.08 |
| Single Male/Father | 9,480 (4.6%) | 3.40 |
| Single Female/Mother | 28,229 (13.9%) | 3.45 |
| Non-family | 72,004 (35.3%) | 1.18 |
| Total Households | 203,854 (100.0%) | 2.50 |
Household Size by Marriage Status in Area Code 731
Out of a total of 203,854 households in Area Code 731, 131,850 (64.7%) are family households, while 72,004 (35.3%) are nonfamily households. The most numerous type of family households are 2-person households, comprising 63,907, and the most common type of nonfamily households are 1-person households, comprising 62,664.
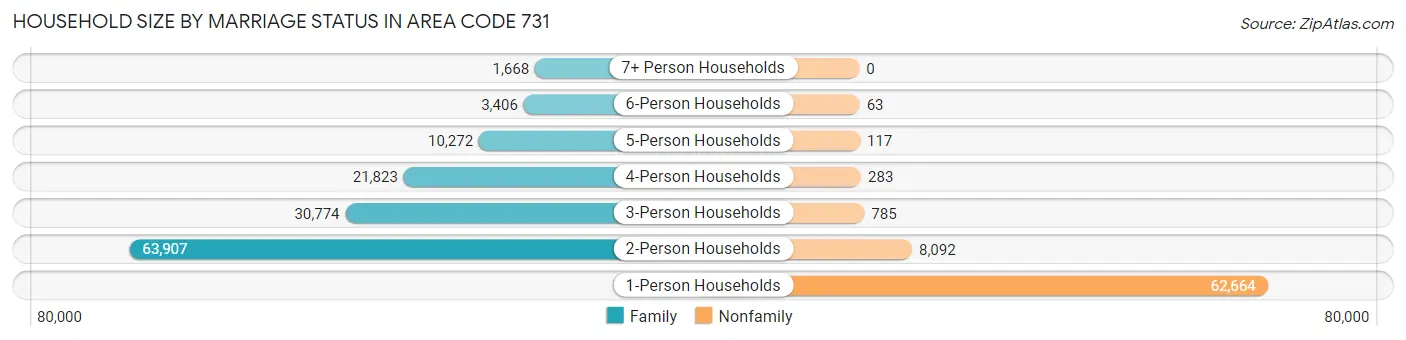
| Household Size | Family Households | Nonfamily Households |
| 1-Person Households | - | 62,664 (30.7%) |
| 2-Person Households | 63,907 (31.4%) | 8,092 (4.0%) |
| 3-Person Households | 30,774 (15.1%) | 785 (0.4%) |
| 4-Person Households | 21,823 (10.7%) | 283 (0.1%) |
| 5-Person Households | 10,272 (5.0%) | 117 (0.1%) |
| 6-Person Households | 3,406 (1.7%) | 63 (0.0%) |
| 7+ Person Households | 1,668 (0.8%) | 0 (0.0%) |
| Total | 131,850 (64.7%) | 72,004 (35.3%) |
Female Fertility in Area Code 731
Fertility by Age in Area Code 731
Average fertility rate in Area Code 731 is 76.3 births per 1,000 women. Women in the age bracket of 15 to 19 years have the highest fertility rate with 288.1 births per 1,000 women. Women in the age bracket of 20 to 34 years acount for 84.1% of all women with births.
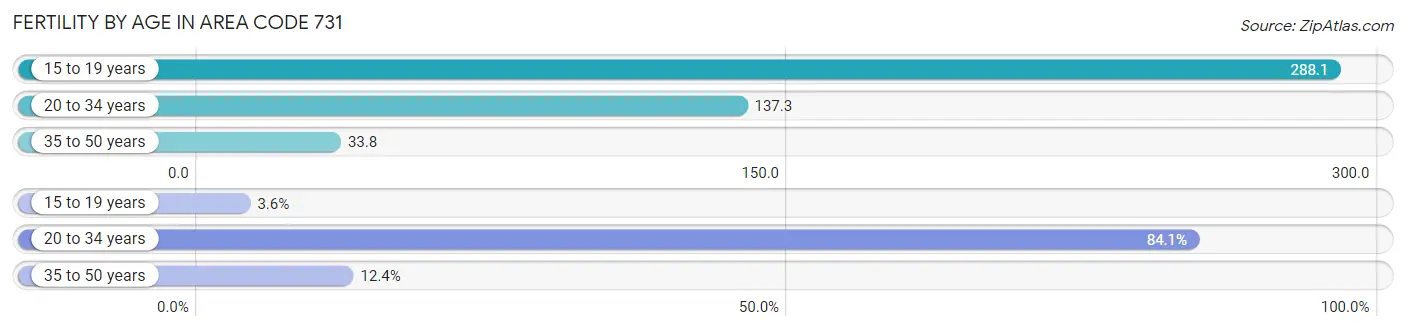
| Age Bracket | Women with Births | Births / 1,000 Women |
| 15 to 19 years | 239 (3.6%) | 288.1 |
| 20 to 34 years | 5,586 (84.1%) | 137.3 |
| 35 to 50 years | 821 (12.3%) | 33.8 |
| Total | 6,646 (100.0%) | 76.3 |
Fertility by Age by Marriage Status in Area Code 731
43.0% of women with births (6,646) in Area Code 731 are married. The highest percentage of unmarried women with births falls into 15 to 19 years age bracket with 100.0% of them unmarried at the time of birth, while the lowest percentage of unmarried women with births belong to 20 to 34 years age bracket with 60.5% of them unmarried.
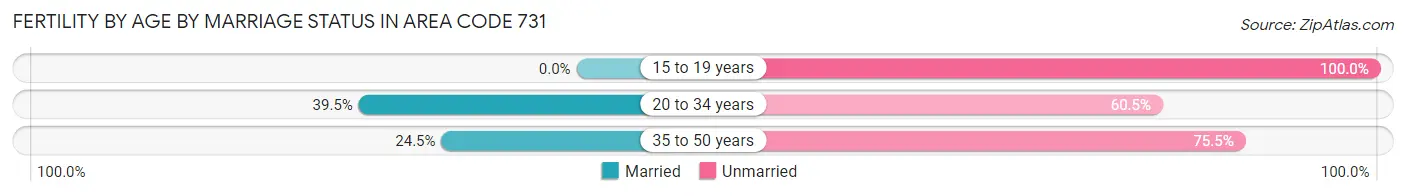
| Age Bracket | Married | Unmarried |
| 15 to 19 years | 0 (0.0%) | 239 (100.0%) |
| 20 to 34 years | 2,205 (39.5%) | 3,381 (60.5%) |
| 35 to 50 years | 201 (24.5%) | 620 (75.5%) |
| Total | 2,855 (43.0%) | 3,791 (57.0%) |
Fertility by Education in Area Code 731
Average fertility rate in Area Code 731 is 76.3 births per 1,000 women. Women with the education attainment of graduate degree have the highest fertility rate of 241.1 births per 1,000 women, while women with the education attainment of college or associate's degree have the lowest fertility at 80.7 births per 1,000 women. Women with the education attainment of college or associate's degree represent 37.8% of all women with births.
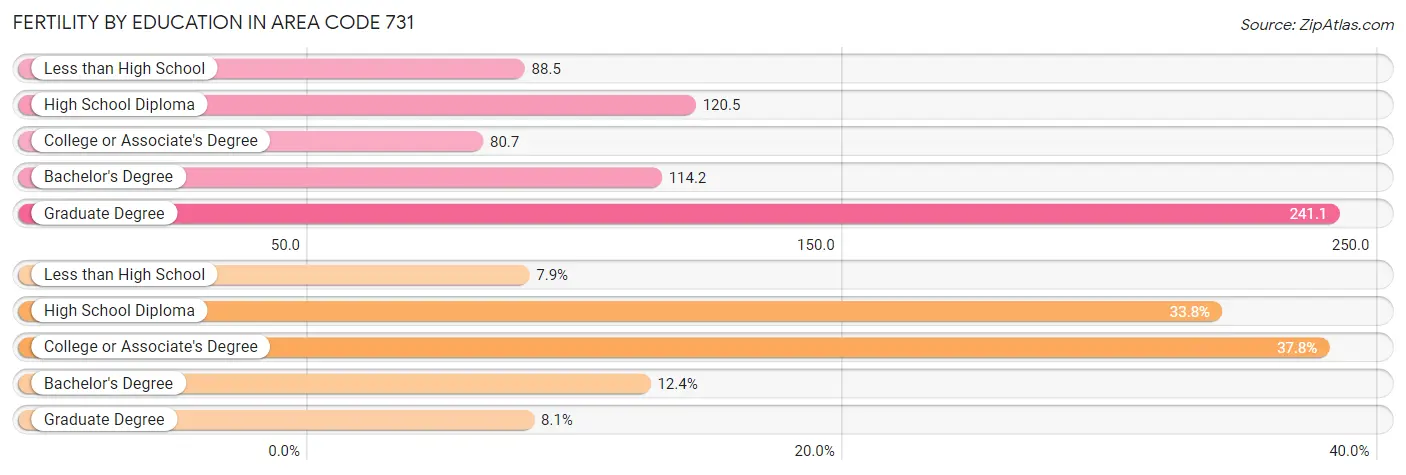
| Educational Attainment | Women with Births | Births / 1,000 Women |
| Less than High School | 523 (7.9%) | 88.5 |
| High School Diploma | 2,248 (33.8%) | 120.5 |
| College or Associate's Degree | 2,515 (37.8%) | 80.7 |
| Bachelor's Degree | 825 (12.4%) | 114.2 |
| Graduate Degree | 535 (8.1%) | 241.1 |
| Total | 6,646 (100.0%) | 76.3 |
Fertility by Education by Marriage Status in Area Code 731
57.0% of women with births in Area Code 731 are unmarried. Women with the educational attainment of graduate degree are most likely to be married with 84.5% of them married at childbirth, while women with the educational attainment of less than high school are least likely to be married with 97.1% of them unmarried at childbirth.
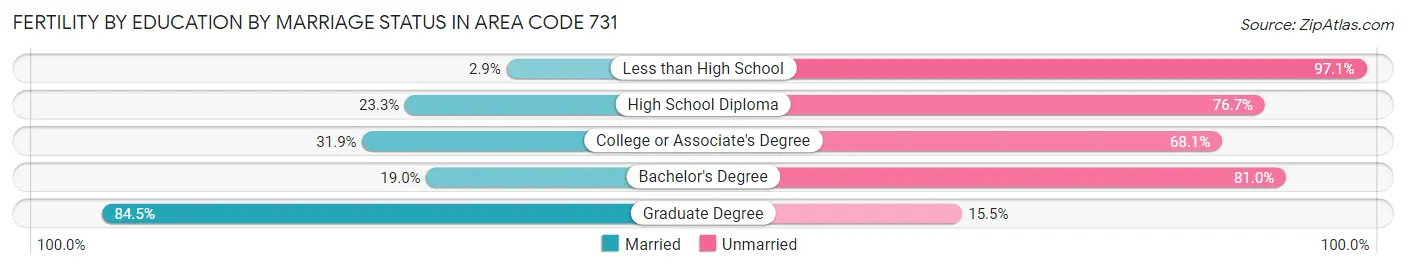
| Educational Attainment | Married | Unmarried |
| Less than High School | 15 (2.9%) | 508 (97.1%) |
| High School Diploma | 524 (23.3%) | 1,724 (76.7%) |
| College or Associate's Degree | 803 (31.9%) | 1,712 (68.1%) |
| Bachelor's Degree | 157 (19.0%) | 668 (81.0%) |
| Graduate Degree | 452 (84.5%) | 83 (15.5%) |
| Total | 2,855 (43.0%) | 3,791 (57.0%) |
Employment Characteristics in Area Code 731
Employment by Class of Employer in Area Code 731
Among the 213,977 employed individuals in Area Code 731, private company employees (145,648 | 68.1%), local government employees (18,165 | 8.5%), and self-employed (not incorporated) (14,678 | 6.9%) make up the most common classes of employment.
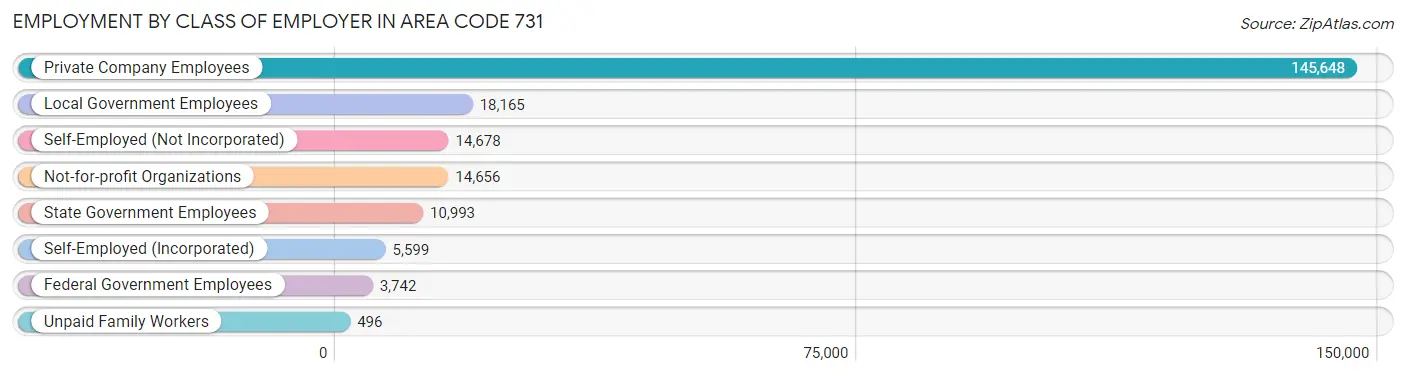
| Employer Class | # Employees | % Employees |
| Private Company Employees | 145,648 | 68.1% |
| Self-Employed (Incorporated) | 5,599 | 2.6% |
| Self-Employed (Not Incorporated) | 14,678 | 6.9% |
| Not-for-profit Organizations | 14,656 | 6.9% |
| Local Government Employees | 18,165 | 8.5% |
| State Government Employees | 10,993 | 5.1% |
| Federal Government Employees | 3,742 | 1.8% |
| Unpaid Family Workers | 496 | 0.2% |
| Total | 213,977 | 100.0% |
Employment Status by Age in Area Code 731
According to the labor force statistics for Area Code 731, out of the total population over 16 years of age (423,254), 53.9% or 228,176 individuals are in the labor force, with 6.5% or 14,763 of them unemployed. The age group with the highest labor force participation rate is 35 to 44 years, with 78.8% or 48,772 individuals in the labor force. Within the labor force, the 16 to 19 years age range has the highest percentage of unemployed individuals, with 1,781.4% or 231,333 of them being unemployed.
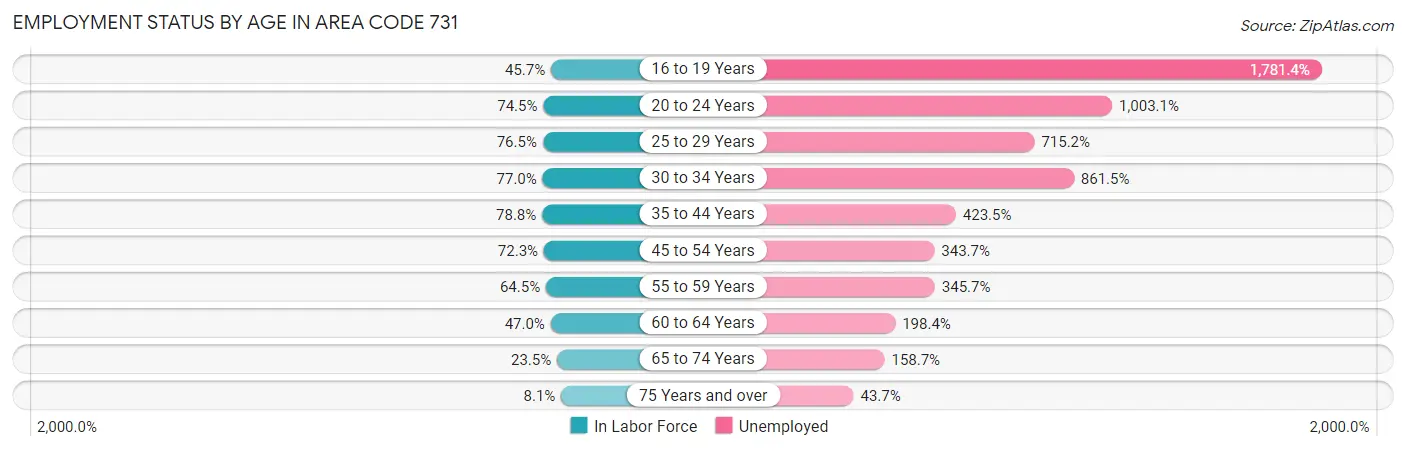
| Age Bracket | In Labor Force | Unemployed |
| 16 to 19 Years | 12,987 (45.7%) | 231,333 (1,781.4%) |
| 20 to 24 Years | 25,726 (74.5%) | 258,078 (1,003.1%) |
| 25 to 29 Years | 24,731 (76.5%) | 176,869 (715.2%) |
| 30 to 34 Years | 23,535 (77.0%) | 202,763 (861.5%) |
| 35 to 44 Years | 48,769 (78.8%) | 206,549 (423.5%) |
| 45 to 54 Years | 46,535 (72.3%) | 159,951 (343.7%) |
| 55 to 59 Years | 23,970 (64.5%) | 82,864 (345.7%) |
| 60 to 64 Years | 16,567 (47.0%) | 32,865 (198.4%) |
| 65 to 74 Years | 13,552 (23.5%) | 21,510 (158.7%) |
| 75 Years and over | 3,318 (8.1%) | 1,449 (43.7%) |
| Total | 228,162 (53.9%) | 14,766 (6.5%) |
Employment Status by Educational Attainment in Area Code 731
According to labor force statistics for Area Code 731, 68.8% of individuals (179,938) out of the total population between 25 and 64 years of age (261,538) are in the labor force, with 485.6% or 873,779 of them being unemployed. The group with the highest labor force participation rate are those with the educational attainment of bachelor's degree or higher, with 83.1% or 40,708 individuals in the labor force. Within the labor force, individuals with less than high school education have the highest percentage of unemployment, with 854.2% or 124,286 of them being unemployed.
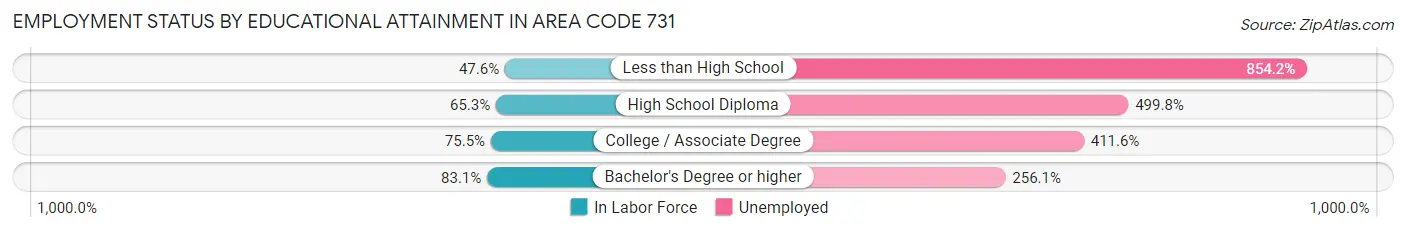
| Educational Attainment | In Labor Force | Unemployed |
| Less than High School | 14,551 (47.6%) | 261,214 (854.2%) |
| High School Diploma | 70,518 (65.3%) | 539,739 (499.8%) |
| College / Associate Degree | 55,799 (75.4%) | 304,407 (411.6%) |
| Bachelor's Degree or higher | 40,708 (83.1%) | 125,515 (256.1%) |
| Total | 179,951 (68.8%) | 1,270,029 (485.6%) |
Employment Occupations by Sex in Area Code 731
Management, Business, Science and Arts Occupations
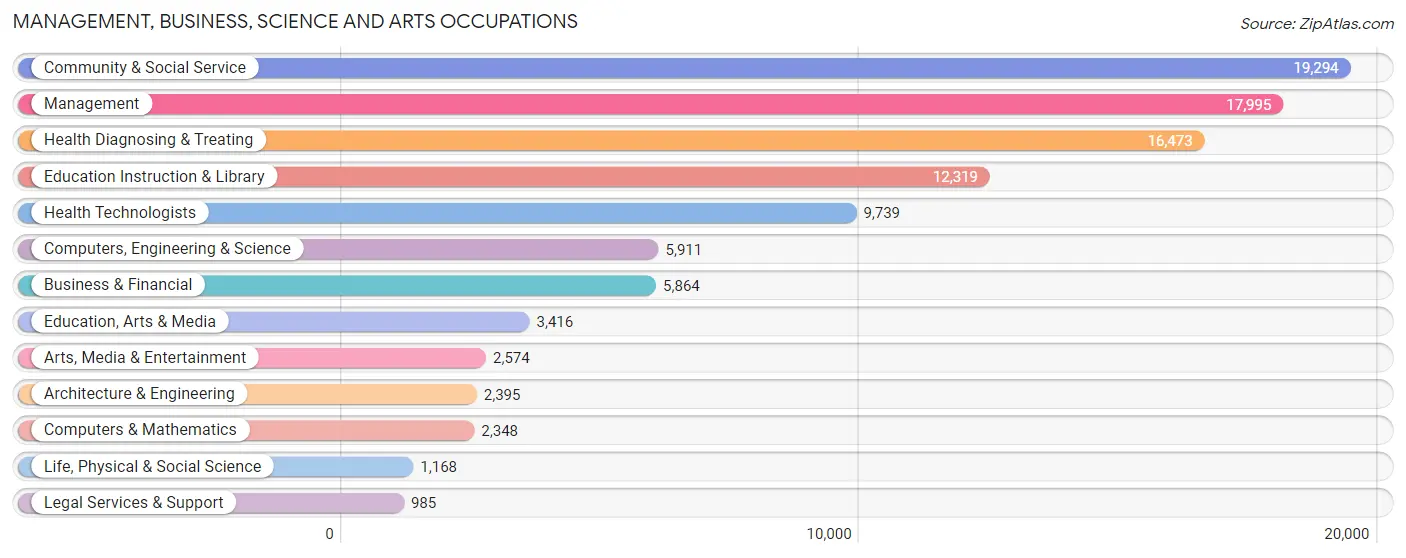
The most common Management, Business, Science and Arts occupations in Area Code 731 are Community & Social Service (19,294 | 8.9%), Management (17,995 | 8.3%), Health Diagnosing & Treating (16,473 | 7.6%), Education Instruction & Library (12,319 | 5.7%), and Health Technologists (9,739 | 4.5%).
Management, Business, Science and Arts Occupations by Sex
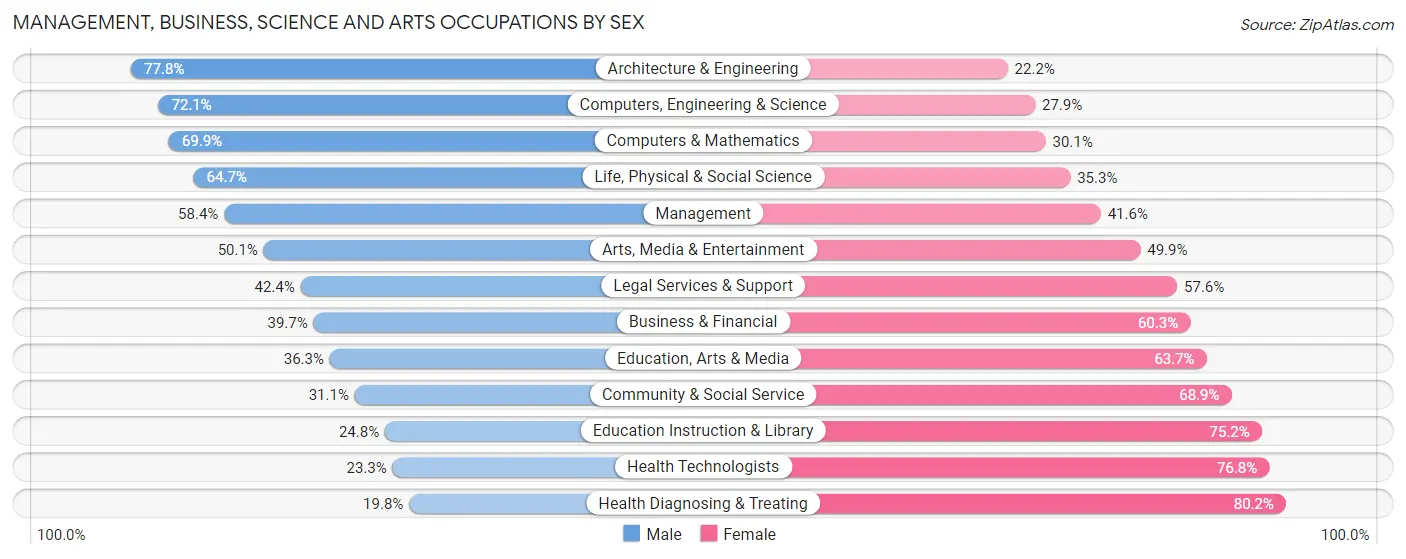
Within the Management, Business, Science and Arts occupations in Area Code 731, the most male-oriented occupations are Architecture & Engineering (77.8%), Computers, Engineering & Science (72.1%), and Computers & Mathematics (69.9%), while the most female-oriented occupations are Health Diagnosing & Treating (80.2%), Health Technologists (76.7%), and Education Instruction & Library (75.2%).
| Occupation | Male | Female |
| Management | 10,504 (58.4%) | 7,491 (41.6%) |
| Business & Financial | 2,330 (39.7%) | 3,534 (60.3%) |
| Computers, Engineering & Science | 4,260 (72.1%) | 1,651 (27.9%) |
| Computers & Mathematics | 1,641 (69.9%) | 707 (30.1%) |
| Architecture & Engineering | 1,863 (77.8%) | 532 (22.2%) |
| Life, Physical & Social Science | 756 (64.7%) | 412 (35.3%) |
| Community & Social Service | 6,006 (31.1%) | 13,288 (68.9%) |
| Education, Arts & Media | 1,241 (36.3%) | 2,175 (63.7%) |
| Legal Services & Support | 418 (42.4%) | 567 (57.6%) |
| Education Instruction & Library | 3,057 (24.8%) | 9,262 (75.2%) |
| Arts, Media & Entertainment | 1,290 (50.1%) | 1,284 (49.9%) |
| Health Diagnosing & Treating | 3,259 (19.8%) | 13,214 (80.2%) |
| Health Technologists | 2,264 (23.3%) | 7,475 (76.7%) |
| Total (Category) | 26,359 (40.2%) | 39,178 (59.8%) |
| Total (Overall) | 112,734 (51.8%) | 104,957 (48.2%) |
Services Occupations
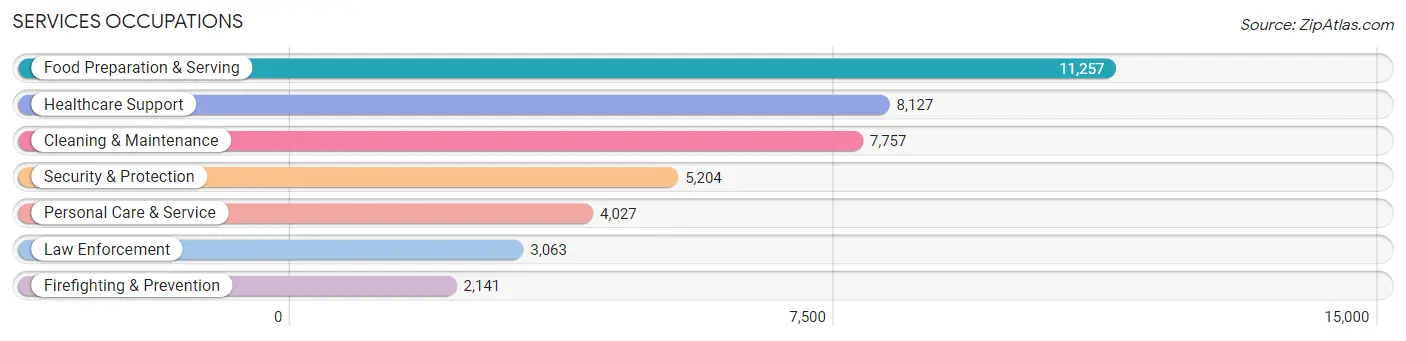
The most common Services occupations in Area Code 731 are Food Preparation & Serving (11,257 | 5.2%), Healthcare Support (8,127 | 3.7%), Cleaning & Maintenance (7,757 | 3.6%), Security & Protection (5,204 | 2.4%), and Personal Care & Service (4,027 | 1.8%).
Services Occupations by Sex
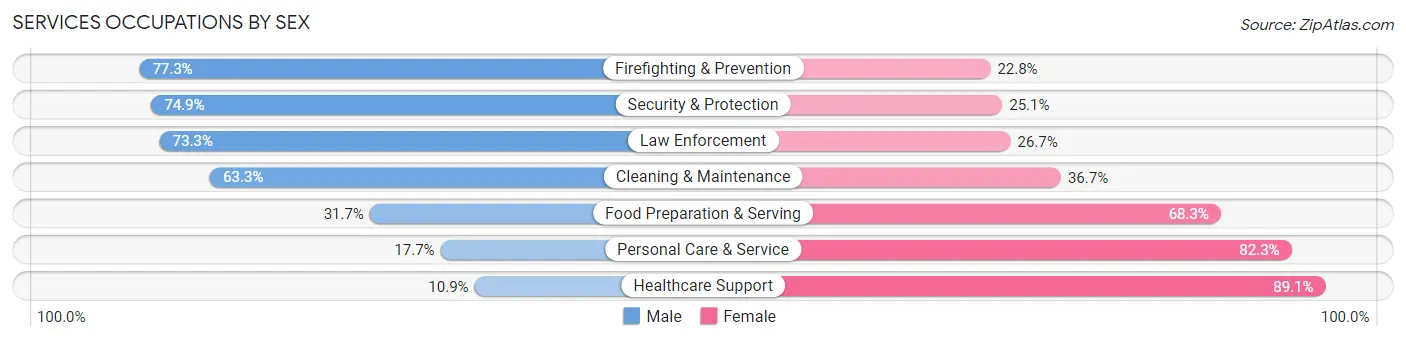
Within the Services occupations in Area Code 731, the most male-oriented occupations are Firefighting & Prevention (77.2%), Security & Protection (74.9%), and Law Enforcement (73.3%), while the most female-oriented occupations are Healthcare Support (89.1%), Personal Care & Service (82.3%), and Food Preparation & Serving (68.3%).
| Occupation | Male | Female |
| Healthcare Support | 888 (10.9%) | 7,239 (89.1%) |
| Security & Protection | 3,898 (74.9%) | 1,306 (25.1%) |
| Firefighting & Prevention | 1,654 (77.2%) | 487 (22.8%) |
| Law Enforcement | 2,244 (73.3%) | 819 (26.7%) |
| Food Preparation & Serving | 3,564 (31.7%) | 7,693 (68.3%) |
| Cleaning & Maintenance | 4,909 (63.3%) | 2,848 (36.7%) |
| Personal Care & Service | 711 (17.7%) | 3,316 (82.3%) |
| Total (Category) | 13,970 (38.4%) | 22,402 (61.6%) |
| Total (Overall) | 112,734 (51.8%) | 104,957 (48.2%) |
Sales and Office Occupations
The most common Sales and Office occupations in Area Code 731 are Office & Administration (22,287 | 10.2%), and Sales & Related (20,814 | 9.6%).
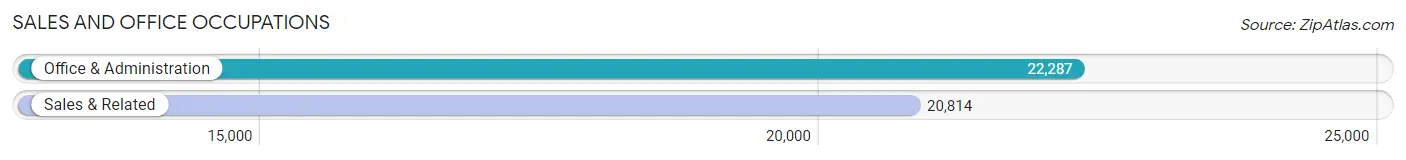
Sales and Office Occupations by Sex
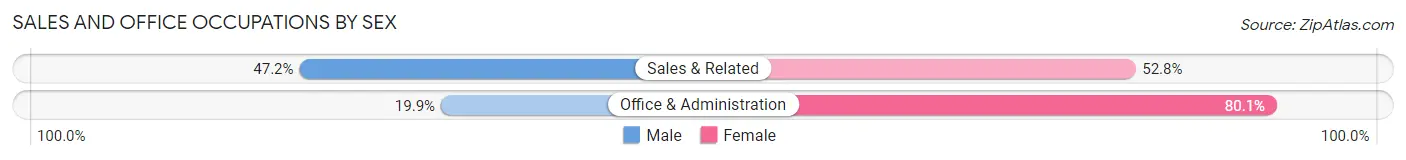
| Occupation | Male | Female |
| Sales & Related | 9,815 (47.2%) | 10,999 (52.8%) |
| Office & Administration | 4,445 (19.9%) | 17,842 (80.1%) |
| Total (Category) | 14,260 (33.1%) | 28,841 (66.9%) |
| Total (Overall) | 112,734 (51.8%) | 104,957 (48.2%) |
Natural Resources, Construction and Maintenance Occupations
The most common Natural Resources, Construction and Maintenance occupations in Area Code 731 are Construction & Extraction (11,002 | 5.1%), Installation, Maintenance & Repair (9,002 | 4.1%), and Farming, Fishing & Forestry (1,805 | 0.8%).
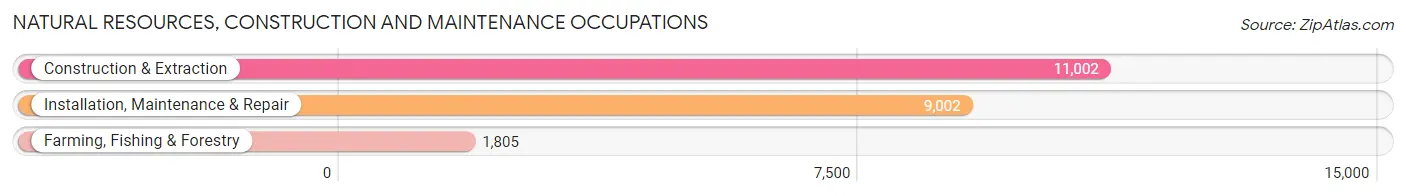
Natural Resources, Construction and Maintenance Occupations by Sex
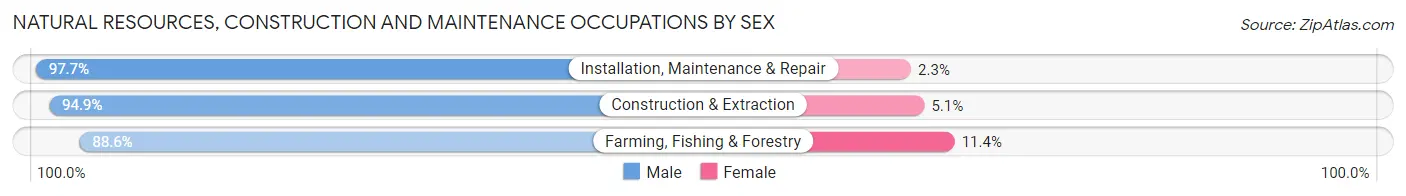
| Occupation | Male | Female |
| Farming, Fishing & Forestry | 1,599 (88.6%) | 206 (11.4%) |
| Construction & Extraction | 10,441 (94.9%) | 561 (5.1%) |
| Installation, Maintenance & Repair | 8,791 (97.7%) | 211 (2.3%) |
| Total (Category) | 20,831 (95.5%) | 978 (4.5%) |
| Total (Overall) | 112,734 (51.8%) | 104,957 (48.2%) |
Production, Transportation and Moving Occupations
The most common Production, Transportation and Moving occupations in Area Code 731 are Production (27,015 | 12.4%), Material Moving (14,042 | 6.5%), and Transportation (9,815 | 4.5%).
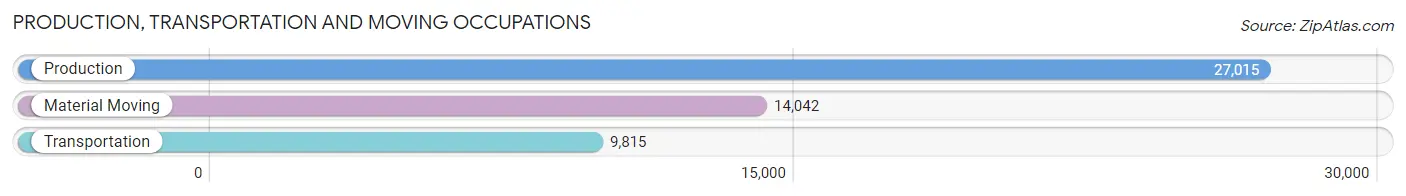
Production, Transportation and Moving Occupations by Sex
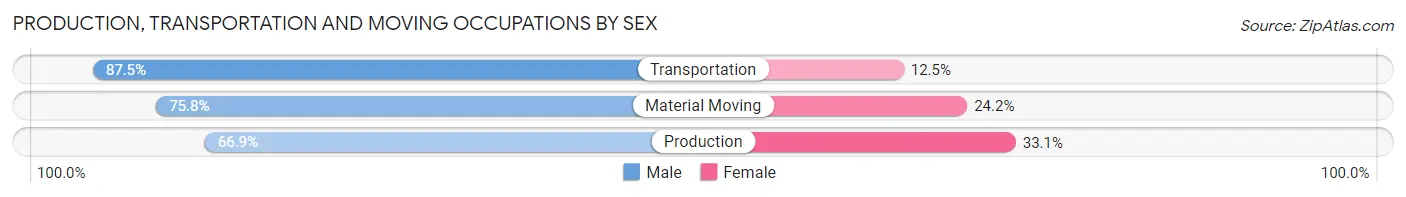
| Occupation | Male | Female |
| Production | 18,078 (66.9%) | 8,937 (33.1%) |
| Transportation | 8,586 (87.5%) | 1,229 (12.5%) |
| Material Moving | 10,650 (75.8%) | 3,392 (24.2%) |
| Total (Category) | 37,314 (73.4%) | 13,558 (26.7%) |
| Total (Overall) | 112,734 (51.8%) | 104,957 (48.2%) |
Employment Industries by Sex in Area Code 731
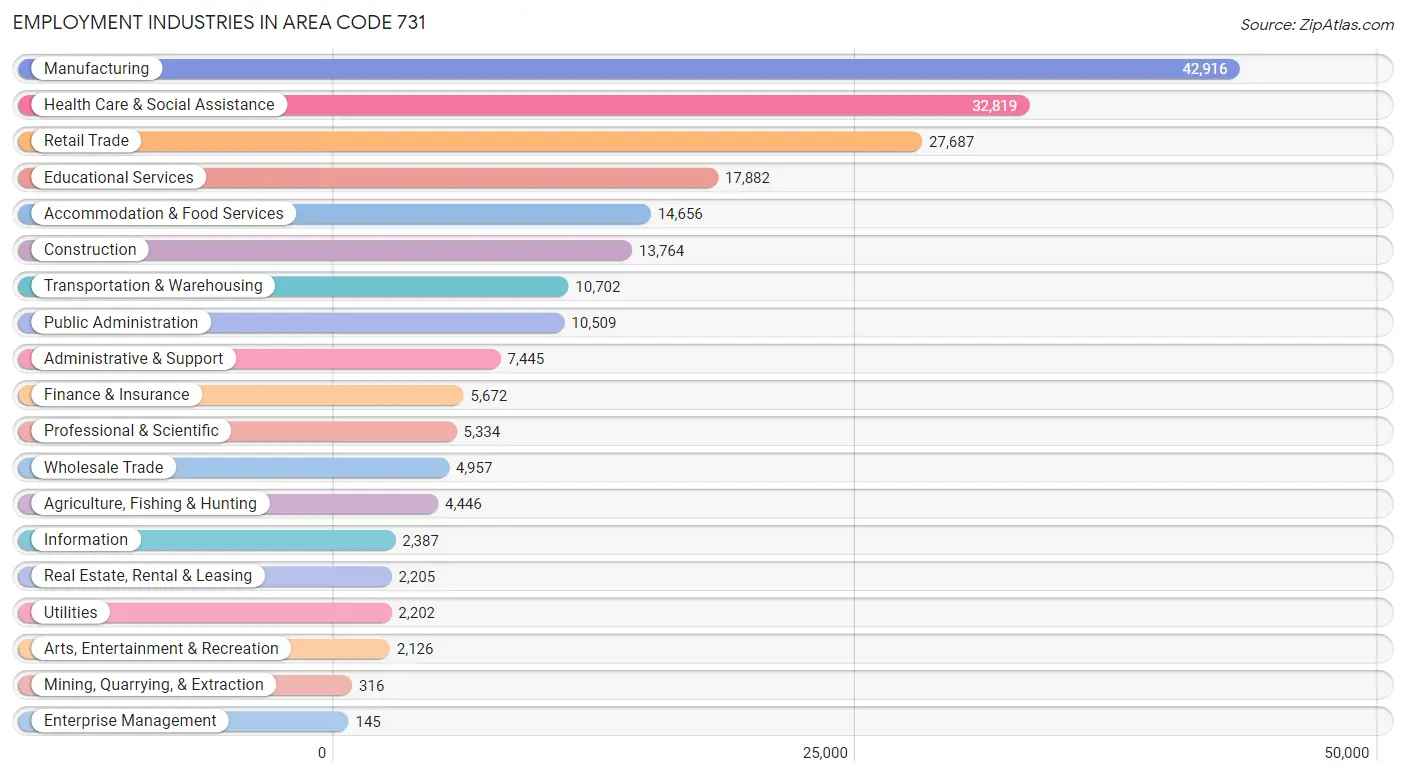
Employment Industries in Area Code 731
The major employment industries in Area Code 731 include Manufacturing (42,916 | 19.7%), Health Care & Social Assistance (32,819 | 15.1%), Retail Trade (27,687 | 12.7%), Educational Services (17,882 | 8.2%), and Accommodation & Food Services (14,656 | 6.7%).
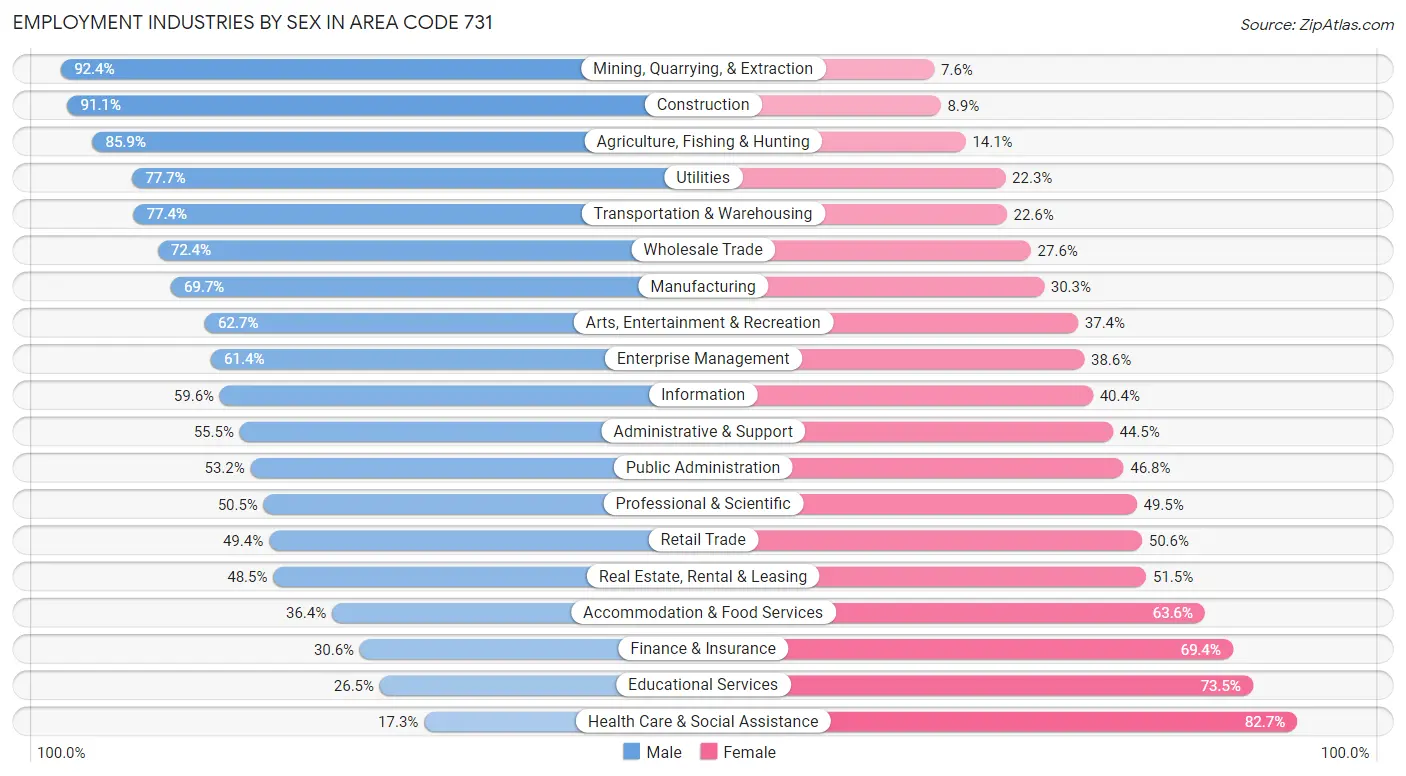
Employment Industries by Sex in Area Code 731
The Area Code 731 industries that see more men than women are Mining, Quarrying, & Extraction (92.4%), Construction (91.1%), and Agriculture, Fishing & Hunting (85.9%), whereas the industries that tend to have a higher number of women are Health Care & Social Assistance (82.7%), Educational Services (73.5%), and Finance & Insurance (69.4%).
| Industry | Male | Female |
| Agriculture, Fishing & Hunting | 3,820 (85.9%) | 626 (14.1%) |
| Mining, Quarrying, & Extraction | 292 (92.4%) | 24 (7.6%) |
| Construction | 12,538 (91.1%) | 1,226 (8.9%) |
| Manufacturing | 29,914 (69.7%) | 13,002 (30.3%) |
| Wholesale Trade | 3,590 (72.4%) | 1,367 (27.6%) |
| Retail Trade | 13,681 (49.4%) | 14,006 (50.6%) |
| Transportation & Warehousing | 8,286 (77.4%) | 2,416 (22.6%) |
| Utilities | 1,711 (77.7%) | 491 (22.3%) |
| Information | 1,422 (59.6%) | 965 (40.4%) |
| Finance & Insurance | 1,735 (30.6%) | 3,937 (69.4%) |
| Real Estate, Rental & Leasing | 1,070 (48.5%) | 1,135 (51.5%) |
| Professional & Scientific | 2,694 (50.5%) | 2,640 (49.5%) |
| Enterprise Management | 89 (61.4%) | 56 (38.6%) |
| Administrative & Support | 4,130 (55.5%) | 3,315 (44.5%) |
| Educational Services | 4,733 (26.5%) | 13,149 (73.5%) |
| Health Care & Social Assistance | 5,677 (17.3%) | 27,142 (82.7%) |
| Arts, Entertainment & Recreation | 1,332 (62.6%) | 794 (37.3%) |
| Accommodation & Food Services | 5,331 (36.4%) | 9,325 (63.6%) |
| Public Administration | 5,595 (53.2%) | 4,914 (46.8%) |
| Total | 112,734 (51.8%) | 104,957 (48.2%) |
Education in Area Code 731
School Enrollment in Area Code 731
The most common levels of schooling among the 116,411 students in Area Code 731 are high school (26,871 | 23.1%), middle school (25,393 | 21.8%), and elementary school (24,685 | 21.2%).
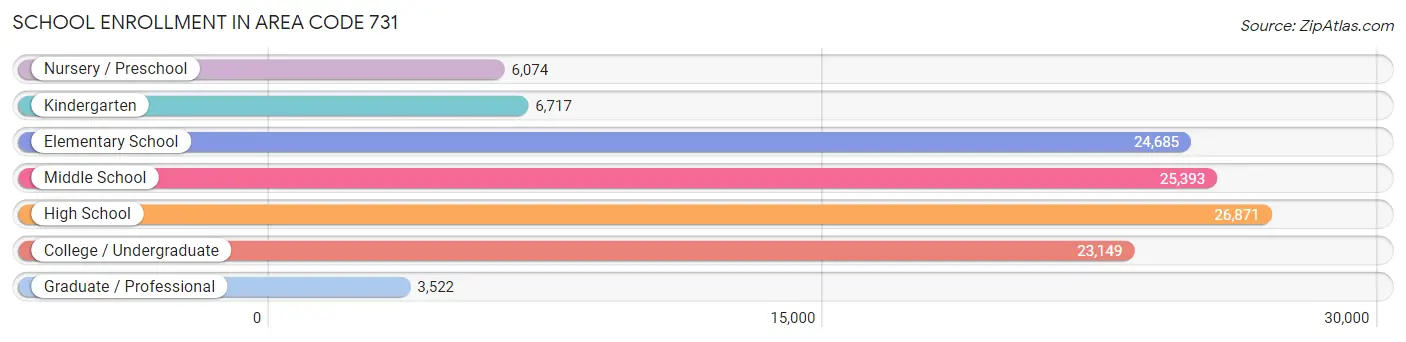
| School Level | # Students | % Students |
| Nursery / Preschool | 6,074 | 5.2% |
| Kindergarten | 6,717 | 5.8% |
| Elementary School | 24,685 | 21.2% |
| Middle School | 25,393 | 21.8% |
| High School | 26,871 | 23.1% |
| College / Undergraduate | 23,149 | 19.9% |
| Graduate / Professional | 3,522 | 3.0% |
| Total | 116,411 | 100.0% |
School Enrollment by Age by Funding Source in Area Code 731
Out of a total of 116,411 students who are enrolled in schools in Area Code 731, 20,177 (17.3%) attend a private institution, while the remaining 96,234 (82.7%) are enrolled in public schools. The age group of 20 to 24 year olds has the highest likelihood of being enrolled in private schools, with 3,825 (35.5% in the age bracket) enrolled. Conversely, the age group of 10 to 14 year olds has the lowest likelihood of being enrolled in a private school, with 28,845 (90.3% in the age bracket) attending a public institution.
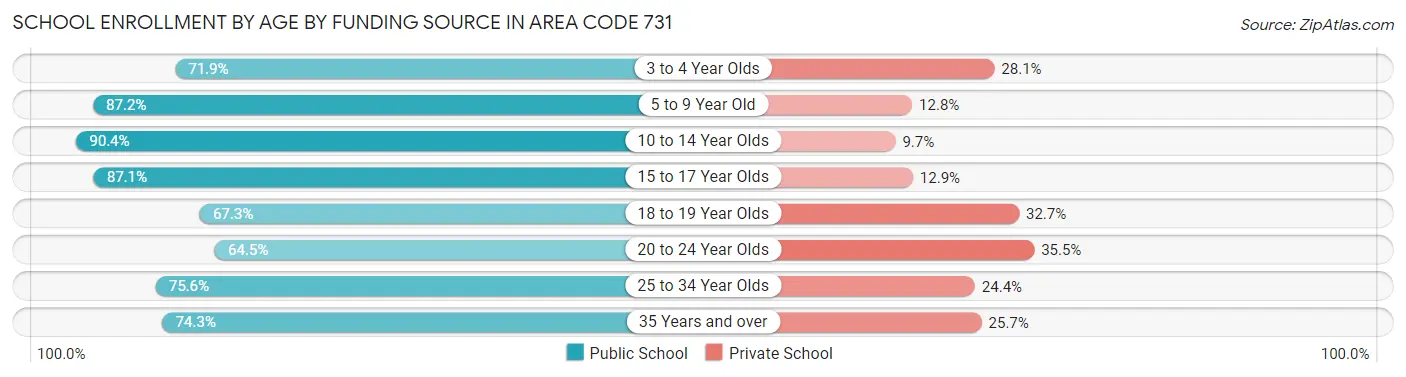
| Age Bracket | Public School | Private School |
| 3 to 4 Year Olds | 2,881 (71.9%) | 1,125 (28.1%) |
| 5 to 9 Year Old | 25,815 (87.2%) | 3,775 (12.8%) |
| 10 to 14 Year Olds | 28,845 (90.3%) | 3,080 (9.7%) |
| 15 to 17 Year Olds | 17,491 (87.1%) | 2,590 (12.9%) |
| 18 to 19 Year Olds | 6,686 (67.3%) | 3,244 (32.7%) |
| 20 to 24 Year Olds | 6,952 (64.5%) | 3,825 (35.5%) |
| 25 to 34 Year Olds | 3,957 (75.6%) | 1,280 (24.4%) |
| 35 Years and over | 3,615 (74.3%) | 1,250 (25.7%) |
| Total | 96,234 (82.7%) | 20,177 (17.3%) |
Educational Attainment by Field of Study in Area Code 731
Business (14,871 | 21.8%), education (13,390 | 19.7%), science & technology (8,306 | 12.2%), bio, nature & agricultural (5,515 | 8.1%), and arts & humanities (5,189 | 7.6%) are the most common fields of study among 68,072 individuals in Area Code 731 who have obtained a bachelor's degree or higher.
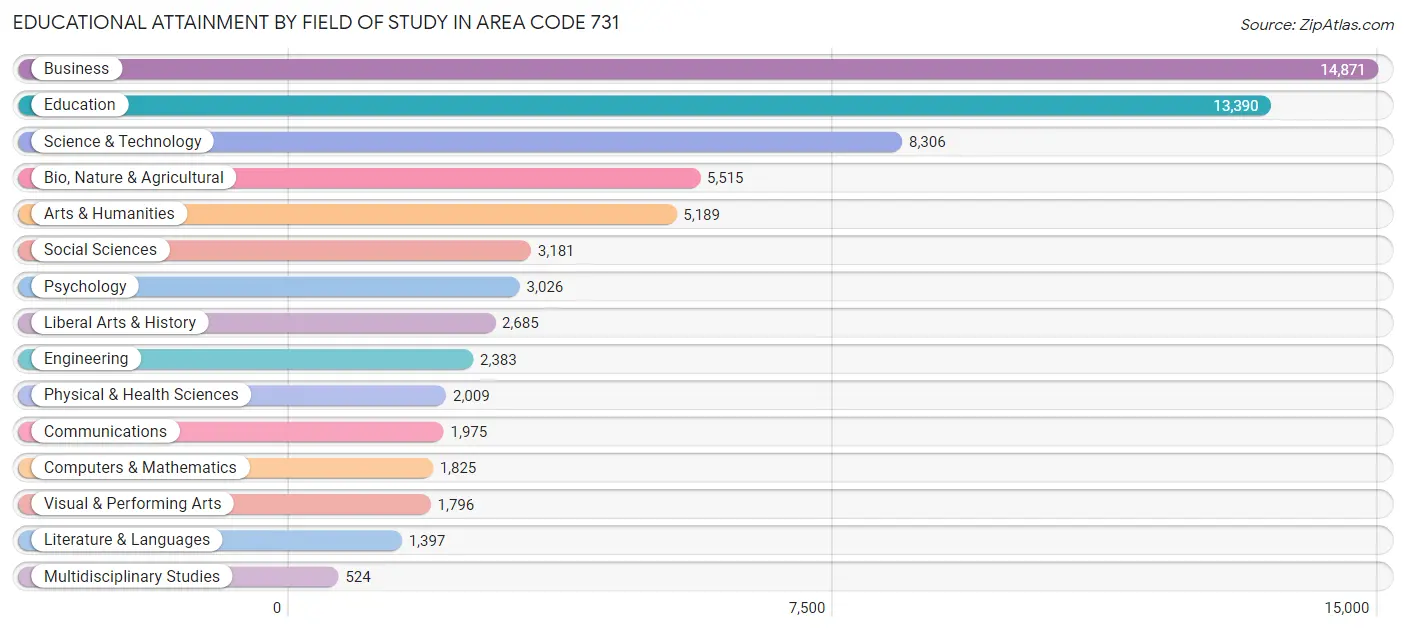
| Field of Study | # Graduates | % Graduates |
| Computers & Mathematics | 1,825 | 2.7% |
| Bio, Nature & Agricultural | 5,515 | 8.1% |
| Physical & Health Sciences | 2,009 | 2.9% |
| Psychology | 3,026 | 4.4% |
| Social Sciences | 3,181 | 4.7% |
| Engineering | 2,383 | 3.5% |
| Multidisciplinary Studies | 524 | 0.8% |
| Science & Technology | 8,306 | 12.2% |
| Business | 14,871 | 21.8% |
| Education | 13,390 | 19.7% |
| Literature & Languages | 1,397 | 2.1% |
| Liberal Arts & History | 2,685 | 3.9% |
| Visual & Performing Arts | 1,796 | 2.6% |
| Communications | 1,975 | 2.9% |
| Arts & Humanities | 5,189 | 7.6% |
| Total | 68,072 | 100.0% |
Transportation & Commute in Area Code 731
Vehicle Availability by Sex in Area Code 731
The most prevalent vehicle ownership categories in Area Code 731 are males with 2 vehicles (43,777, accounting for 39.7%) and females with 2 vehicles (37,944, making up 42.9%).
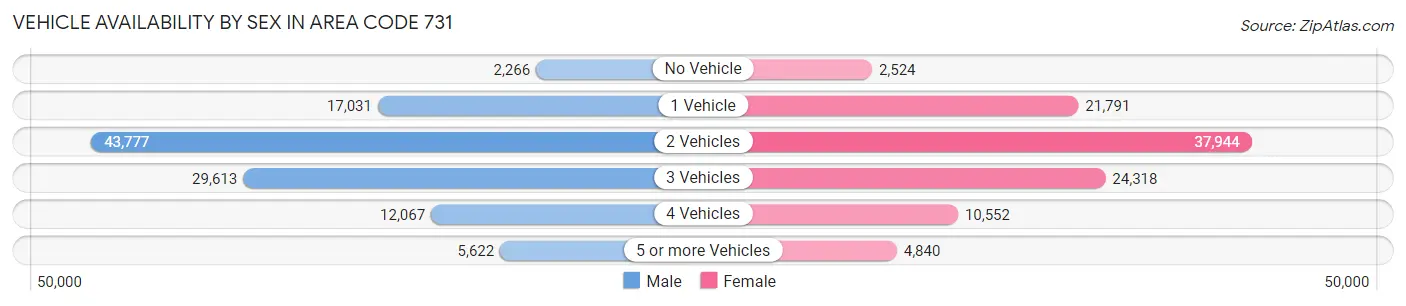
| Vehicles Available | Male | Female |
| No Vehicle | 2,266 (2.1%) | 2,524 (2.5%) |
| 1 Vehicle | 17,031 (15.4%) | 21,791 (21.4%) |
| 2 Vehicles | 43,777 (39.7%) | 37,944 (37.2%) |
| 3 Vehicles | 29,613 (26.8%) | 24,318 (23.8%) |
| 4 Vehicles | 12,067 (10.9%) | 10,552 (10.3%) |
| 5 or more Vehicles | 5,622 (5.1%) | 4,840 (4.8%) |
| Total | 110,376 (100.0%) | 101,969 (100.0%) |
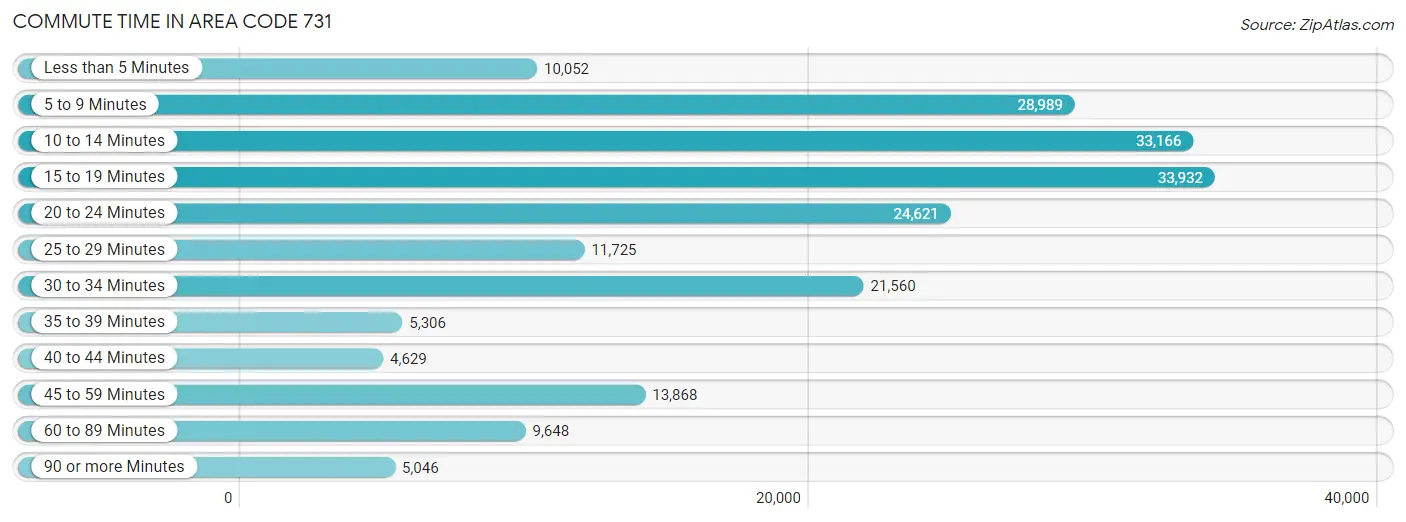
Commute Time in Area Code 731
The most frequently occuring commute durations in Area Code 731 are 15 to 19 minutes (33,932 commuters, 16.8%), 10 to 14 minutes (33,166 commuters, 16.4%), and 5 to 9 minutes (28,989 commuters, 14.3%).
| Commute Time | # Commuters | % Commuters |
| Less than 5 Minutes | 10,052 | 5.0% |
| 5 to 9 Minutes | 28,989 | 14.3% |
| 10 to 14 Minutes | 33,166 | 16.4% |
| 15 to 19 Minutes | 33,932 | 16.8% |
| 20 to 24 Minutes | 24,621 | 12.2% |
| 25 to 29 Minutes | 11,725 | 5.8% |
| 30 to 34 Minutes | 21,560 | 10.6% |
| 35 to 39 Minutes | 5,306 | 2.6% |
| 40 to 44 Minutes | 4,629 | 2.3% |
| 45 to 59 Minutes | 13,868 | 6.9% |
| 60 to 89 Minutes | 9,648 | 4.8% |
| 90 or more Minutes | 5,046 | 2.5% |
Commute Time by Sex in Area Code 731
The most common commute times in Area Code 731 are 15 to 19 minutes (16,056 commuters, 15.2%) for males and 15 to 19 minutes (17,876 commuters, 18.4%) for females.
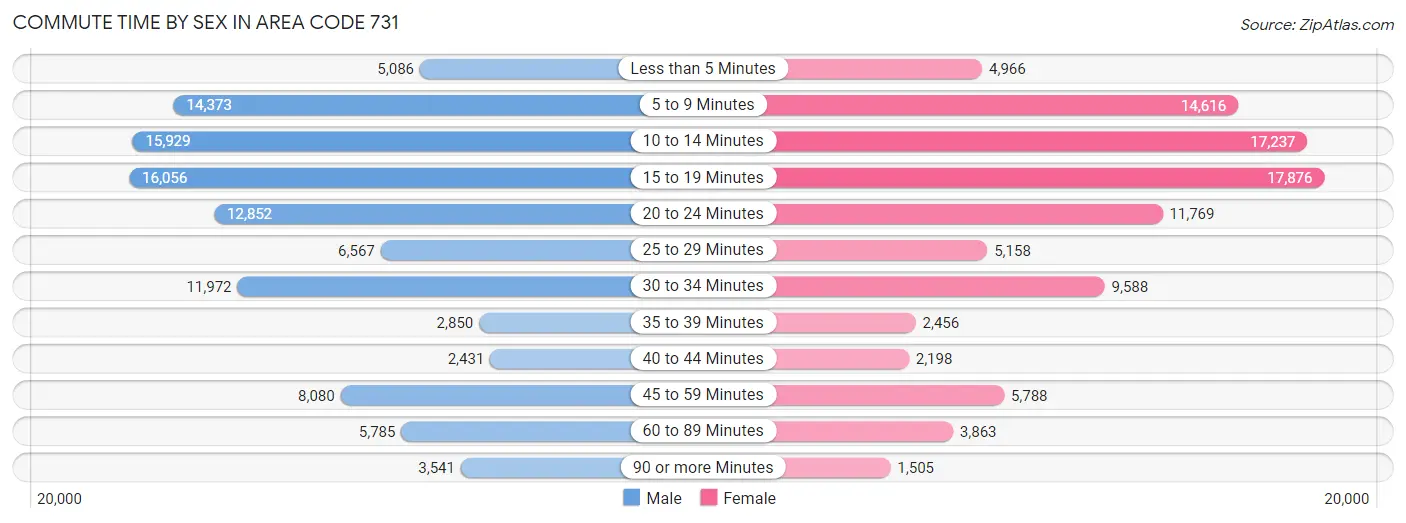
| Commute Time | Male | Female |
| Less than 5 Minutes | 5,086 (4.8%) | 4,966 (5.1%) |
| 5 to 9 Minutes | 14,373 (13.6%) | 14,616 (15.1%) |
| 10 to 14 Minutes | 15,929 (15.1%) | 17,237 (17.8%) |
| 15 to 19 Minutes | 16,056 (15.2%) | 17,876 (18.4%) |
| 20 to 24 Minutes | 12,852 (12.2%) | 11,769 (12.1%) |
| 25 to 29 Minutes | 6,567 (6.2%) | 5,158 (5.3%) |
| 30 to 34 Minutes | 11,972 (11.4%) | 9,588 (9.9%) |
| 35 to 39 Minutes | 2,850 (2.7%) | 2,456 (2.5%) |
| 40 to 44 Minutes | 2,431 (2.3%) | 2,198 (2.3%) |
| 45 to 59 Minutes | 8,080 (7.7%) | 5,788 (6.0%) |
| 60 to 89 Minutes | 5,785 (5.5%) | 3,863 (4.0%) |
| 90 or more Minutes | 3,541 (3.4%) | 1,505 (1.5%) |
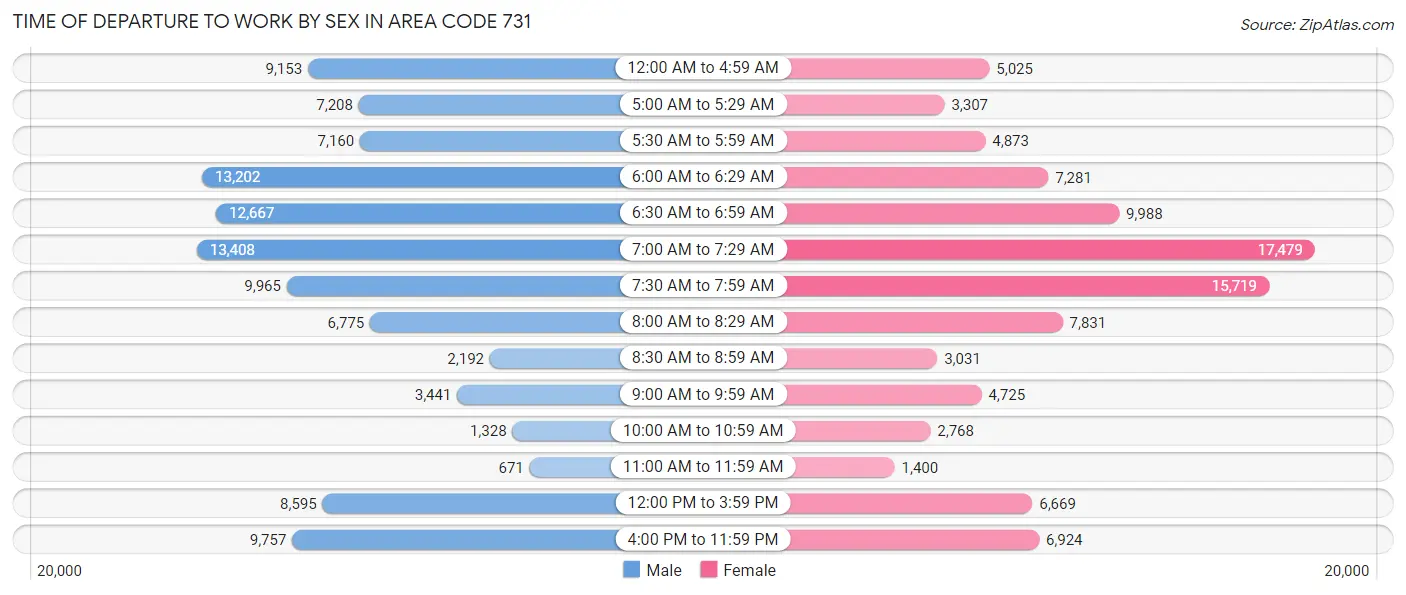
Time of Departure to Work by Sex in Area Code 731
The most frequent times of departure to work in Area Code 731 are 7:00 AM to 7:29 AM (13,408, 12.7%) for males and 7:00 AM to 7:29 AM (17,479, 18.0%) for females.
| Time of Departure | Male | Female |
| 12:00 AM to 4:59 AM | 9,153 (8.7%) | 5,025 (5.2%) |
| 5:00 AM to 5:29 AM | 7,208 (6.8%) | 3,307 (3.4%) |
| 5:30 AM to 5:59 AM | 7,160 (6.8%) | 4,873 (5.0%) |
| 6:00 AM to 6:29 AM | 13,202 (12.5%) | 7,281 (7.5%) |
| 6:30 AM to 6:59 AM | 12,667 (12.0%) | 9,988 (10.3%) |
| 7:00 AM to 7:29 AM | 13,408 (12.7%) | 17,479 (18.0%) |
| 7:30 AM to 7:59 AM | 9,965 (9.4%) | 15,719 (16.2%) |
| 8:00 AM to 8:29 AM | 6,775 (6.4%) | 7,831 (8.1%) |
| 8:30 AM to 8:59 AM | 2,192 (2.1%) | 3,031 (3.1%) |
| 9:00 AM to 9:59 AM | 3,441 (3.3%) | 4,725 (4.9%) |
| 10:00 AM to 10:59 AM | 1,328 (1.3%) | 2,768 (2.9%) |
| 11:00 AM to 11:59 AM | 671 (0.6%) | 1,400 (1.4%) |
| 12:00 PM to 3:59 PM | 8,595 (8.2%) | 6,669 (6.9%) |
| 4:00 PM to 11:59 PM | 9,757 (9.2%) | 6,924 (7.1%) |
| Total | 105,522 (100.0%) | 97,020 (100.0%) |
Housing Occupancy in Area Code 731
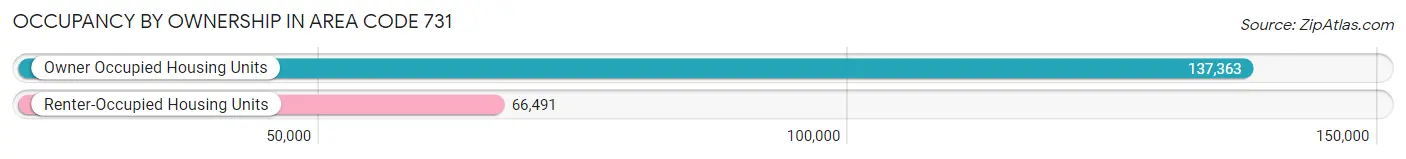
Occupancy by Ownership in Area Code 731
Of the total 203,854 dwellings in Area Code 731, owner-occupied units account for 137,363 (67.4%), while renter-occupied units make up 66,491 (32.6%).
| Occupancy | # Housing Units | % Housing Units |
| Owner Occupied Housing Units | 137,363 | 67.4% |
| Renter-Occupied Housing Units | 66,491 | 32.6% |
| Total Occupied Housing Units | 203,854 | 100.0% |
Occupancy by Household Size in Area Code 731
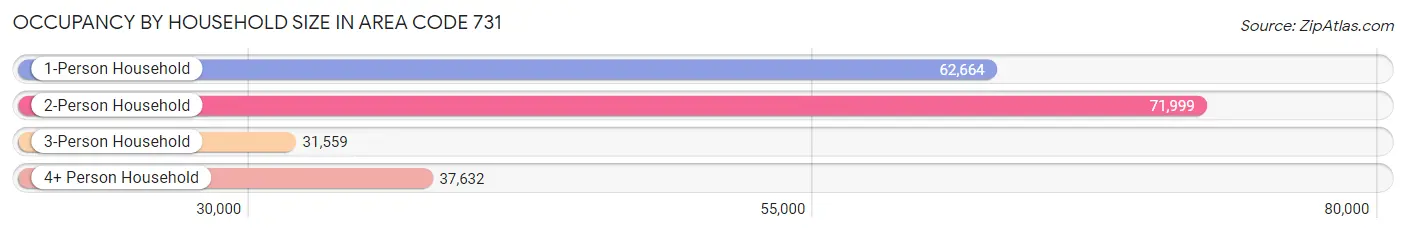
| Household Size | # Housing Units | % Housing Units |
| 1-Person Household | 62,664 | 30.7% |
| 2-Person Household | 71,999 | 35.3% |
| 3-Person Household | 31,559 | 15.5% |
| 4+ Person Household | 37,632 | 18.5% |
| Total Housing Units | 203,854 | 100.0% |
Occupancy by Ownership by Household Size in Area Code 731
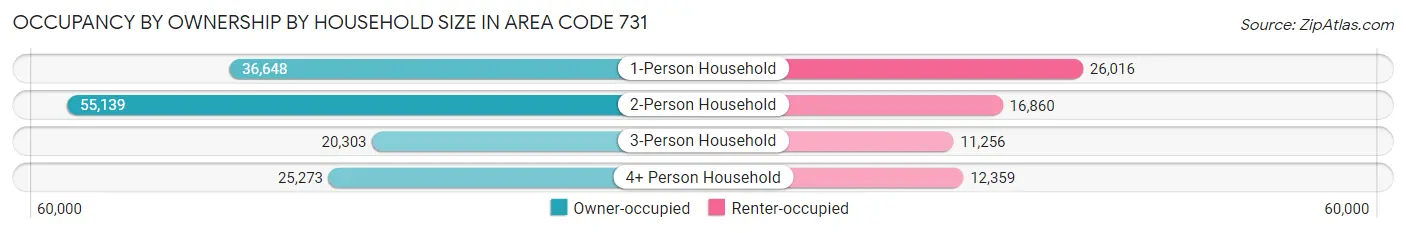
| Household Size | Owner-occupied | Renter-occupied |
| 1-Person Household | 36,648 (58.5%) | 26,016 (41.5%) |
| 2-Person Household | 55,139 (76.6%) | 16,860 (23.4%) |
| 3-Person Household | 20,303 (64.3%) | 11,256 (35.7%) |
| 4+ Person Household | 25,273 (67.2%) | 12,359 (32.8%) |
| Total Housing Units | 137,363 (67.4%) | 66,491 (32.6%) |
Occupancy by Educational Attainment in Area Code 731
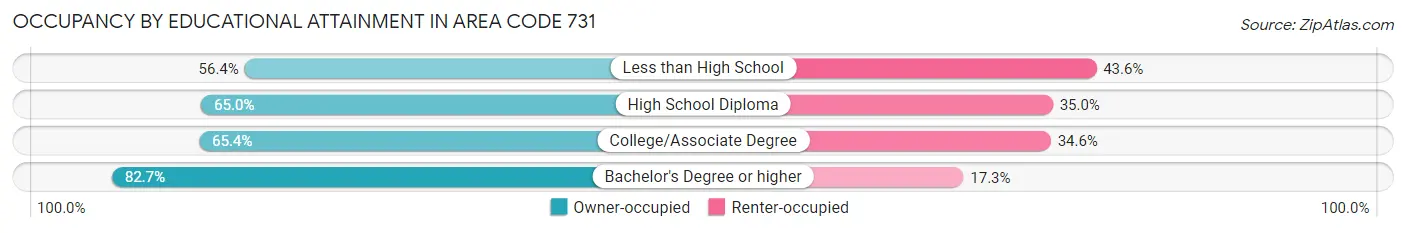
| Household Size | Owner-occupied | Renter-occupied |
| Less than High School | 14,058 (56.4%) | 10,878 (43.6%) |
| High School Diploma | 51,672 (65.0%) | 27,827 (35.0%) |
| College/Associate Degree | 40,034 (65.4%) | 21,182 (34.6%) |
| Bachelor's Degree or higher | 31,599 (82.7%) | 6,604 (17.3%) |
Occupancy by Age of Householder in Area Code 731
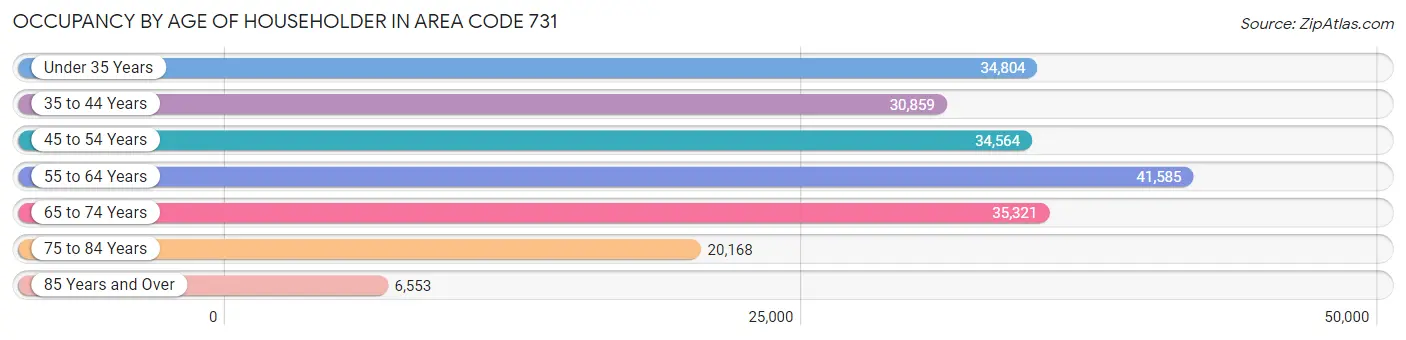
| Age Bracket | # Households | % Households |
| Under 35 Years | 34,804 | 17.1% |
| 35 to 44 Years | 30,859 | 15.1% |
| 45 to 54 Years | 34,564 | 17.0% |
| 55 to 64 Years | 41,585 | 20.4% |
| 65 to 74 Years | 35,321 | 17.3% |
| 75 to 84 Years | 20,168 | 9.9% |
| 85 Years and Over | 6,553 | 3.2% |
| Total | 203,854 | 100.0% |
Housing Finances in Area Code 731
Median Income by Occupancy in Area Code 731
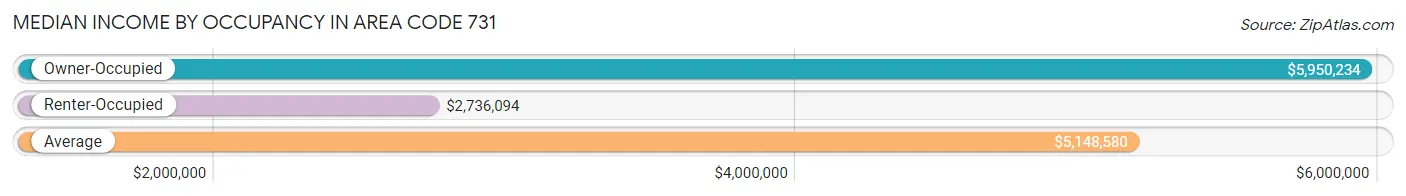
| Occupancy Type | # Households | Median Income |
| Owner-Occupied | 137,363 (67.4%) | $5,950,234 |
| Renter-Occupied | 66,491 (32.6%) | $2,736,094 |
| Average | 203,854 (100.0%) | $5,148,580 |
Occupancy by Householder Income Bracket in Area Code 731
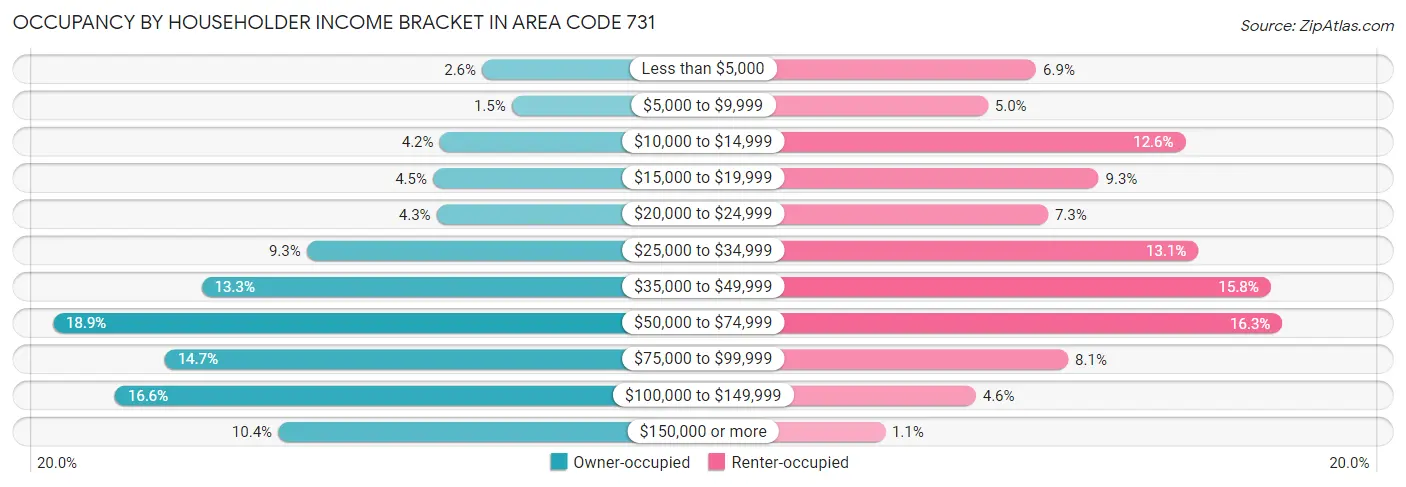
| Income Bracket | Owner-occupied | Renter-occupied |
| Less than $5,000 | 3,548 (2.6%) | 4,576 (6.9%) |
| $5,000 to $9,999 | 1,991 (1.5%) | 3,352 (5.0%) |
| $10,000 to $14,999 | 5,776 (4.2%) | 8,350 (12.6%) |
| $15,000 to $19,999 | 6,111 (4.4%) | 6,156 (9.3%) |
| $20,000 to $24,999 | 5,915 (4.3%) | 4,877 (7.3%) |
| $25,000 to $34,999 | 12,719 (9.3%) | 8,680 (13.1%) |
| $35,000 to $49,999 | 18,215 (13.3%) | 10,515 (15.8%) |
| $50,000 to $74,999 | 25,988 (18.9%) | 10,805 (16.3%) |
| $75,000 to $99,999 | 20,143 (14.7%) | 5,386 (8.1%) |
| $100,000 to $149,999 | 22,743 (16.6%) | 3,047 (4.6%) |
| $150,000 or more | 14,214 (10.3%) | 747 (1.1%) |
| Total | 137,363 (100.0%) | 66,491 (100.0%) |
Monthly Housing Cost Tiers in Area Code 731
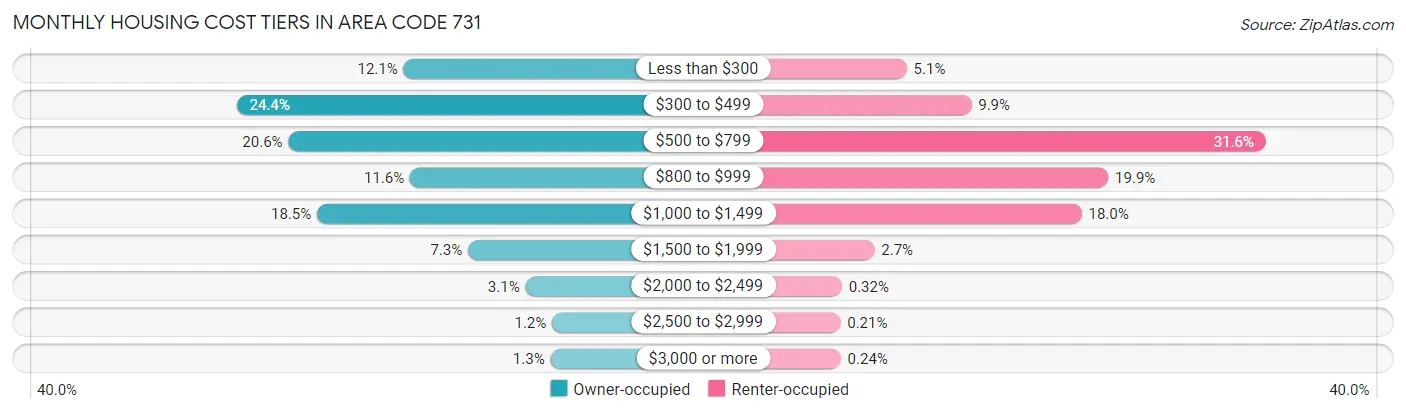
| Monthly Cost | Owner-occupied | Renter-occupied |
| Less than $300 | 16,611 (12.1%) | 3,391 (5.1%) |
| $300 to $499 | 33,499 (24.4%) | 6,558 (9.9%) |
| $500 to $799 | 28,260 (20.6%) | 20,978 (31.6%) |
| $800 to $999 | 15,952 (11.6%) | 13,257 (19.9%) |
| $1,000 to $1,499 | 25,364 (18.5%) | 11,954 (18.0%) |
| $1,500 to $1,999 | 10,086 (7.3%) | 1,811 (2.7%) |
| $2,000 to $2,499 | 4,275 (3.1%) | 213 (0.3%) |
| $2,500 to $2,999 | 1,578 (1.1%) | 137 (0.2%) |
| $3,000 or more | 1,738 (1.3%) | 162 (0.2%) |
| Total | 137,363 (100.0%) | 66,491 (100.0%) |
Physical Housing Characteristics in Area Code 731
Housing Structures in Area Code 731
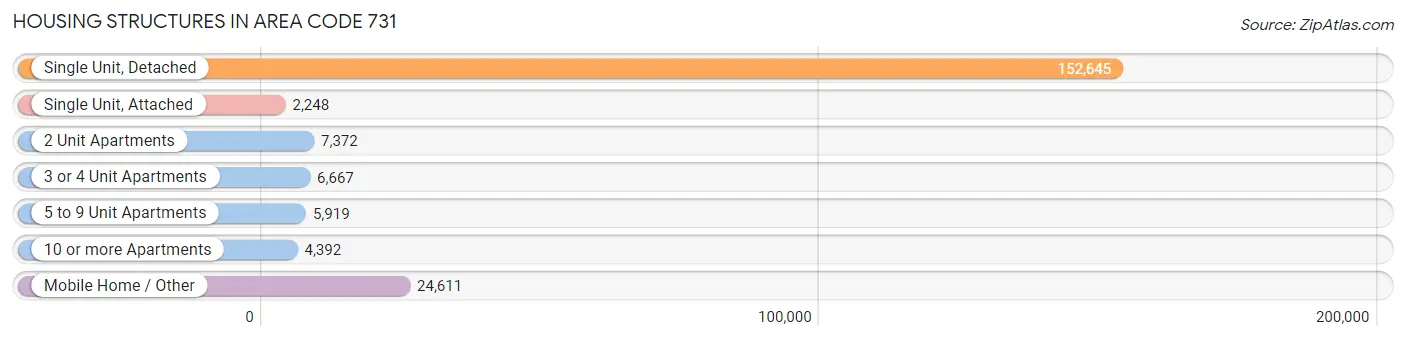
| Structure Type | # Housing Units | % Housing Units |
| Single Unit, Detached | 152,645 | 74.9% |
| Single Unit, Attached | 2,248 | 1.1% |
| 2 Unit Apartments | 7,372 | 3.6% |
| 3 or 4 Unit Apartments | 6,667 | 3.3% |
| 5 to 9 Unit Apartments | 5,919 | 2.9% |
| 10 or more Apartments | 4,392 | 2.1% |
| Mobile Home / Other | 24,611 | 12.1% |
| Total | 203,854 | 100.0% |
Housing Structures by Occupancy in Area Code 731
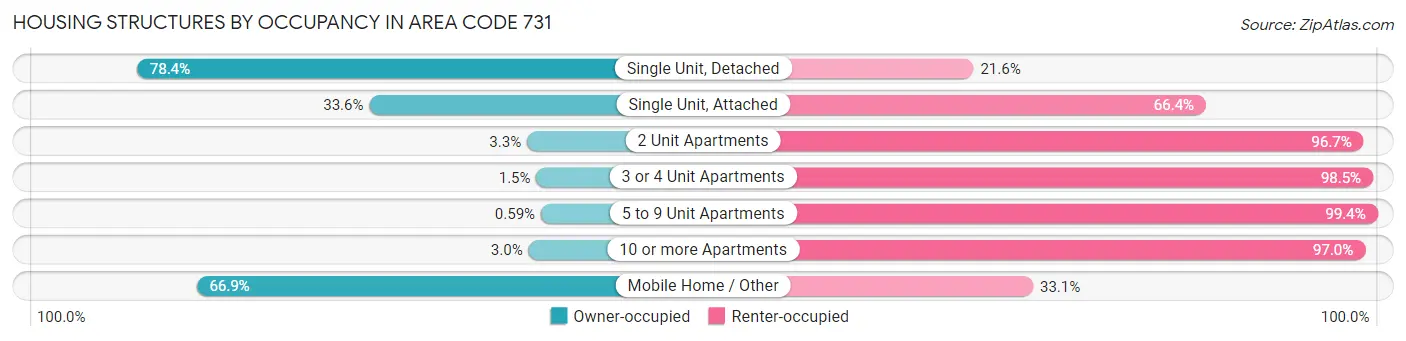
| Structure Type | Owner-occupied | Renter-occupied |
| Single Unit, Detached | 119,636 (78.4%) | 33,009 (21.6%) |
| Single Unit, Attached | 756 (33.6%) | 1,492 (66.4%) |
| 2 Unit Apartments | 241 (3.3%) | 7,131 (96.7%) |
| 3 or 4 Unit Apartments | 98 (1.5%) | 6,569 (98.5%) |
| 5 to 9 Unit Apartments | 35 (0.6%) | 5,884 (99.4%) |
| 10 or more Apartments | 131 (3.0%) | 4,261 (97.0%) |
| Mobile Home / Other | 16,466 (66.9%) | 8,145 (33.1%) |
| Total | 137,363 (67.4%) | 66,491 (32.6%) |
Housing Structures by Number of Rooms in Area Code 731
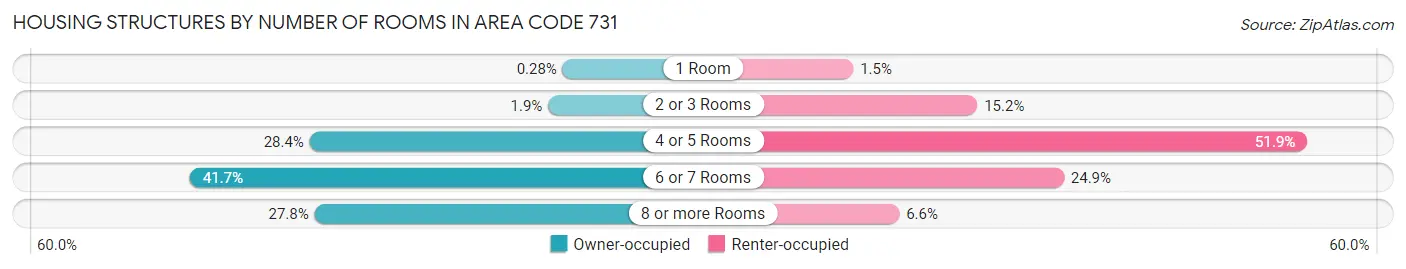
| Number of Rooms | Owner-occupied | Renter-occupied |
| 1 Room | 383 (0.3%) | 986 (1.5%) |
| 2 or 3 Rooms | 2,595 (1.9%) | 10,130 (15.2%) |
| 4 or 5 Rooms | 38,956 (28.4%) | 34,478 (51.8%) |
| 6 or 7 Rooms | 57,220 (41.7%) | 16,523 (24.8%) |
| 8 or more Rooms | 38,209 (27.8%) | 4,374 (6.6%) |
| Total | 137,363 (100.0%) | 66,491 (100.0%) |
Housing Structure by Heating Type in Area Code 731
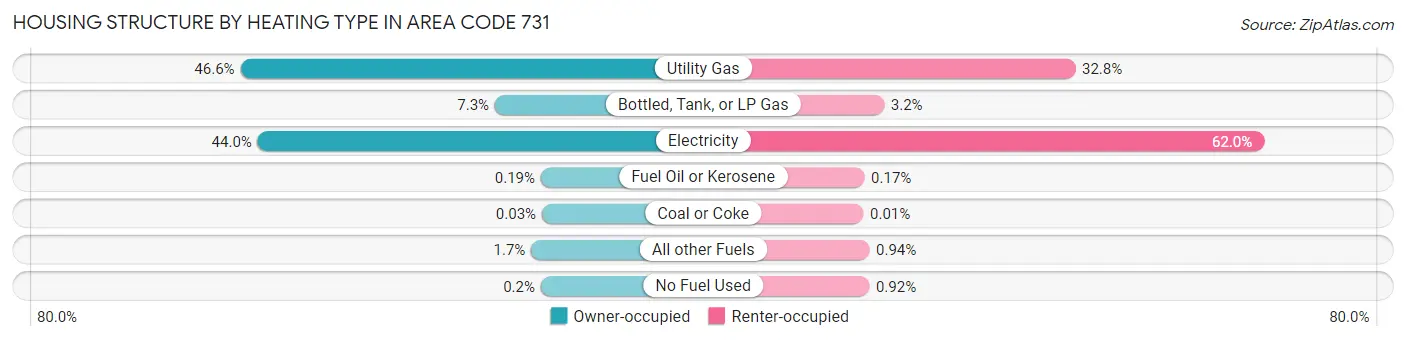
| Heating Type | Owner-occupied | Renter-occupied |
| Utility Gas | 64,061 (46.6%) | 21,787 (32.8%) |
| Bottled, Tank, or LP Gas | 10,013 (7.3%) | 2,141 (3.2%) |
| Electricity | 60,405 (44.0%) | 41,209 (62.0%) |
| Fuel Oil or Kerosene | 258 (0.2%) | 116 (0.2%) |
| Coal or Coke | 39 (0.0%) | 4 (0.0%) |
| All other Fuels | 2,318 (1.7%) | 623 (0.9%) |
| No Fuel Used | 269 (0.2%) | 611 (0.9%) |
| Total | 137,363 (100.0%) | 66,491 (100.0%) |
Household Vehicle Usage in Area Code 731
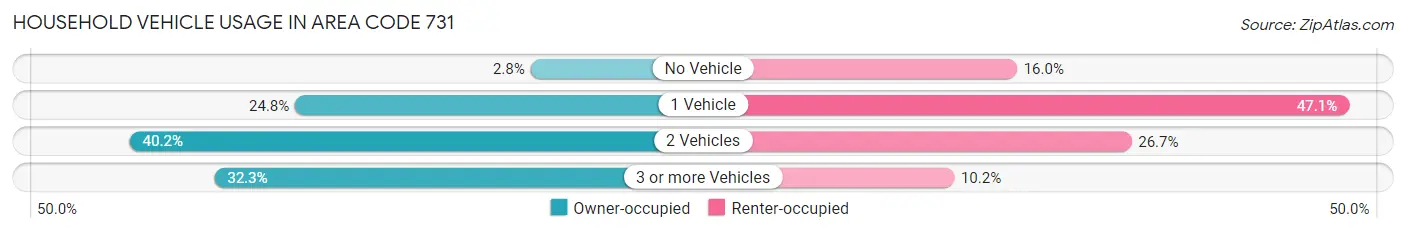
| Vehicles per Household | Owner-occupied | Renter-occupied |
| No Vehicle | 3,809 (2.8%) | 10,666 (16.0%) |
| 1 Vehicle | 34,004 (24.7%) | 31,284 (47.0%) |
| 2 Vehicles | 55,200 (40.2%) | 17,775 (26.7%) |
| 3 or more Vehicles | 44,350 (32.3%) | 6,766 (10.2%) |
| Total | 137,363 (100.0%) | 66,491 (100.0%) |
Real Estate & Mortgages in Area Code 731
Real Estate and Mortgage Overview in Area Code 731
| Characteristic | Without Mortgage | With Mortgage |
| Housing Units | 70,248 | 67,115 |
| Median Property Value | $10,356,300 | $12,626,900 |
| Median Household Income | $4,397,298 | $9,441 |
| Monthly Housing Costs | $37,413 | $1,646 |
| Real Estate Taxes | $64,351 | $2,441 |
Property Value by Mortgage Status in Area Code 731
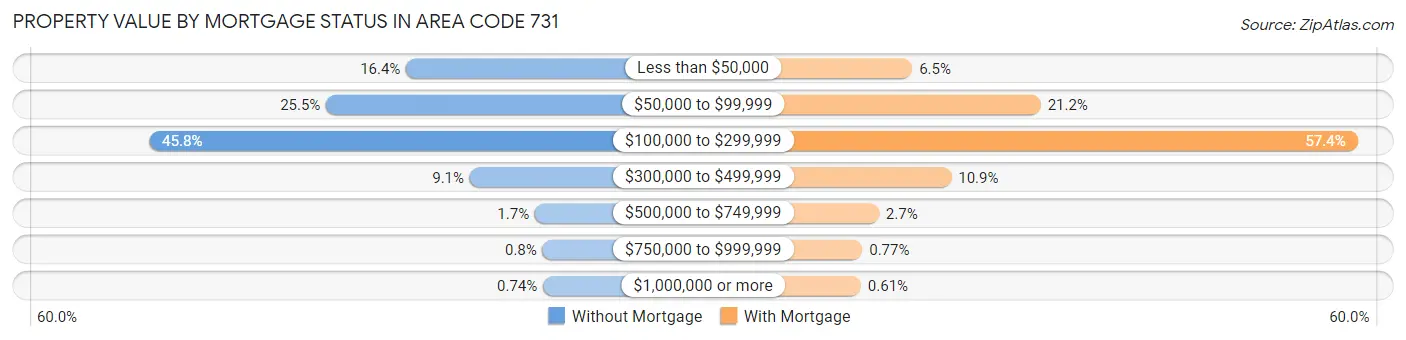
| Property Value | Without Mortgage | With Mortgage |
| Less than $50,000 | 11,514 (16.4%) | 4,347 (6.5%) |
| $50,000 to $99,999 | 17,936 (25.5%) | 14,203 (21.2%) |
| $100,000 to $299,999 | 32,145 (45.8%) | 38,505 (57.4%) |
| $300,000 to $499,999 | 6,400 (9.1%) | 7,342 (10.9%) |
| $500,000 to $749,999 | 1,172 (1.7%) | 1,792 (2.7%) |
| $750,000 to $999,999 | 564 (0.8%) | 518 (0.8%) |
| $1,000,000 or more | 517 (0.7%) | 408 (0.6%) |
| Total | 70,248 (100.0%) | 67,115 (100.0%) |
Household Income by Mortgage Status in Area Code 731
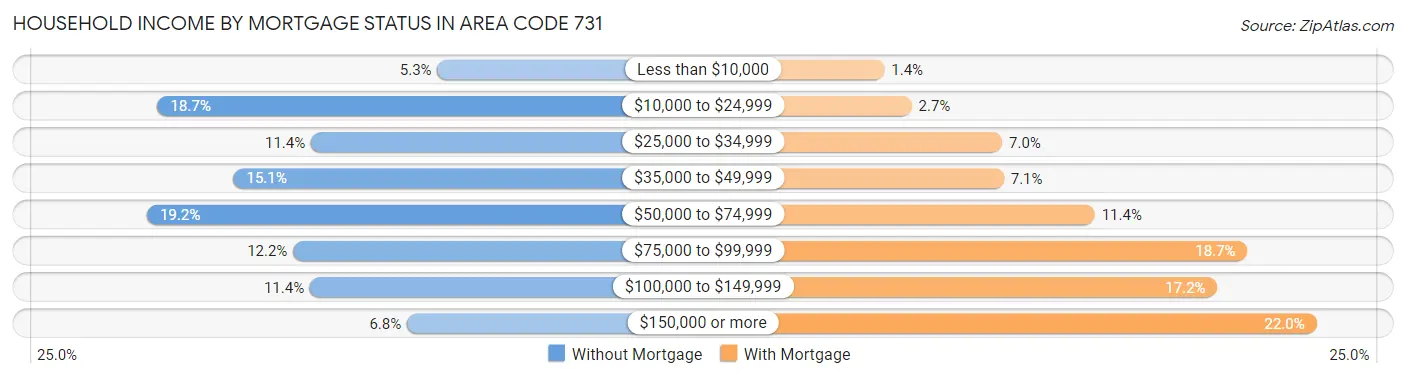
| Household Income | Without Mortgage | With Mortgage |
| Less than $10,000 | 3,750 (5.3%) | 921 (1.4%) |
| $10,000 to $24,999 | 13,117 (18.7%) | 1,789 (2.7%) |
| $25,000 to $34,999 | 7,979 (11.4%) | 4,685 (7.0%) |
| $35,000 to $49,999 | 10,572 (15.0%) | 4,740 (7.1%) |
| $50,000 to $74,999 | 13,466 (19.2%) | 7,643 (11.4%) |
| $75,000 to $99,999 | 8,579 (12.2%) | 12,522 (18.7%) |
| $100,000 to $149,999 | 8,012 (11.4%) | 11,564 (17.2%) |
| $150,000 or more | 4,773 (6.8%) | 14,731 (22.0%) |
| Total | 70,248 (100.0%) | 67,115 (100.0%) |
Property Value to Household Income Ratio in Area Code 731
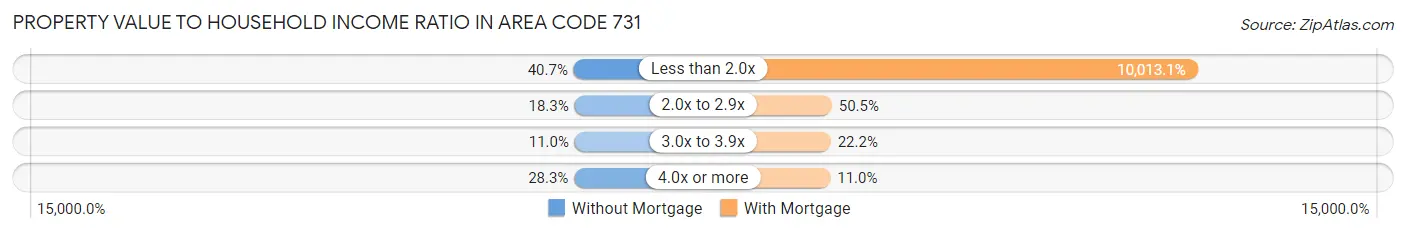
| Value-to-Income Ratio | Without Mortgage | With Mortgage |
| Less than 2.0x | 28,590 (40.7%) | 6,720,276 (10,013.1%) |
| 2.0x to 2.9x | 12,841 (18.3%) | 33,875 (50.5%) |
| 3.0x to 3.9x | 7,725 (11.0%) | 14,882 (22.2%) |
| 4.0x or more | 19,867 (28.3%) | 7,357 (11.0%) |
| Total | 70,248 (100.0%) | 67,115 (100.0%) |
Real Estate Taxes by Mortgage Status in Area Code 731
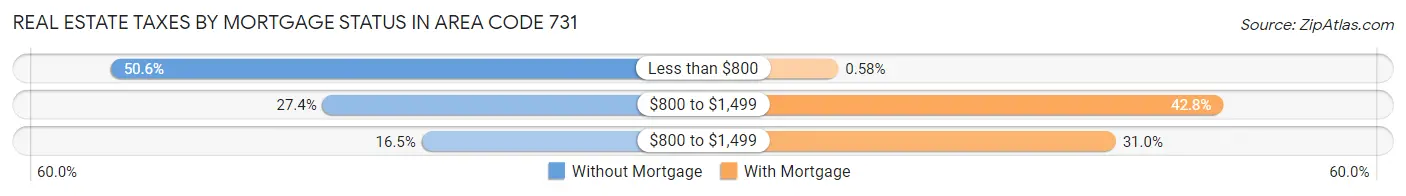
| Property Taxes | Without Mortgage | With Mortgage |
| Less than $800 | 35,520 (50.6%) | 390 (0.6%) |
| $800 to $1,499 | 19,212 (27.4%) | 28,698 (42.8%) |
| $800 to $1,499 | 11,583 (16.5%) | 20,789 (31.0%) |
| Total | 70,248 (100.0%) | 67,115 (100.0%) |
Health & Disability in Area Code 731
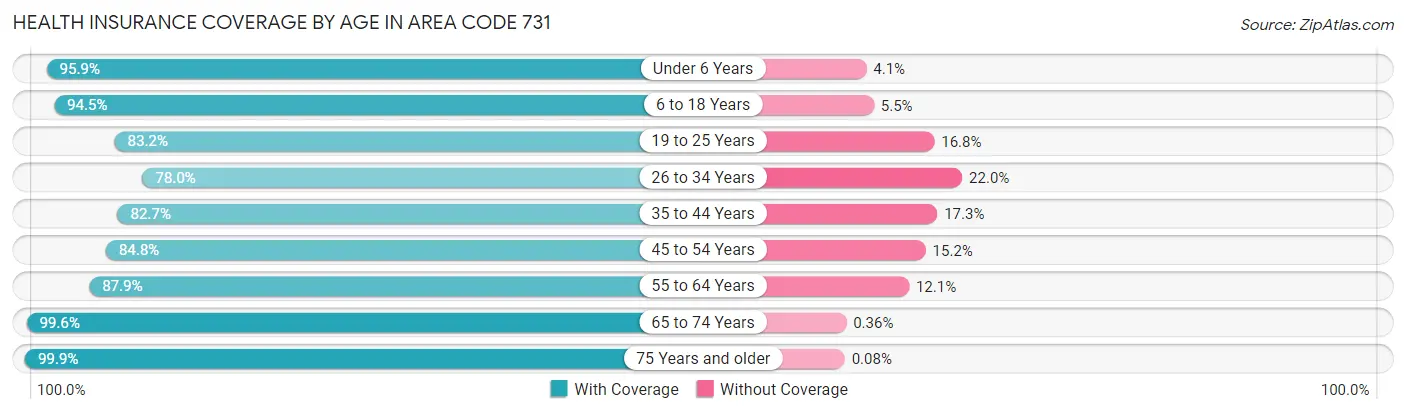
Health Insurance Coverage by Age in Area Code 731
| Age Bracket | With Coverage | Without Coverage |
| Under 6 Years | 34,048 (95.9%) | 1,459 (4.1%) |
| 6 to 18 Years | 80,754 (94.5%) | 4,713 (5.5%) |
| 19 to 25 Years | 38,679 (83.2%) | 7,807 (16.8%) |
| 26 to 34 Years | 42,269 (78.0%) | 11,905 (22.0%) |
| 35 to 44 Years | 48,372 (82.7%) | 10,141 (17.3%) |
| 45 to 54 Years | 52,798 (84.8%) | 9,444 (15.2%) |
| 55 to 64 Years | 62,666 (87.9%) | 8,591 (12.1%) |
| 65 to 74 Years | 56,346 (99.6%) | 204 (0.4%) |
| 75 Years and older | 37,955 (99.9%) | 29 (0.1%) |
| Total | 453,887 (89.3%) | 54,293 (10.7%) |
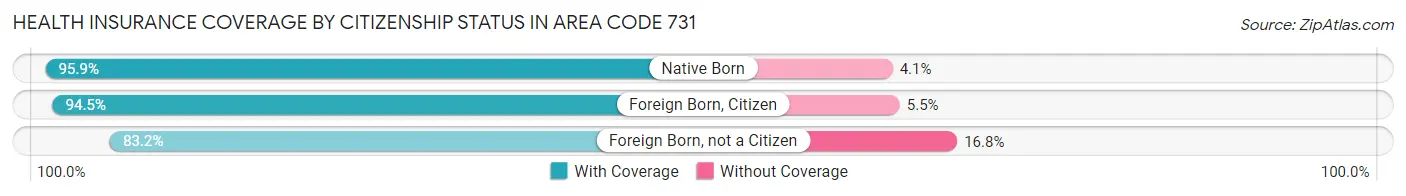
Health Insurance Coverage by Citizenship Status in Area Code 731
| Citizenship Status | With Coverage | Without Coverage |
| Native Born | 34,048 (95.9%) | 1,459 (4.1%) |
| Foreign Born, Citizen | 80,754 (94.5%) | 4,713 (5.5%) |
| Foreign Born, not a Citizen | 38,679 (83.2%) | 7,807 (16.8%) |
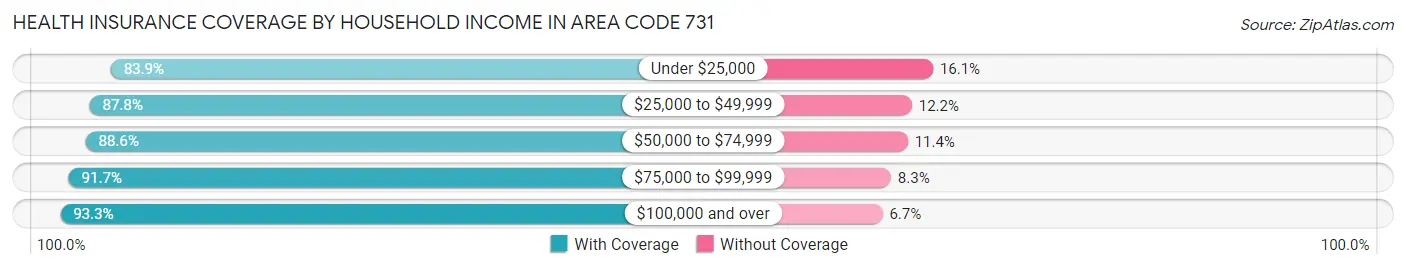
Health Insurance Coverage by Household Income in Area Code 731
| Household Income | With Coverage | Without Coverage |
| Under $25,000 | 74,620 (83.9%) | 14,358 (16.1%) |
| $25,000 to $49,999 | 98,303 (87.8%) | 13,636 (12.2%) |
| $50,000 to $74,999 | 83,413 (88.6%) | 10,748 (11.4%) |
| $75,000 to $99,999 | 69,137 (91.7%) | 6,224 (8.3%) |
| $100,000 and over | 122,170 (93.3%) | 8,746 (6.7%) |
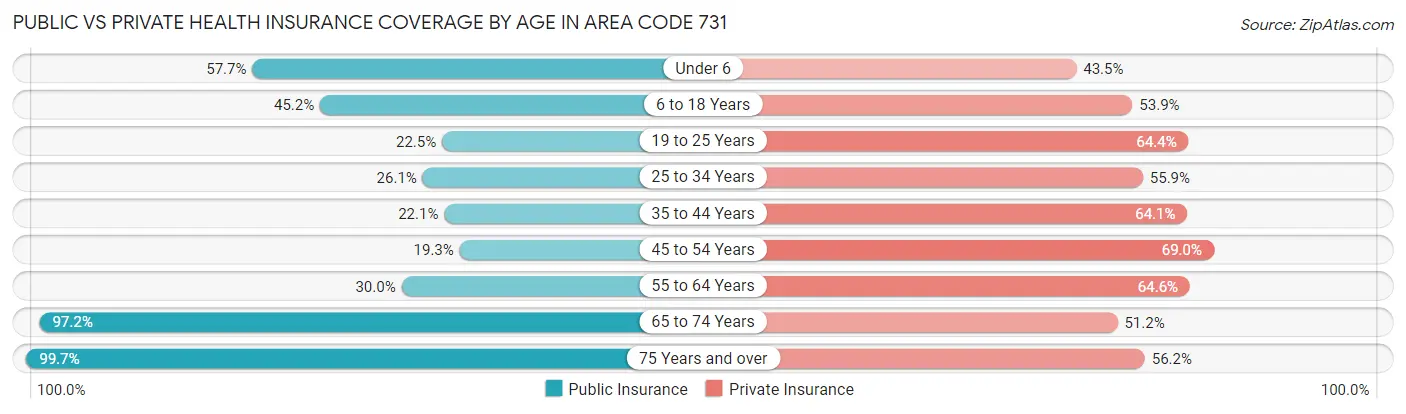
Public vs Private Health Insurance Coverage by Age in Area Code 731
| Age Bracket | Public Insurance | Private Insurance |
| Under 6 | 20,501 (57.7%) | 15,454 (43.5%) |
| 6 to 18 Years | 38,598 (45.2%) | 46,099 (53.9%) |
| 19 to 25 Years | 10,470 (22.5%) | 29,916 (64.3%) |
| 25 to 34 Years | 14,143 (26.1%) | 30,273 (55.9%) |
| 35 to 44 Years | 12,940 (22.1%) | 37,526 (64.1%) |
| 45 to 54 Years | 11,986 (19.3%) | 42,972 (69.0%) |
| 55 to 64 Years | 21,405 (30.0%) | 46,042 (64.6%) |
| 65 to 74 Years | 54,986 (97.2%) | 28,935 (51.2%) |
| 75 Years and over | 37,864 (99.7%) | 21,363 (56.2%) |
| Total | 222,893 (43.9%) | 298,580 (58.8%) |
Disability Status by Sex by Age in Area Code 731
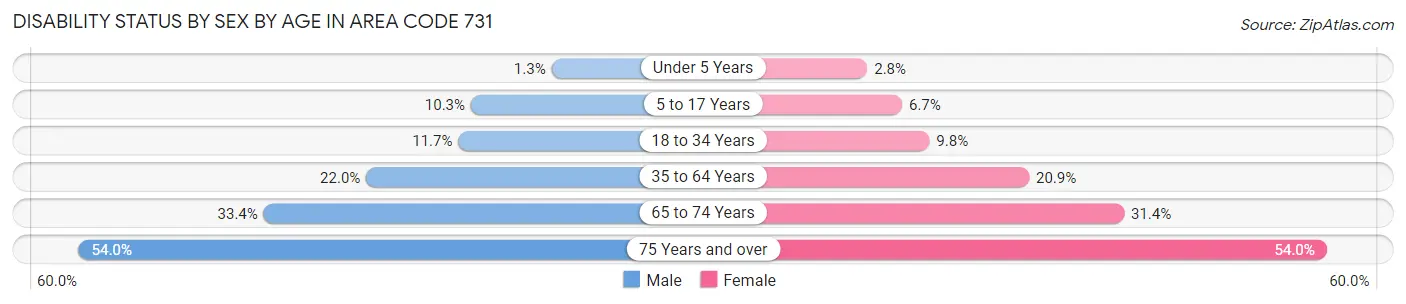
| Age Bracket | Male | Female |
| Under 5 Years | 190 (1.3%) | 403 (2.8%) |
| 5 to 17 Years | 4,461 (10.3%) | 2,816 (6.7%) |
| 18 to 34 Years | 6,245 (11.7%) | 5,313 (9.8%) |
| 35 to 64 Years | 20,369 (22.0%) | 20,692 (20.8%) |
| 65 to 74 Years | 8,786 (33.4%) | 9,501 (31.4%) |
| 75 Years and over | 8,362 (54.0%) | 12,143 (54.0%) |
Disability Class by Sex by Age in Area Code 731
Disability Class: Hearing Difficulty
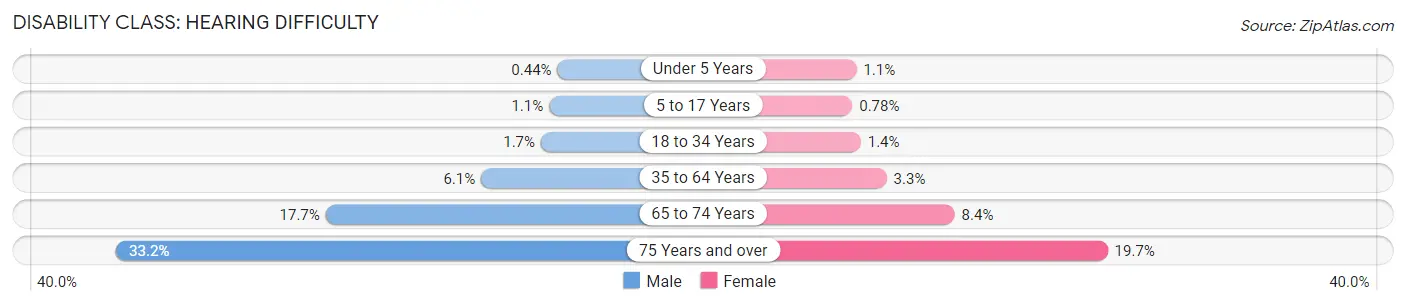
| Age Bracket | Male | Female |
| Under 5 Years | 63 (0.4%) | 155 (1.1%) |
| 5 to 17 Years | 459 (1.1%) | 326 (0.8%) |
| 18 to 34 Years | 892 (1.7%) | 767 (1.4%) |
| 35 to 64 Years | 5,665 (6.1%) | 3,305 (3.3%) |
| 65 to 74 Years | 4,644 (17.6%) | 2,532 (8.4%) |
| 75 Years and over | 5,143 (33.2%) | 4,439 (19.7%) |
Disability Class: Vision Difficulty
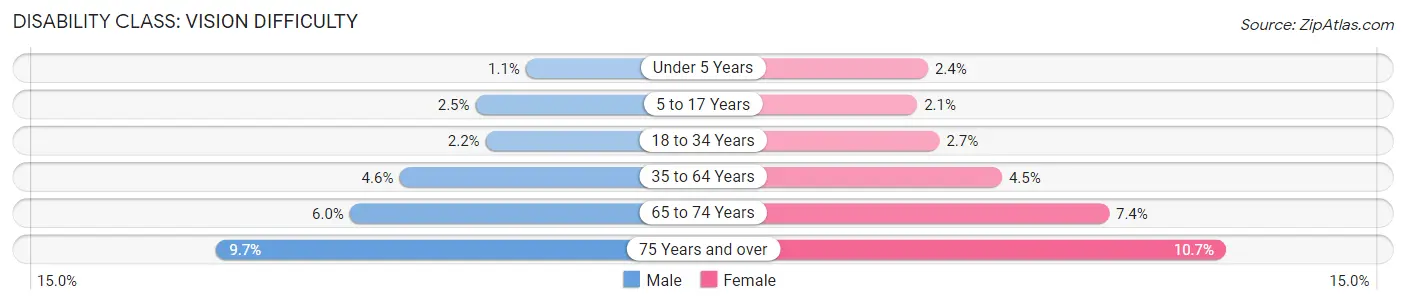
| Age Bracket | Male | Female |
| Under 5 Years | 151 (1.1%) | 340 (2.4%) |
| 5 to 17 Years | 1,062 (2.5%) | 881 (2.1%) |
| 18 to 34 Years | 1,160 (2.2%) | 1,483 (2.7%) |
| 35 to 64 Years | 4,235 (4.6%) | 4,426 (4.5%) |
| 65 to 74 Years | 1,566 (5.9%) | 2,249 (7.4%) |
| 75 Years and over | 1,496 (9.7%) | 2,404 (10.7%) |
Disability Class: Cognitive Difficulty
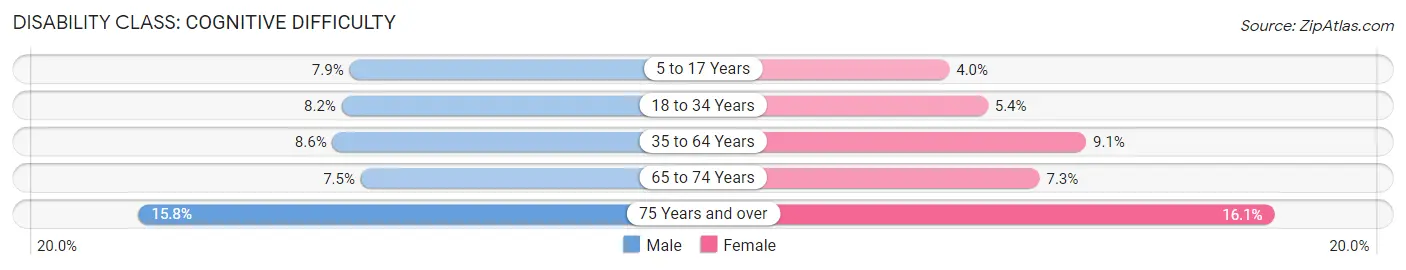
| Age Bracket | Male | Female |
| 5 to 17 Years | 3,437 (7.9%) | 1,676 (4.0%) |
| 18 to 34 Years | 4,393 (8.2%) | 2,953 (5.4%) |
| 35 to 64 Years | 7,947 (8.6%) | 9,005 (9.1%) |
| 65 to 74 Years | 1,978 (7.5%) | 2,220 (7.3%) |
| 75 Years and over | 2,443 (15.8%) | 3,612 (16.1%) |
Disability Class: Ambulatory Difficulty
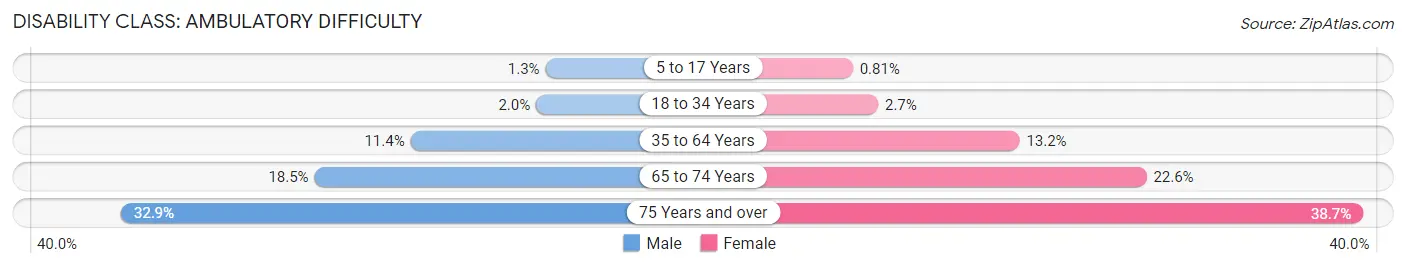
| Age Bracket | Male | Female |
| 5 to 17 Years | 577 (1.3%) | 339 (0.8%) |
| 18 to 34 Years | 1,082 (2.0%) | 1,465 (2.7%) |
| 35 to 64 Years | 10,526 (11.4%) | 13,097 (13.2%) |
| 65 to 74 Years | 4,863 (18.5%) | 6,839 (22.6%) |
| 75 Years and over | 5,089 (32.9%) | 8,704 (38.7%) |
Disability Class: Self-Care Difficulty
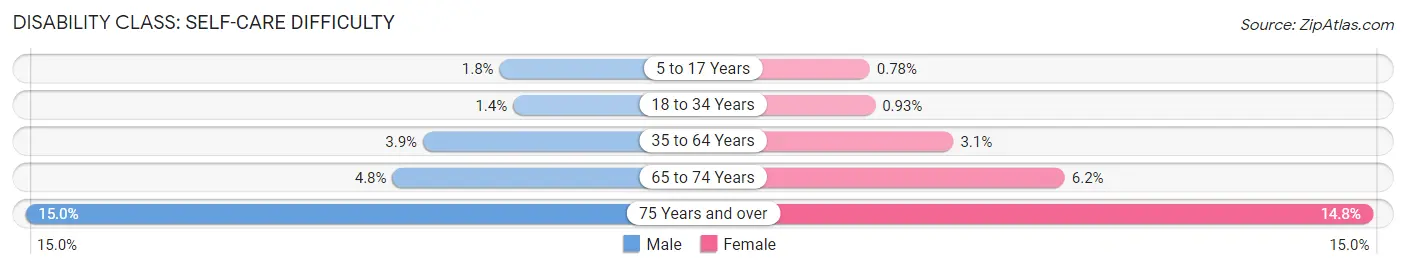
| Age Bracket | Male | Female |
| 5 to 17 Years | 770 (1.8%) | 329 (0.8%) |
| 18 to 34 Years | 748 (1.4%) | 509 (0.9%) |
| 35 to 64 Years | 3,629 (3.9%) | 3,083 (3.1%) |
| 65 to 74 Years | 1,253 (4.8%) | 1,877 (6.2%) |
| 75 Years and over | 2,320 (15.0%) | 3,324 (14.8%) |
Technology Access in Area Code 731
Computing Device Access in Area Code 731
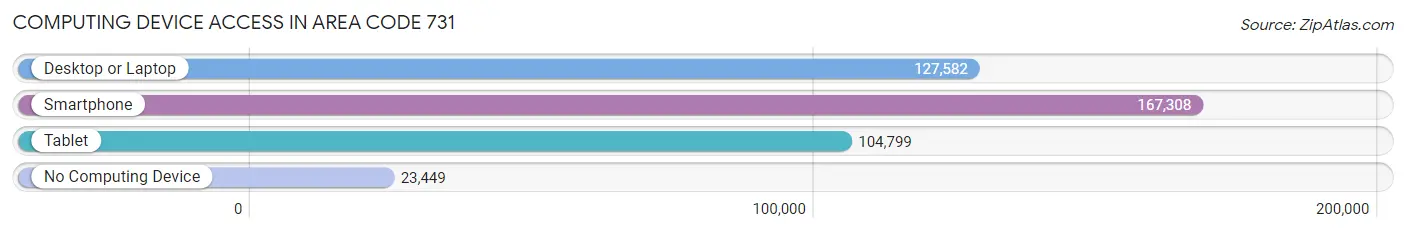
| Device Type | # Households | % Households |
| Desktop or Laptop | 127,582 | 62.6% |
| Smartphone | 167,308 | 82.1% |
| Tablet | 104,799 | 51.4% |
| No Computing Device | 23,449 | 11.5% |
| Total | 203,854 | 100.0% |
Internet Access in Area Code 731
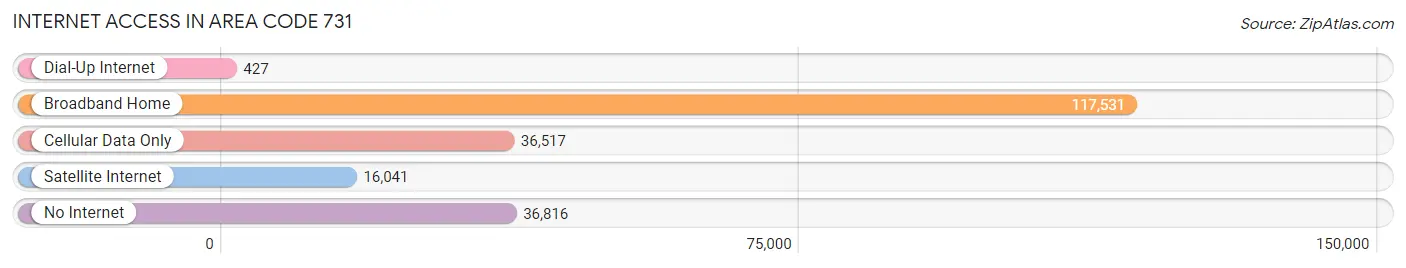
| Internet Type | # Households | % Households |
| Dial-Up Internet | 427 | 0.2% |
| Broadband Home | 117,531 | 57.7% |
| Cellular Data Only | 36,517 | 17.9% |
| Satellite Internet | 16,041 | 7.9% |
| No Internet | 36,816 | 18.1% |
| Total | 203,854 | 100.0% |
Area Code 731 Summary
Geography
Area code 731 is located in the western part of Tennessee and covers the cities of Jackson, Dyersburg, Union City, and Martin. It also covers the counties of Madison, Obion, Dyer, Lake, and Weakley.
Social
Area code 731 is home to a variety of cultures and lifestyles. The area is known for its music, art, and outdoor activities. The area is also home to a number of universities and colleges, including the University of Tennessee at Martin and Jackson State Community College.
Economics
Area code 731 is home to a variety of industries, including manufacturing, healthcare, and retail. The area is also home to a number of large employers, such as Tyson Foods, Walmart, and the Jackson Energy Authority.
Demographics
Area code 731 is home to a population of over 500,000 people. The area is predominantly white, with African Americans making up the second largest racial group. The median household income is around $45,000, and the median age is around 37 years old.
Common Questions
What is Per Capita Income in Area Code 731?
Per Capita income in Area Code 731 is $26,846.
What is the Median Family Income in Area Code 731?
Median Family Income in Area Code 731 is $63,642.
What is the Median Household income in Area Code 731?
Median Household Income in Area Code 731 is $50,976.
What is Income or Wage Gap in Area Code 731?
Income or Wage Gap in Area Code 731 is 26.1%.
Women in Area Code 731 earn 73.9 cents for every dollar earned by a man.
What is Family Income Deficit in Area Code 731?
Family Income Deficit in Area Code 731 is $10,623.
Families that are below poverty line in Area Code 731 earn $10,623 less on average than the poverty threshold level.
What is Inequality or Gini Index in Area Code 731?
Inequality or Gini Index in Area Code 731 is 42.95.
What is the Total Population of Area Code 731?
Total Population of Area Code 731 is 523,654.
What is the Total Male Population of Area Code 731?
Total Male Population of Area Code 731 is 257,163.
What is the Total Female Population of Area Code 731?
Total Female Population of Area Code 731 is 266,491.
What is the Ratio of Males per 100 Females in Area Code 731?
There are 96.50 Males per 100 Females in Area Code 731.
What is the Ratio of Females per 100 Males in Area Code 731?
There are 103.63 Females per 100 Males in Area Code 731.
What is the Median Population Age in Area Code 731?
Median Population Age in Area Code 731 is 44.0 Years.
What is the Average Family Size in Area Code 731
Average Family Size in Area Code 731 is 3.1 People.
What is the Average Household Size in Area Code 731
Average Household Size in Area Code 731 is 2.5 People.
How Large is the Labor Force in Area Code 731?
There are 228,162 People in the Labor Forcein in Area Code 731.
What is the Percentage of People in the Labor Force in Area Code 731?
53.9% of People are in the Labor Force in Area Code 731.
What is the Unemployment Rate in Area Code 731?
Unemployment Rate in Area Code 731 is 6.5%.