Area Code 615 Map & Demographics
Area Code 615 Map
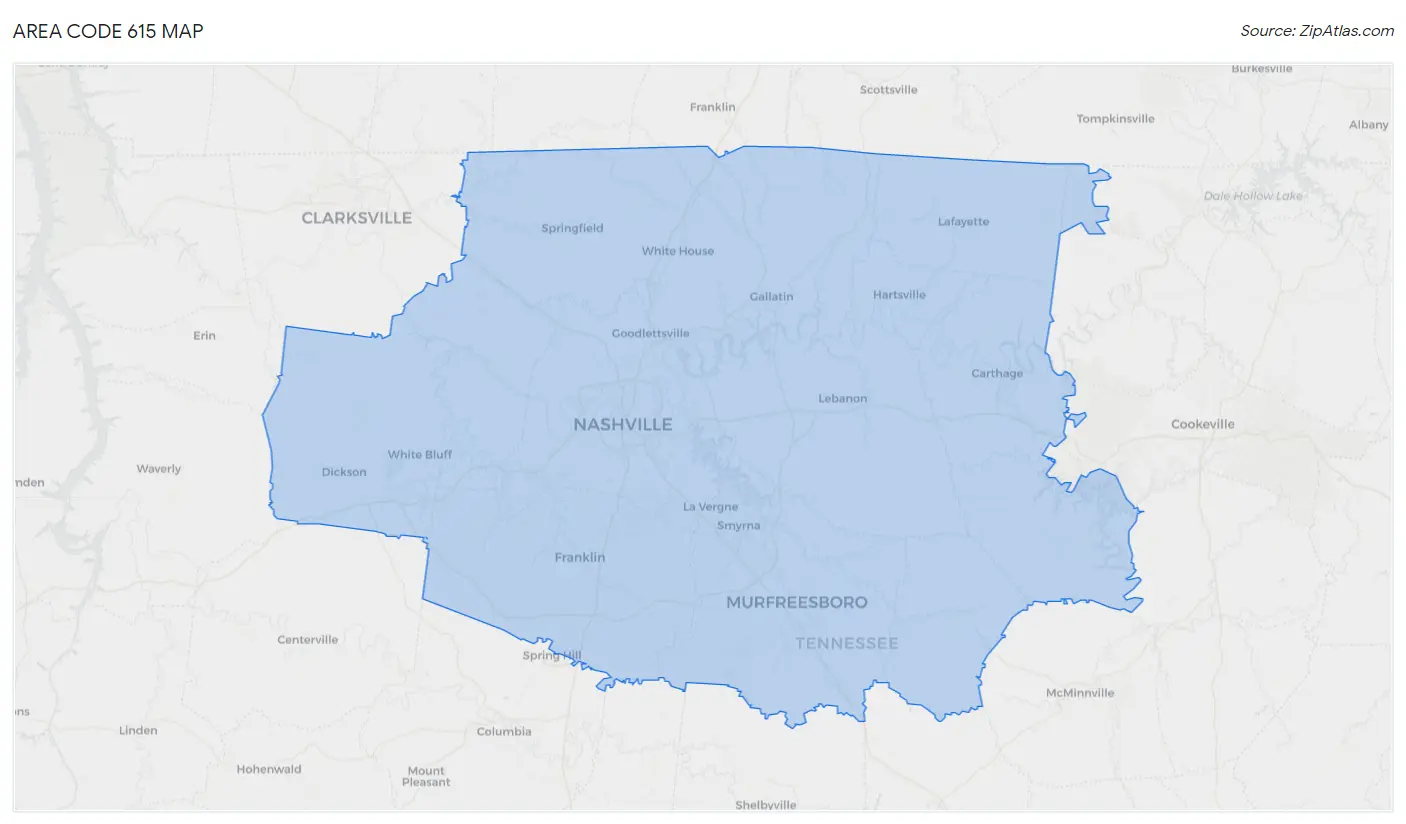
Area Code 615 Overview
$40,949
PER CAPITA INCOME
$98,008
AVG FAMILY INCOME
$80,306
AVG HOUSEHOLD INCOME
28.2%
WAGE / INCOME GAP [ % ]
71.8¢/ $1
WAGE / INCOME GAP [ $ ]
$10,726
FAMILY INCOME DEFICIT
42.98
INEQUALITY / GINI INDEX
2,110,036
TOTAL POPULATION
1,038,002
MALE POPULATION
1,072,034
FEMALE POPULATION
96.83
MALES / 100 FEMALES
103.28
FEMALES / 100 MALES
39.0
MEDIAN AGE
3.1
AVG FAMILY SIZE
2.6
AVG HOUSEHOLD SIZE
1,080,562
LABOR FORCE [ PEOPLE ]
64.2%
PERCENT IN LABOR FORCE
4.0%
UNEMPLOYMENT RATE
Income in Area Code 615
Income Overview in Area Code 615
Per Capita Income in Area Code 615 is $40,949, while median incomes of families and households are $98,008 and $80,306 respectively.
| Characteristic | Number | Measure |
| Per Capita Income | 2,110,036 | $40,949 |
| Median Family Income | 527,516 | $98,008 |
| Mean Family Income | 527,516 | $12,259,254 |
| Median Household Income | 815,350 | $80,306 |
| Mean Household Income | 815,350 | $10,488,364 |
| Income Deficit | 527,516 | $10,726 |
| Wage / Income Gap (%) | 2,110,036 | 28.23% |
| Wage / Income Gap ($) | 2,110,036 | 71.77¢ per $1 |
| Gini / Inequality Index | 2,110,036 | 42.98 |
Earnings by Sex in Area Code 615
Average Earnings in Area Code 615 are $44,091, $52,399 for men and $37,380 for women, a difference of 28.7%.
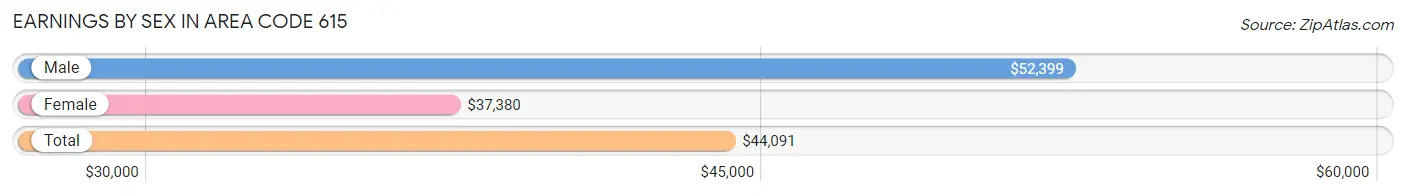
| Sex | Number | Average Earnings |
| Male | 630,876 (52.4%) | $52,399 |
| Female | 573,901 (47.6%) | $37,380 |
| Total | 1,204,777 (100.0%) | $44,091 |
Earnings by Sex by Income Bracket in Area Code 615
The most common earnings brackets in Area Code 615 are $100,000+ for men (123,812 | 19.6%) and $100,000+ for women (49,722 | 8.7%).
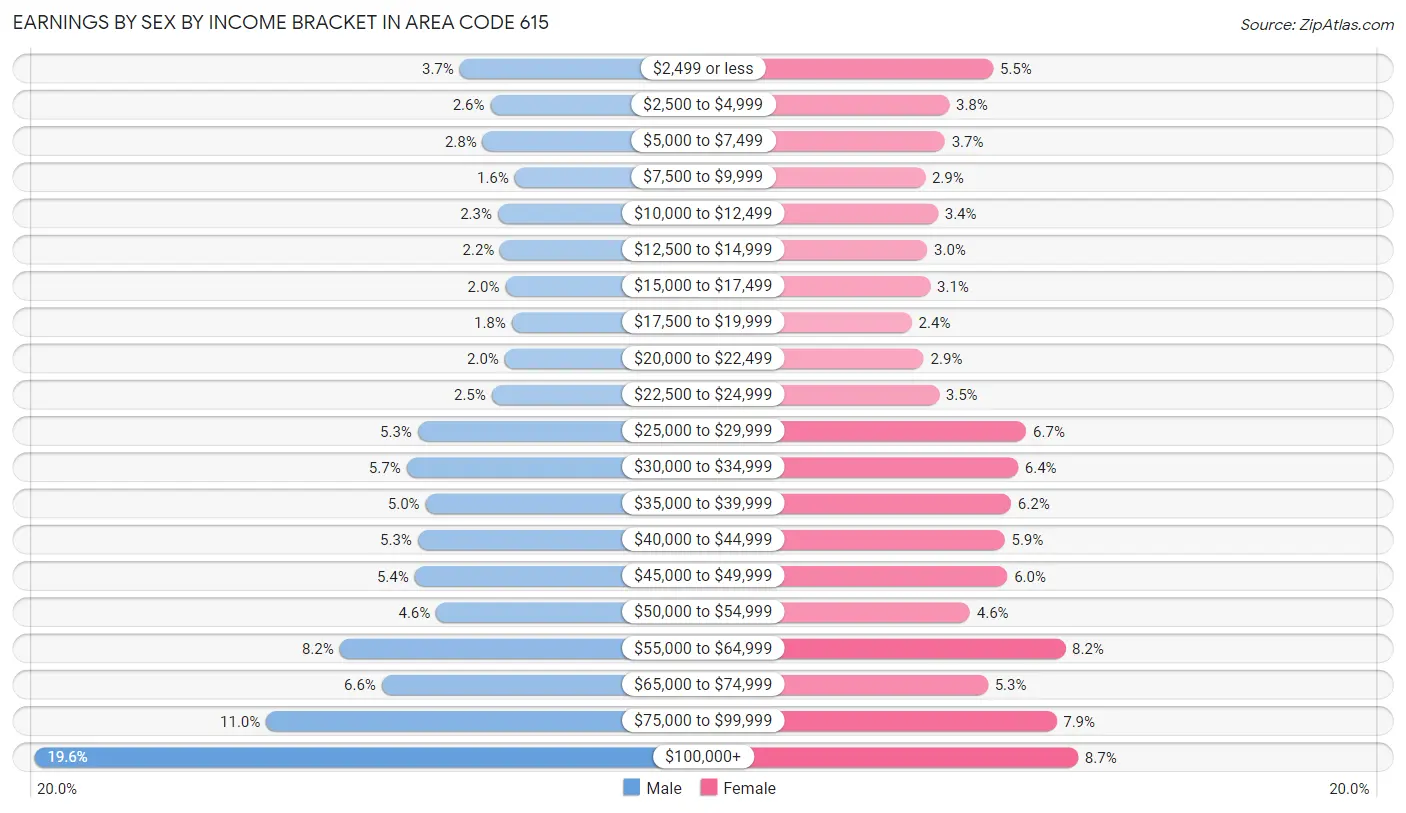
| Income | Male | Female |
| $2,499 or less | 23,343 (3.7%) | 31,440 (5.5%) |
| $2,500 to $4,999 | 16,077 (2.5%) | 22,009 (3.8%) |
| $5,000 to $7,499 | 17,922 (2.8%) | 21,047 (3.7%) |
| $7,500 to $9,999 | 10,363 (1.6%) | 16,830 (2.9%) |
| $10,000 to $12,499 | 14,315 (2.3%) | 19,582 (3.4%) |
| $12,500 to $14,999 | 13,726 (2.2%) | 17,254 (3.0%) |
| $15,000 to $17,499 | 12,581 (2.0%) | 17,921 (3.1%) |
| $17,500 to $19,999 | 11,065 (1.8%) | 13,933 (2.4%) |
| $20,000 to $22,499 | 12,670 (2.0%) | 16,516 (2.9%) |
| $22,500 to $24,999 | 15,752 (2.5%) | 19,777 (3.5%) |
| $25,000 to $29,999 | 33,240 (5.3%) | 38,558 (6.7%) |
| $30,000 to $34,999 | 35,874 (5.7%) | 36,813 (6.4%) |
| $35,000 to $39,999 | 31,398 (5.0%) | 35,317 (6.1%) |
| $40,000 to $44,999 | 33,270 (5.3%) | 33,898 (5.9%) |
| $45,000 to $49,999 | 34,021 (5.4%) | 34,482 (6.0%) |
| $50,000 to $54,999 | 28,878 (4.6%) | 26,481 (4.6%) |
| $55,000 to $64,999 | 51,759 (8.2%) | 46,968 (8.2%) |
| $65,000 to $74,999 | 41,748 (6.6%) | 30,313 (5.3%) |
| $75,000 to $99,999 | 69,062 (11.0%) | 45,040 (7.9%) |
| $100,000+ | 123,812 (19.6%) | 49,722 (8.7%) |
| Total | 630,876 (100.0%) | 573,901 (100.0%) |
Earnings by Sex by Educational Attainment in Area Code 615
Average earnings in Area Code 615 are $5,814,758 for men and $4,148,912 for women, a difference of 28.6%. Men with an educational attainment of graduate degree enjoy the highest average annual earnings of $7,003,097, while those with less than high school education earn the least with $3,021,760. Women with an educational attainment of graduate degree earn the most with the average annual earnings of $5,449,136, while those with less than high school education have the smallest earnings of $1,305,251.
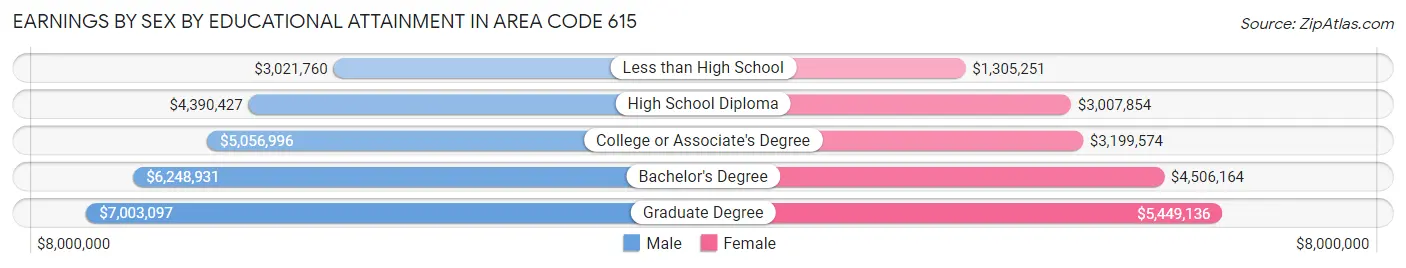
| Educational Attainment | Male Income | Female Income |
| Less than High School | $3,021,760 | $1,305,251 |
| High School Diploma | $4,390,427 | $3,007,854 |
| College or Associate's Degree | $5,056,996 | $3,199,574 |
| Bachelor's Degree | $6,248,931 | $4,506,164 |
| Graduate Degree | $7,003,097 | $5,449,136 |
| Total | $5,814,758 | $4,148,912 |
Family Income in Area Code 615
Family Income Brackets in Area Code 615
According to the Area Code 615 family income data, there are 11,424,414 families falling into the $100,000 to $149,999 income range, which is the most common income bracket and makes up 2,165.7% of all families. Conversely, the $10,000 to $14,999 income bracket is the least frequent group with only 895,195 families (169.7%) belonging to this category.
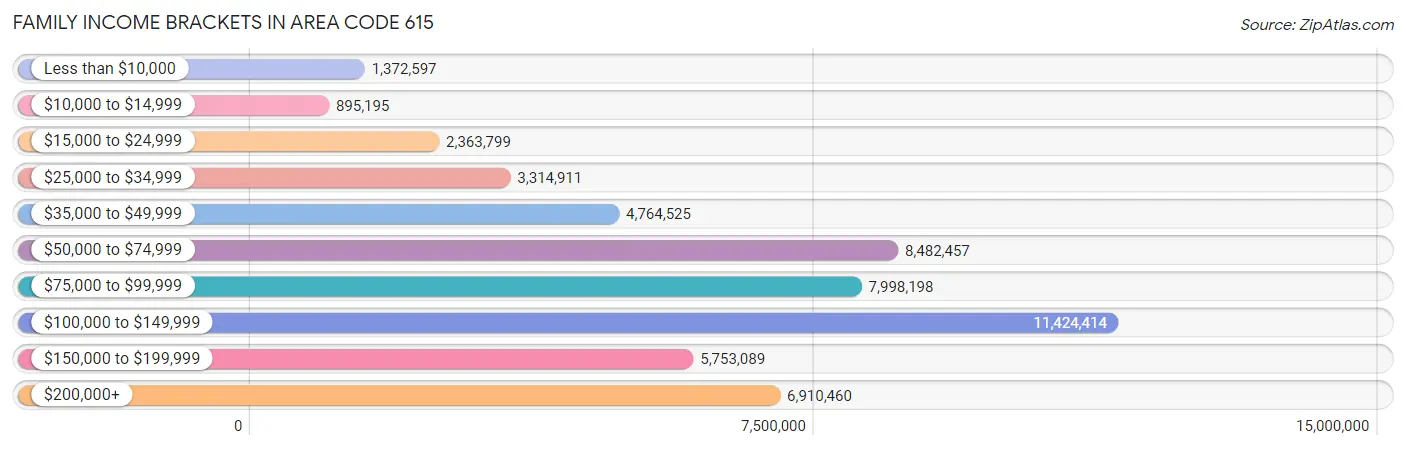
| Income Bracket | # Families | % Families |
| Less than $10,000 | 1,372,597 | 260.2% |
| $10,000 to $14,999 | 895,195 | 169.7% |
| $15,000 to $24,999 | 2,363,799 | 448.1% |
| $25,000 to $34,999 | 3,314,911 | 628.4% |
| $35,000 to $49,999 | 4,764,525 | 903.2% |
| $50,000 to $74,999 | 8,482,457 | 1,608.0% |
| $75,000 to $99,999 | 7,998,198 | 1,516.2% |
| $100,000 to $149,999 | 11,424,414 | 2,165.7% |
| $150,000 to $199,999 | 5,753,089 | 1,090.6% |
| $200,000+ | 6,910,460 | 1,310.0% |
Family Income by Famaliy Size in Area Code 615
7+ person families (7,396 | 1.4%) account for the highest median family income in Area Code 615 with $142,608 per family, while 2-person families (247,071 | 46.8%) have the highest median income of $45,148 per family member.
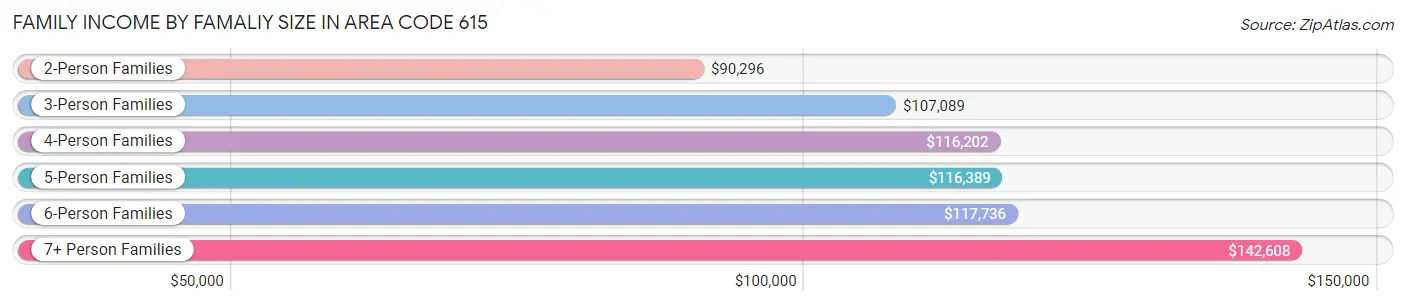
| Income Bracket | # Families | Median Income |
| 2-Person Families | 247,071 (46.8%) | $90,296 |
| 3-Person Families | 117,655 (22.3%) | $107,089 |
| 4-Person Families | 99,411 (18.9%) | $116,202 |
| 5-Person Families | 42,428 (8.0%) | $116,389 |
| 6-Person Families | 13,555 (2.6%) | $117,736 |
| 7+ Person Families | 7,396 (1.4%) | $142,608 |
| Total | 527,516 (100.0%) | $98,008 |
Family Income by Number of Earners in Area Code 615
The median family income in Area Code 615 is $98,008, with families comprising 3+ earners (59,226) having the highest median family income of $145,300, while families with no earners (61,040) have the lowest median family income of $51,398, accounting for 11.2% and 11.6% of families, respectively.
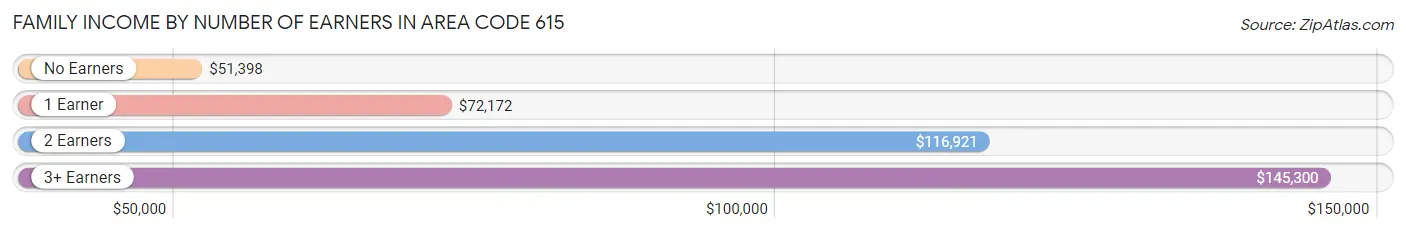
| Number of Earners | # Families | Median Income |
| No Earners | 61,040 (11.6%) | $51,398 |
| 1 Earner | 164,117 (31.1%) | $72,172 |
| 2 Earners | 243,133 (46.1%) | $116,921 |
| 3+ Earners | 59,226 (11.2%) | $145,300 |
| Total | 527,516 (100.0%) | $98,008 |
Household Income in Area Code 615
Household Income Brackets in Area Code 615
With 16,078,702 households falling in the category, the $100,000 to $149,999 income range is the most frequent in Area Code 615, accounting for 1,972.0% of all households. In contrast, only 2,632,765 households (322.9%) fall into the $10,000 to $14,999 income bracket, making it the least populous group.
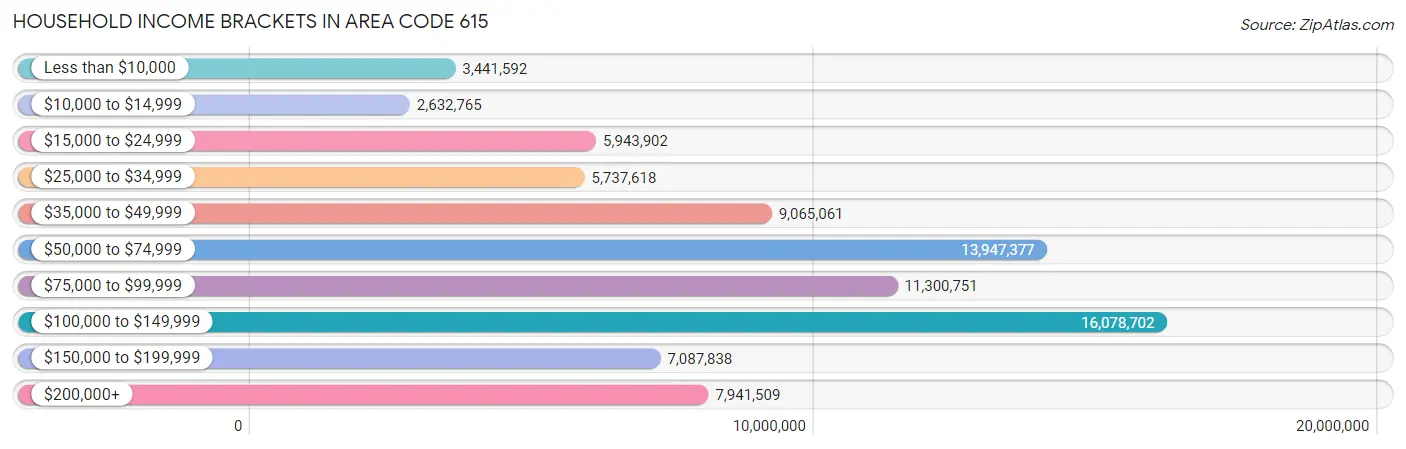
| Income Bracket | # Households | % Households |
| Less than $10,000 | 3,441,592 | 422.1% |
| $10,000 to $14,999 | 2,632,765 | 322.9% |
| $15,000 to $24,999 | 5,943,902 | 729.0% |
| $25,000 to $34,999 | 5,737,618 | 703.7% |
| $35,000 to $49,999 | 9,065,061 | 1,111.8% |
| $50,000 to $74,999 | 13,947,377 | 1,710.6% |
| $75,000 to $99,999 | 11,300,751 | 1,386.0% |
| $100,000 to $149,999 | 16,078,702 | 1,972.0% |
| $150,000 to $199,999 | 7,087,838 | 869.3% |
| $200,000+ | 7,941,509 | 974.0% |
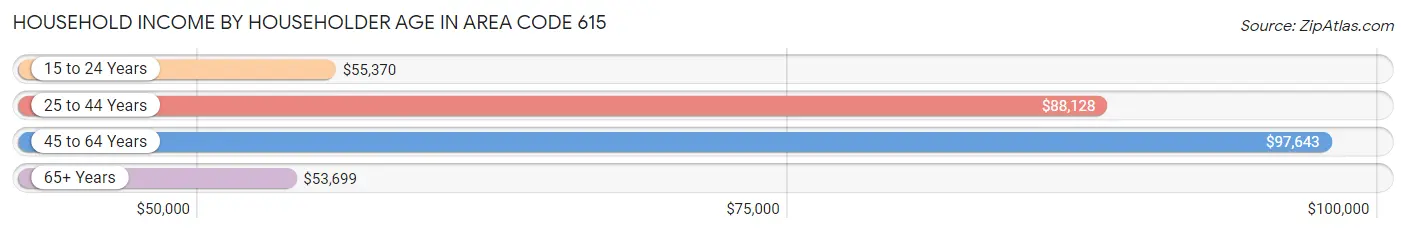
Household Income by Householder Age in Area Code 615
The median household income in Area Code 615 is $80,306, with the highest median household income of $97,643 found in the 45 to 64 years age bracket for the primary householder. A total of 292,010 households (35.8%) fall into this category. Meanwhile, the 65+ years age bracket for the primary householder has the lowest median household income of $53,699, with 177,926 households (21.8%) in this group.
| Income Bracket | # Households | Median Income |
| 15 to 24 Years | 35,826 (4.4%) | $55,370 |
| 25 to 44 Years | 309,588 (38.0%) | $88,128 |
| 45 to 64 Years | 292,010 (35.8%) | $97,643 |
| 65+ Years | 177,926 (21.8%) | $53,699 |
| Total | 815,350 (100.0%) | $80,306 |
Poverty in Area Code 615
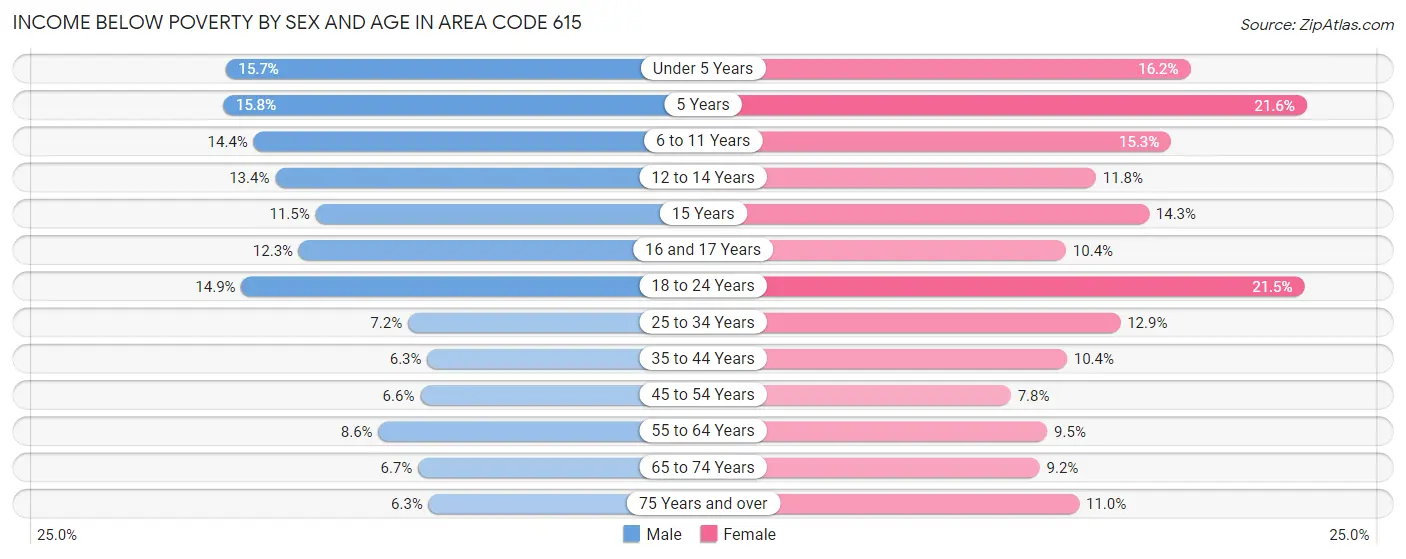
Income Below Poverty by Sex and Age in Area Code 615
With 9.5% poverty level for males and 12.2% for females among the residents of Area Code 615, 5 year old males and 5 year old females are the most vulnerable to poverty, with 1,916 males (15.8%) and 2,705 females (21.6%) in their respective age groups living below the poverty level.
| Age Bracket | Male | Female |
| Under 5 Years | 10,274 (15.7%) | 10,107 (16.2%) |
| 5 Years | 1,916 (15.8%) | 2,705 (21.6%) |
| 6 to 11 Years | 11,482 (14.4%) | 11,898 (15.3%) |
| 12 to 14 Years | 5,760 (13.4%) | 4,720 (11.8%) |
| 15 Years | 1,492 (11.5%) | 1,938 (14.2%) |
| 16 and 17 Years | 3,551 (12.3%) | 2,723 (10.4%) |
| 18 to 24 Years | 13,717 (14.9%) | 19,030 (21.5%) |
| 25 to 34 Years | 11,327 (7.2%) | 21,185 (12.9%) |
| 35 to 44 Years | 9,211 (6.3%) | 15,357 (10.4%) |
| 45 to 54 Years | 8,800 (6.6%) | 10,450 (7.8%) |
| 55 to 64 Years | 10,413 (8.6%) | 12,476 (9.5%) |
| 65 to 74 Years | 5,487 (6.7%) | 8,579 (9.2%) |
| 75 Years and over | 2,678 (6.2%) | 6,886 (11.0%) |
| Total | 96,108 (9.5%) | 128,054 (12.2%) |
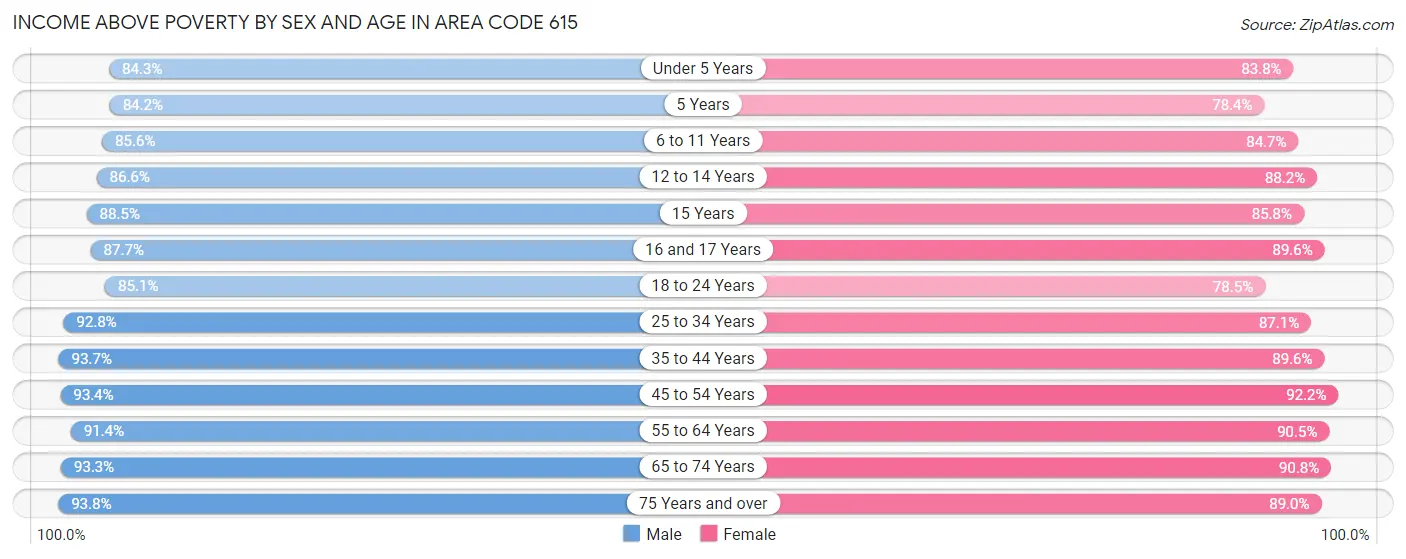
Income Above Poverty by Sex and Age in Area Code 615
According to the poverty statistics in Area Code 615, males aged 75 years and over and females aged 45 to 54 years are the age groups that are most secure financially, with 93.8% of males and 92.2% of females in these age groups living above the poverty line.
| Age Bracket | Male | Female |
| Under 5 Years | 55,241 (84.3%) | 52,386 (83.8%) |
| 5 Years | 10,209 (84.2%) | 9,838 (78.4%) |
| 6 to 11 Years | 68,411 (85.6%) | 65,956 (84.7%) |
| 12 to 14 Years | 37,320 (86.6%) | 35,308 (88.2%) |
| 15 Years | 11,483 (88.5%) | 11,658 (85.8%) |
| 16 and 17 Years | 25,382 (87.7%) | 23,448 (89.6%) |
| 18 to 24 Years | 78,080 (85.1%) | 69,664 (78.5%) |
| 25 to 34 Years | 145,762 (92.8%) | 142,780 (87.1%) |
| 35 to 44 Years | 136,650 (93.7%) | 131,806 (89.6%) |
| 45 to 54 Years | 123,671 (93.4%) | 122,891 (92.2%) |
| 55 to 64 Years | 110,982 (91.4%) | 118,436 (90.5%) |
| 65 to 74 Years | 75,935 (93.3%) | 84,916 (90.8%) |
| 75 Years and over | 40,148 (93.8%) | 55,651 (89.0%) |
| Total | 919,274 (90.5%) | 924,738 (87.8%) |
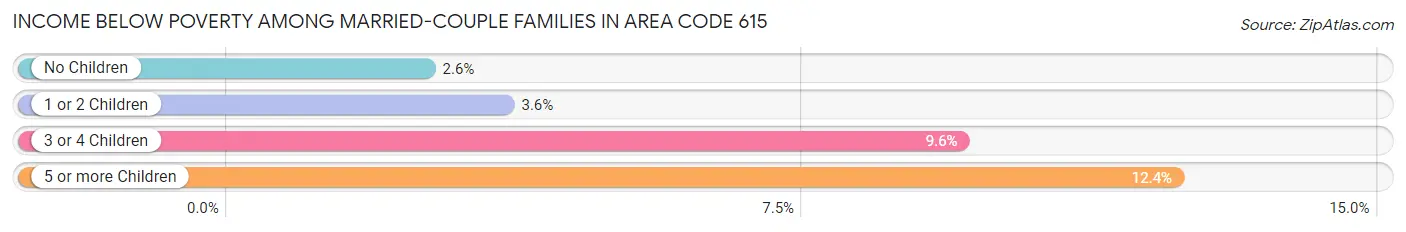
Income Below Poverty Among Married-Couple Families in Area Code 615
The poverty statistics for married-couple families in Area Code 615 show that 3.6% or 14,257 of the total 397,668 families live below the poverty line. Families with 5 or more children have the highest poverty rate of 12.3%, comprising of 317 families. On the other hand, families with no children have the lowest poverty rate of 2.6%, which includes 5,763 families.
| Children | Above Poverty | Below Poverty |
| No Children | 217,248 (97.4%) | 5,763 (2.6%) |
| 1 or 2 Children | 133,890 (96.4%) | 5,008 (3.6%) |
| 3 or 4 Children | 30,023 (90.4%) | 3,169 (9.6%) |
| 5 or more Children | 2,250 (87.6%) | 317 (12.3%) |
| Total | 383,411 (96.4%) | 14,257 (3.6%) |
Income Below Poverty Among Single-Parent Households in Area Code 615
According to the poverty data in Area Code 615, 9.1% or 3,393 single-father households and 23.7% or 21,950 single-mother households are living below the poverty line. Among single-father households, those with 5 or more children have the highest poverty rate, with 62 households (27.3%) experiencing poverty. Likewise, among single-mother households, those with 5 or more children have the highest poverty rate, with 619 households (82.2%) falling below the poverty line.
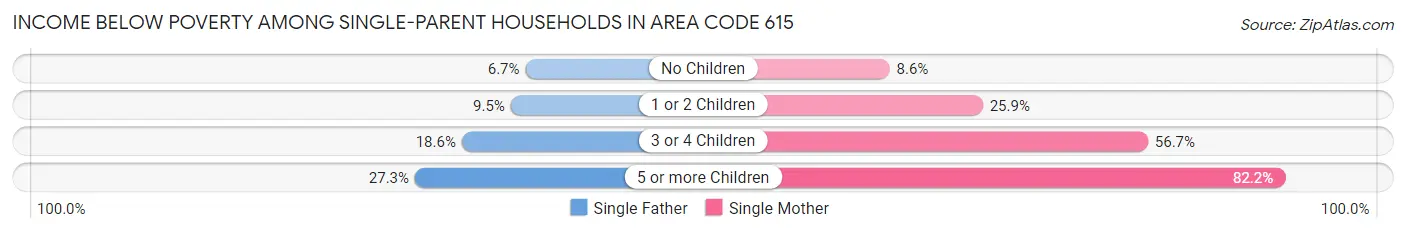
| Children | Single Father | Single Mother |
| No Children | 1,110 (6.7%) | 2,744 (8.6%) |
| 1 or 2 Children | 1,652 (9.5%) | 12,858 (25.9%) |
| 3 or 4 Children | 569 (18.6%) | 5,729 (56.7%) |
| 5 or more Children | 62 (27.3%) | 619 (82.2%) |
| Total | 3,393 (9.1%) | 21,950 (23.7%) |
Income Below Poverty Among Married-Couple vs Single-Parent Households in Area Code 615
The poverty data for Area Code 615 shows that 14,257 of the married-couple family households (3.6%) and 25,343 of the single-parent households (19.5%) are living below the poverty level. Within the married-couple family households, those with 5 or more children have the highest poverty rate, with 317 households (12.3%) falling below the poverty line. Among the single-parent households, those with 5 or more children have the highest poverty rate, with 681 household (69.5%) living below poverty.
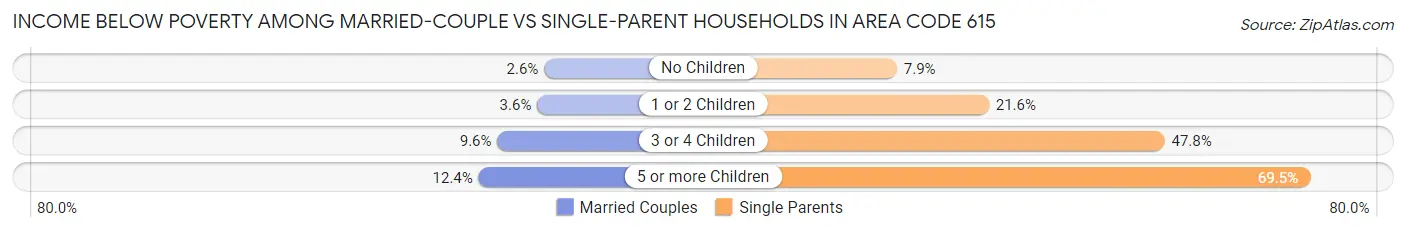
| Children | Married-Couple Families | Single-Parent Households |
| No Children | 5,763 (2.6%) | 3,854 (7.9%) |
| 1 or 2 Children | 5,008 (3.6%) | 14,510 (21.6%) |
| 3 or 4 Children | 3,169 (9.6%) | 6,298 (47.8%) |
| 5 or more Children | 317 (12.3%) | 681 (69.5%) |
| Total | 14,257 (3.6%) | 25,343 (19.5%) |
Race in Area Code 615
The most populous races in Area Code 615 are White / Caucasian (1,546,712 | 73.3%), Black / African American (317,486 | 15.0%), and Hispanic or Latino (167,217 | 7.9%).
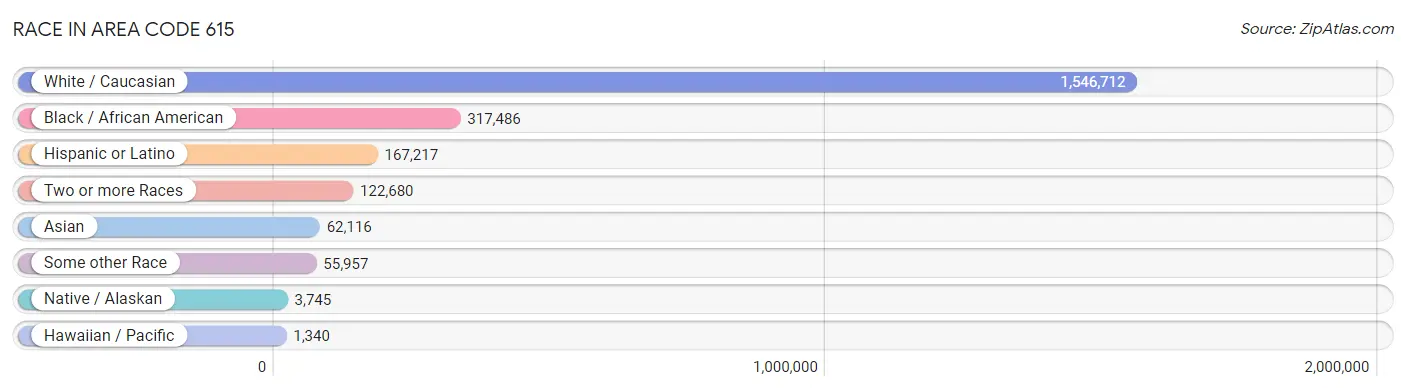
| Race | # Population | % Population |
| Asian | 62,116 | 2.9% |
| Black / African American | 317,486 | 15.0% |
| Hawaiian / Pacific | 1,340 | 0.1% |
| Hispanic or Latino | 167,217 | 7.9% |
| Native / Alaskan | 3,745 | 0.2% |
| White / Caucasian | 1,546,712 | 73.3% |
| Two or more Races | 122,680 | 5.8% |
| Some other Race | 55,957 | 2.6% |
| Total | 2,110,036 | 100.0% |
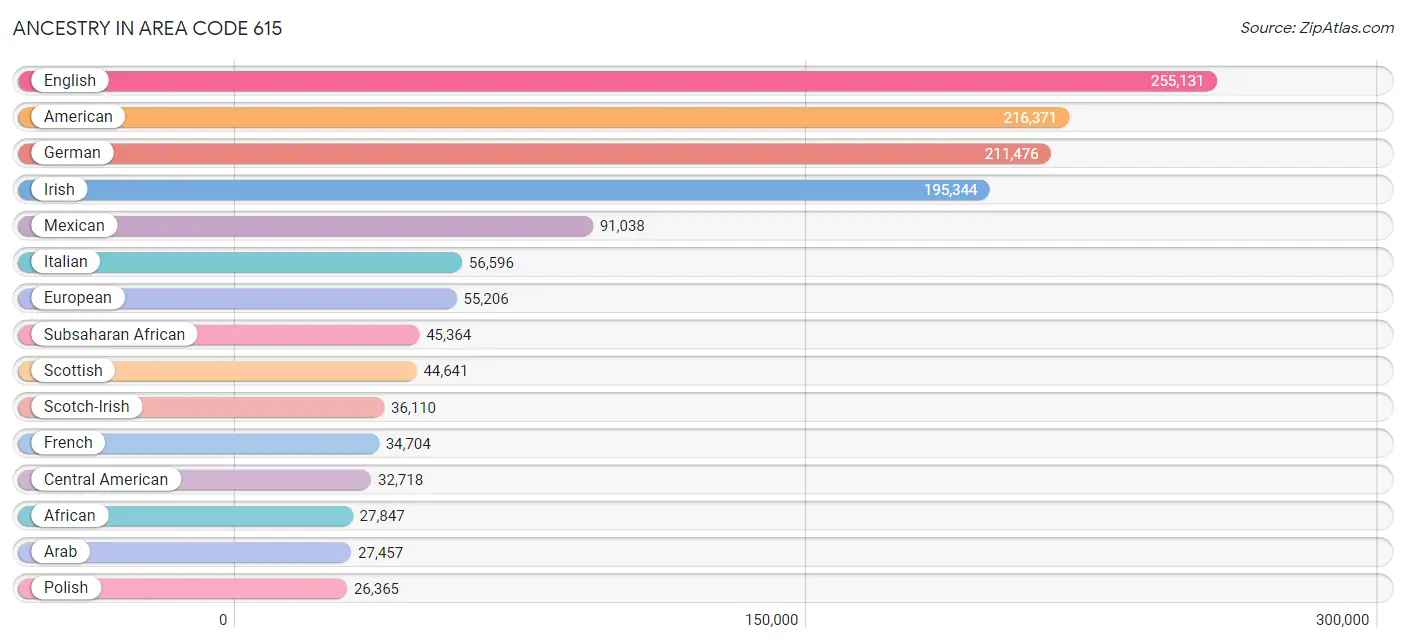
Ancestry in Area Code 615
The most populous ancestries reported in Area Code 615 are English (255,131 | 12.1%), American (216,371 | 10.2%), German (211,476 | 10.0%), Irish (195,344 | 9.3%), and Mexican (91,038 | 4.3%), together accounting for 45.9% of all Area Code 615 residents.
| Ancestry | # Population | % Population |
| Afghan | 1,285 | 0.1% |
| African | 27,847 | 1.3% |
| Alaska Native | 110 | 0.0% |
| Alaskan Athabascan | 13 | 0.0% |
| Albanian | 1,169 | 0.1% |
| Aleut | 58 | 0.0% |
| Alsatian | 24 | 0.0% |
| American | 216,371 | 10.2% |
| Apache | 277 | 0.0% |
| Arab | 27,457 | 1.3% |
| Argentinean | 798 | 0.0% |
| Armenian | 943 | 0.0% |
| Assyrian / Chaldean / Syriac | 9 | 0.0% |
| Australian | 614 | 0.0% |
| Austrian | 2,930 | 0.1% |
| Bahamian | 201 | 0.0% |
| Bangladeshi | 284 | 0.0% |
| Barbadian | 10 | 0.0% |
| Basque | 67 | 0.0% |
| Belgian | 1,064 | 0.1% |
| Belizean | 366 | 0.0% |
| Bermudan | 8 | 0.0% |
| Bhutanese | 4,187 | 0.2% |
| Blackfeet | 887 | 0.0% |
| Bolivian | 186 | 0.0% |
| Brazilian | 1,564 | 0.1% |
| British | 15,165 | 0.7% |
| British West Indian | 503 | 0.0% |
| Bulgarian | 696 | 0.0% |
| Burmese | 8,547 | 0.4% |
| Cajun | 409 | 0.0% |
| Cambodian | 124 | 0.0% |
| Canadian | 2,752 | 0.1% |
| Cape Verdean | 73 | 0.0% |
| Carpatho Rusyn | 26 | 0.0% |
| Celtic | 397 | 0.0% |
| Central American | 32,718 | 1.5% |
| Central American Indian | 689 | 0.0% |
| Cherokee | 9,011 | 0.4% |
| Cheyenne | 52 | 0.0% |
| Chickasaw | 159 | 0.0% |
| Chilean | 592 | 0.0% |
| Chinese | 23 | 0.0% |
| Chippewa | 249 | 0.0% |
| Choctaw | 702 | 0.0% |
| Colombian | 3,693 | 0.2% |
| Comanche | 128 | 0.0% |
| Costa Rican | 786 | 0.0% |
| Creek | 261 | 0.0% |
| Croatian | 1,481 | 0.1% |
| Crow | 43 | 0.0% |
| Cuban | 6,314 | 0.3% |
| Cypriot | 10 | 0.0% |
| Czech | 3,331 | 0.2% |
| Czechoslovakian | 824 | 0.0% |
| Danish | 4,252 | 0.2% |
| Delaware | 21 | 0.0% |
| Dominican | 1,403 | 0.1% |
| Dutch | 16,796 | 0.8% |
| Dutch West Indian | 67 | 0.0% |
| Eastern European | 3,993 | 0.2% |
| Ecuadorian | 1,027 | 0.1% |
| Egyptian | 11,271 | 0.5% |
| English | 255,131 | 12.1% |
| Estonian | 44 | 0.0% |
| Ethiopian | 3,709 | 0.2% |
| European | 55,206 | 2.6% |
| Fijian | 41 | 0.0% |
| Filipino | 371 | 0.0% |
| Finnish | 2,399 | 0.1% |
| French | 34,704 | 1.6% |
| French American Indian | 101 | 0.0% |
| French Canadian | 5,398 | 0.3% |
| German | 211,476 | 10.0% |
| German Russian | 35 | 0.0% |
| Ghanaian | 1,028 | 0.1% |
| Greek | 5,390 | 0.3% |
| Guamanian / Chamorro | 513 | 0.0% |
| Guatemalan | 9,101 | 0.4% |
| Guyanese | 168 | 0.0% |
| Haitian | 1,764 | 0.1% |
| Honduran | 11,848 | 0.6% |
| Houma | 12 | 0.0% |
| Hungarian | 4,370 | 0.2% |
| Icelander | 318 | 0.0% |
| Indian (Asian) | 10,775 | 0.5% |
| Indonesian | 3,424 | 0.2% |
| Inupiat | 101 | 0.0% |
| Iranian | 2,313 | 0.1% |
| Iraqi | 2,740 | 0.1% |
| Irish | 195,344 | 9.3% |
| Iroquois | 265 | 0.0% |
| Israeli | 162 | 0.0% |
| Italian | 56,596 | 2.7% |
| Jamaican | 2,669 | 0.1% |
| Japanese | 1,434 | 0.1% |
| Jordanian | 204 | 0.0% |
| Kenyan | 377 | 0.0% |
| Korean | 10,155 | 0.5% |
| Laotian | 310 | 0.0% |
| Latvian | 854 | 0.0% |
| Lebanese | 2,747 | 0.1% |
| Liberian | 357 | 0.0% |
| Lithuanian | 2,137 | 0.1% |
| Lumbee | 83 | 0.0% |
| Luxembourger | 82 | 0.0% |
| Macedonian | 179 | 0.0% |
| Malaysian | 7,996 | 0.4% |
| Maltese | 111 | 0.0% |
| Mexican | 91,038 | 4.3% |
| Mexican American Indian | 822 | 0.0% |
| Mongolian | 465 | 0.0% |
| Moroccan | 331 | 0.0% |
| Native Hawaiian | 1,478 | 0.1% |
| Navajo | 348 | 0.0% |
| New Zealander | 70 | 0.0% |
| Nicaraguan | 723 | 0.0% |
| Nigerian | 4,005 | 0.2% |
| Northern European | 2,394 | 0.1% |
| Norwegian | 12,697 | 0.6% |
| Okinawan | 5 | 0.0% |
| Osage | 68 | 0.0% |
| Ottawa | 3 | 0.0% |
| Paiute | 2 | 0.0% |
| Pakistani | 2,243 | 0.1% |
| Palestinian | 983 | 0.1% |
| Panamanian | 872 | 0.0% |
| Paraguayan | 92 | 0.0% |
| Pennsylvania German | 275 | 0.0% |
| Peruvian | 1,690 | 0.1% |
| Polish | 26,365 | 1.3% |
| Portuguese | 2,141 | 0.1% |
| Potawatomi | 152 | 0.0% |
| Pueblo | 26 | 0.0% |
| Puerto Rican | 14,489 | 0.7% |
| Romanian | 1,974 | 0.1% |
| Russian | 7,418 | 0.4% |
| Salvadoran | 9,314 | 0.4% |
| Samoan | 1,036 | 0.1% |
| Scandinavian | 5,893 | 0.3% |
| Scotch-Irish | 36,110 | 1.7% |
| Scottish | 44,641 | 2.1% |
| Seminole | 99 | 0.0% |
| Senegalese | 173 | 0.0% |
| Serbian | 644 | 0.0% |
| Shoshone | 24 | 0.0% |
| Sierra Leonean | 11 | 0.0% |
| Sioux | 231 | 0.0% |
| Slavic | 694 | 0.0% |
| Slovak | 1,241 | 0.1% |
| Slovene | 885 | 0.0% |
| Somali | 1,155 | 0.1% |
| South African | 577 | 0.0% |
| South American | 11,362 | 0.5% |
| South American Indian | 226 | 0.0% |
| Spaniard | 1,972 | 0.1% |
| Spanish | 2,275 | 0.1% |
| Spanish American | 298 | 0.0% |
| Sri Lankan | 5,267 | 0.3% |
| Subsaharan African | 45,364 | 2.1% |
| Sudanese | 2,419 | 0.1% |
| Swedish | 12,005 | 0.6% |
| Swiss | 3,967 | 0.2% |
| Syrian | 509 | 0.0% |
| Thai | 17,829 | 0.8% |
| Tlingit-Haida | 92 | 0.0% |
| Tongan | 39 | 0.0% |
| Trinidadian and Tobagonian | 319 | 0.0% |
| Turkish | 795 | 0.0% |
| U.S. Virgin Islander | 119 | 0.0% |
| Ugandan | 119 | 0.0% |
| Ukrainian | 2,593 | 0.1% |
| Uruguayan | 141 | 0.0% |
| Venezuelan | 2,899 | 0.1% |
| Vietnamese | 301 | 0.0% |
| Welsh | 12,657 | 0.6% |
| West Indian | 918 | 0.0% |
| Yaqui | 176 | 0.0% |
| Yugoslavian | 947 | 0.0% |
| Yup'ik | 7 | 0.0% |
| Zimbabwean | 29 | 0.0% | View All 181 Rows |
Immigrants in Area Code 615
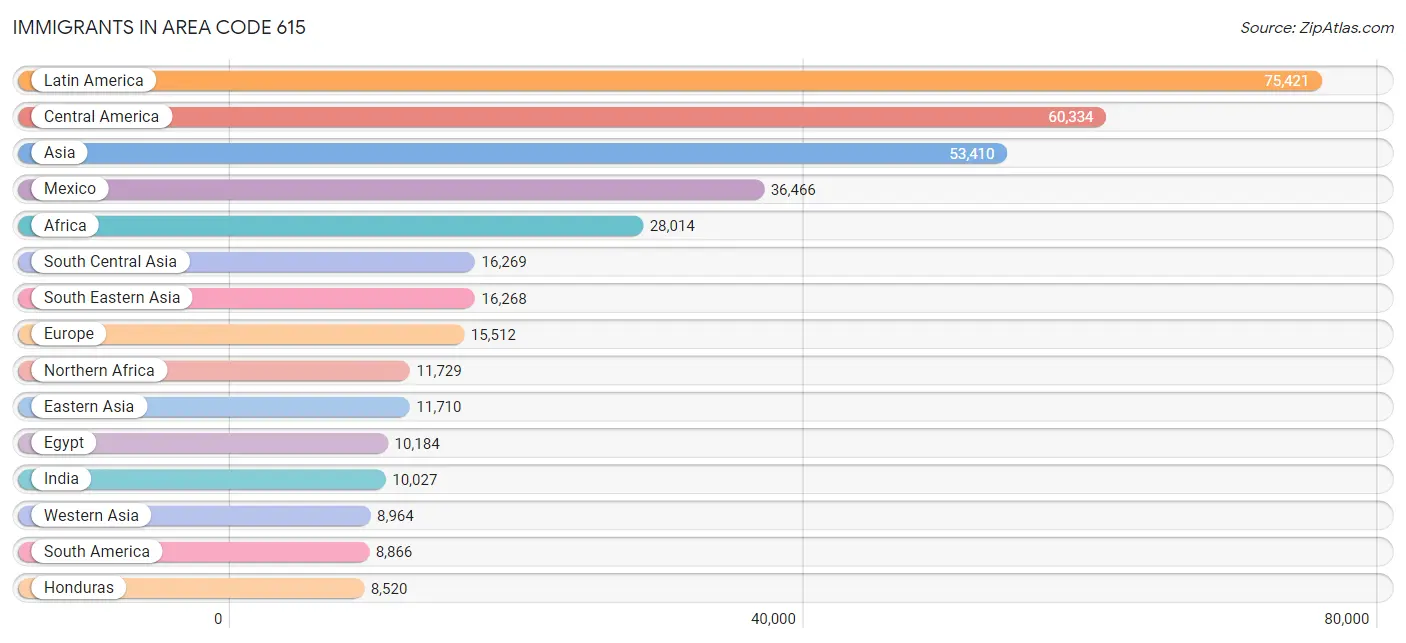
The most numerous immigrant groups reported in Area Code 615 came from Latin America (75,421 | 3.6%), Central America (60,334 | 2.9%), Asia (53,410 | 2.5%), Mexico (36,466 | 1.7%), and Africa (28,014 | 1.3%), together accounting for 12.0% of all Area Code 615 residents.
| Immigration Origin | # Population | % Population |
| Afghanistan | 1,133 | 0.1% |
| Africa | 28,014 | 1.3% |
| Albania | 398 | 0.0% |
| Argentina | 353 | 0.0% |
| Armenia | 1 | 0.0% |
| Asia | 53,410 | 2.5% |
| Australia | 520 | 0.0% |
| Austria | 149 | 0.0% |
| Bahamas | 203 | 0.0% |
| Bangladesh | 413 | 0.0% |
| Barbados | 10 | 0.0% |
| Belarus | 63 | 0.0% |
| Belgium | 133 | 0.0% |
| Belize | 185 | 0.0% |
| Bolivia | 107 | 0.0% |
| Bosnia and Herzegovina | 528 | 0.0% |
| Brazil | 1,505 | 0.1% |
| Bulgaria | 445 | 0.0% |
| Cambodia | 338 | 0.0% |
| Cameroon | 469 | 0.0% |
| Canada | 5,542 | 0.3% |
| Caribbean | 6,221 | 0.3% |
| Central America | 60,334 | 2.9% |
| Chile | 363 | 0.0% |
| China | 5,693 | 0.3% |
| Colombia | 1,991 | 0.1% |
| Congo | 579 | 0.0% |
| Costa Rica | 672 | 0.0% |
| Croatia | 202 | 0.0% |
| Cuba | 2,618 | 0.1% |
| Czechoslovakia | 184 | 0.0% |
| Denmark | 72 | 0.0% |
| Dominica | 29 | 0.0% |
| Dominican Republic | 747 | 0.0% |
| Eastern Africa | 7,390 | 0.4% |
| Eastern Asia | 11,710 | 0.5% |
| Eastern Europe | 5,735 | 0.3% |
| Ecuador | 268 | 0.0% |
| Egypt | 10,184 | 0.5% |
| El Salvador | 6,466 | 0.3% |
| England | 1,480 | 0.1% |
| Eritrea | 285 | 0.0% |
| Ethiopia | 3,672 | 0.2% |
| Europe | 15,512 | 0.7% |
| Fiji | 15 | 0.0% |
| France | 1,075 | 0.1% |
| Germany | 2,847 | 0.1% |
| Ghana | 1,055 | 0.1% |
| Greece | 339 | 0.0% |
| Grenada | 56 | 0.0% |
| Guatemala | 7,266 | 0.3% |
| Guyana | 266 | 0.0% |
| Haiti | 637 | 0.0% |
| Honduras | 8,520 | 0.4% |
| Hong Kong | 74 | 0.0% |
| Hungary | 114 | 0.0% |
| India | 10,027 | 0.5% |
| Indonesia | 284 | 0.0% |
| Iran | 1,525 | 0.1% |
| Iraq | 5,808 | 0.3% |
| Ireland | 298 | 0.0% |
| Israel | 302 | 0.0% |
| Italy | 599 | 0.0% |
| Jamaica | 1,234 | 0.1% |
| Japan | 1,685 | 0.1% |
| Jordan | 401 | 0.0% |
| Kazakhstan | 83 | 0.0% |
| Kenya | 404 | 0.0% |
| Korea | 4,263 | 0.2% |
| Kuwait | 498 | 0.0% |
| Laos | 3,672 | 0.2% |
| Latin America | 75,421 | 3.6% |
| Latvia | 44 | 0.0% |
| Lebanon | 271 | 0.0% |
| Liberia | 300 | 0.0% |
| Lithuania | 16 | 0.0% |
| Malaysia | 630 | 0.0% |
| Mexico | 36,466 | 1.7% |
| Middle Africa | 2,609 | 0.1% |
| Moldova | 85 | 0.0% |
| Morocco | 174 | 0.0% |
| Nepal | 952 | 0.1% |
| Netherlands | 132 | 0.0% |
| Nicaragua | 382 | 0.0% |
| Nigeria | 2,383 | 0.1% |
| North Macedonia | 8 | 0.0% |
| Northern Africa | 11,729 | 0.6% |
| Northern Europe | 4,044 | 0.2% |
| Oceania | 818 | 0.0% |
| Pakistan | 580 | 0.0% |
| Panama | 377 | 0.0% |
| Peru | 1,102 | 0.1% |
| Philippines | 4,134 | 0.2% |
| Poland | 620 | 0.0% |
| Portugal | 80 | 0.0% |
| Romania | 743 | 0.0% |
| Russia | 958 | 0.1% |
| Saudi Arabia | 142 | 0.0% |
| Scotland | 250 | 0.0% |
| Senegal | 129 | 0.0% |
| Serbia | 101 | 0.0% |
| Sierra Leone | 45 | 0.0% |
| Singapore | 75 | 0.0% |
| Somalia | 1,277 | 0.1% |
| South Africa | 867 | 0.0% |
| South America | 8,866 | 0.4% |
| South Central Asia | 16,269 | 0.8% |
| South Eastern Asia | 16,268 | 0.8% |
| Southern Europe | 1,307 | 0.1% |
| Spain | 289 | 0.0% |
| Sri Lanka | 119 | 0.0% |
| St. Vincent and the Grenadines | 22 | 0.0% |
| Sudan | 1,140 | 0.1% |
| Sweden | 168 | 0.0% |
| Switzerland | 70 | 0.0% |
| Syria | 254 | 0.0% |
| Taiwan | 306 | 0.0% |
| Thailand | 2,177 | 0.1% |
| Trinidad and Tobago | 443 | 0.0% |
| Turkey | 631 | 0.0% |
| Uganda | 112 | 0.0% |
| Ukraine | 460 | 0.0% |
| Uruguay | 71 | 0.0% |
| Uzbekistan | 609 | 0.0% |
| Venezuela | 2,813 | 0.1% |
| Vietnam | 2,620 | 0.1% |
| West Indies | 11 | 0.0% |
| Western Africa | 4,288 | 0.2% |
| Western Asia | 8,964 | 0.4% |
| Western Europe | 4,406 | 0.2% |
| Yemen | 401 | 0.0% |
| Zaire | 1,498 | 0.1% |
| Zimbabwe | 85 | 0.0% | View All 133 Rows |
Sex and Age in Area Code 615
Sex and Age in Area Code 615
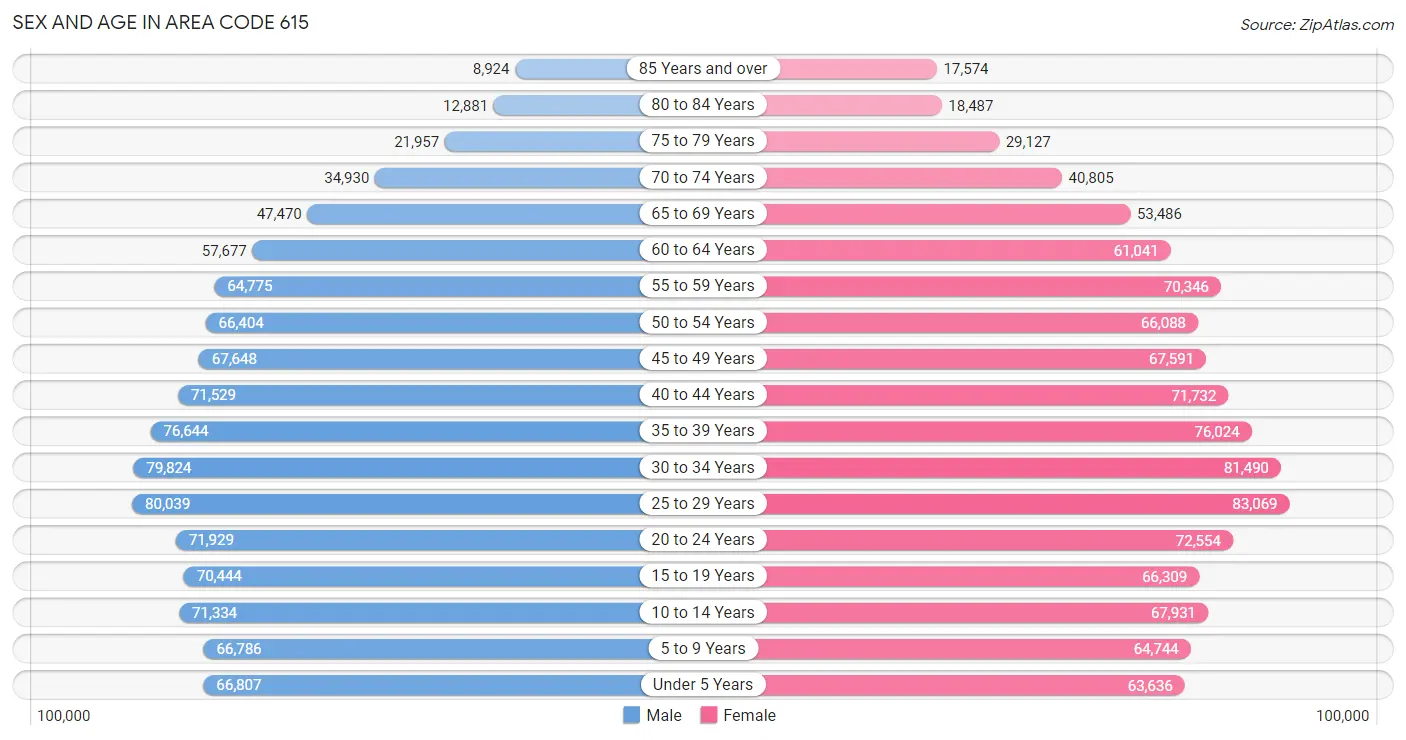
The most populous age groups in Area Code 615 are 25 to 29 Years (80,039 | 7.7%) for men and 25 to 29 Years (83,069 | 7.7%) for women.
| Age Bracket | Male | Female |
| Under 5 Years | 66,807 (6.4%) | 63,636 (5.9%) |
| 5 to 9 Years | 66,786 (6.4%) | 64,744 (6.0%) |
| 10 to 14 Years | 71,334 (6.9%) | 67,931 (6.3%) |
| 15 to 19 Years | 70,444 (6.8%) | 66,309 (6.2%) |
| 20 to 24 Years | 71,929 (6.9%) | 72,554 (6.8%) |
| 25 to 29 Years | 80,039 (7.7%) | 83,069 (7.7%) |
| 30 to 34 Years | 79,824 (7.7%) | 81,490 (7.6%) |
| 35 to 39 Years | 76,644 (7.4%) | 76,024 (7.1%) |
| 40 to 44 Years | 71,529 (6.9%) | 71,732 (6.7%) |
| 45 to 49 Years | 67,648 (6.5%) | 67,591 (6.3%) |
| 50 to 54 Years | 66,404 (6.4%) | 66,088 (6.2%) |
| 55 to 59 Years | 64,775 (6.2%) | 70,346 (6.6%) |
| 60 to 64 Years | 57,677 (5.6%) | 61,041 (5.7%) |
| 65 to 69 Years | 47,470 (4.6%) | 53,486 (5.0%) |
| 70 to 74 Years | 34,930 (3.4%) | 40,805 (3.8%) |
| 75 to 79 Years | 21,957 (2.1%) | 29,127 (2.7%) |
| 80 to 84 Years | 12,881 (1.2%) | 18,487 (1.7%) |
| 85 Years and over | 8,924 (0.9%) | 17,574 (1.6%) |
| Total | 1,038,002 (100.0%) | 1,072,034 (100.0%) |
Families and Households in Area Code 615
Median Family Size in Area Code 615
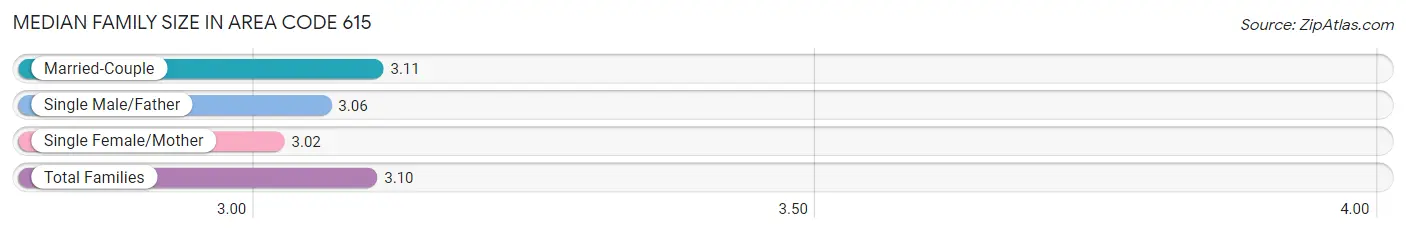
The median family size in Area Code 615 is 3.10 persons per family, with married-couple families (397,668 | 75.4%) accounting for the largest median family size of 3.10524 persons per family. On the other hand, single female/mother families (92,601 | 17.5%) represent the smallest median family size with 3.02 persons per family.
| Family Type | # Families | Family Size |
| Married-Couple | 397,668 (75.4%) | 3.11 |
| Single Male/Father | 37,247 (7.1%) | 3.06 |
| Single Female/Mother | 92,601 (17.5%) | 3.02 |
| Total Families | 527,516 (100.0%) | 3.10 |
Median Household Size in Area Code 615
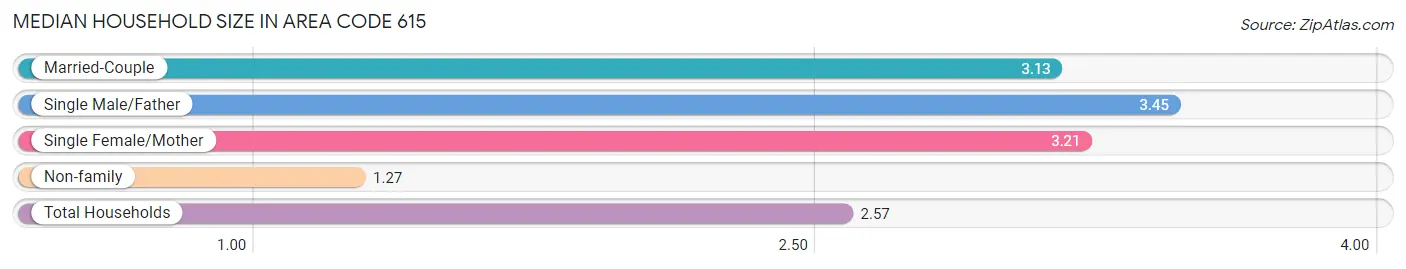
The median household size in Area Code 615 is 2.57 persons per household, with single male/father households (37,247 | 4.6%) accounting for the largest median household size of 3.4477 persons per household. non-family households (287,834 | 35.3%) represent the smallest median household size with 1.27 persons per household.
| Household Type | # Households | Household Size |
| Married-Couple | 397,668 (48.8%) | 3.13 |
| Single Male/Father | 37,247 (4.6%) | 3.45 |
| Single Female/Mother | 92,601 (11.4%) | 3.21 |
| Non-family | 287,834 (35.3%) | 1.27 |
| Total Households | 815,350 (100.0%) | 2.57 |
Household Size by Marriage Status in Area Code 615
Out of a total of 815,350 households in Area Code 615, 527,516 (64.7%) are family households, while 287,834 (35.3%) are nonfamily households. The most numerous type of family households are 2-person households, comprising 230,381, and the most common type of nonfamily households are 1-person households, comprising 223,932.
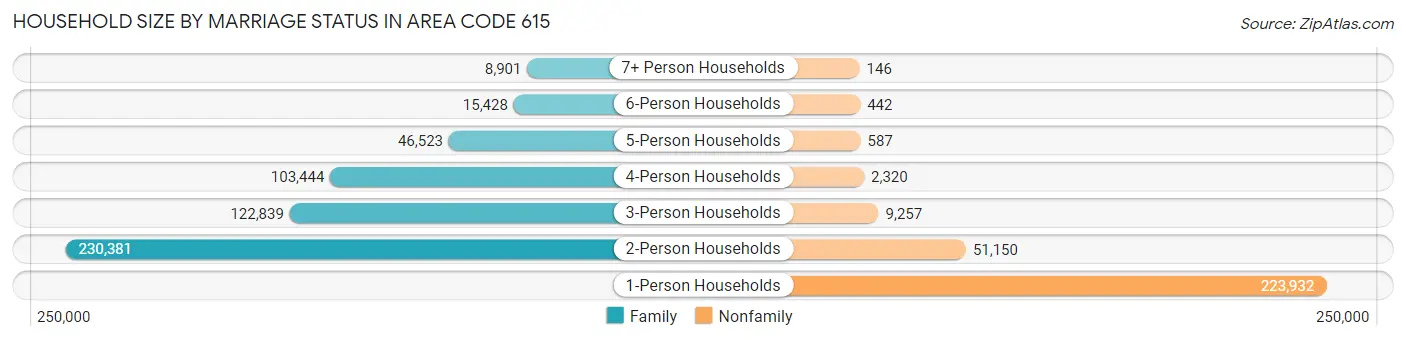
| Household Size | Family Households | Nonfamily Households |
| 1-Person Households | - | 223,932 (27.5%) |
| 2-Person Households | 230,381 (28.3%) | 51,150 (6.3%) |
| 3-Person Households | 122,839 (15.1%) | 9,257 (1.1%) |
| 4-Person Households | 103,444 (12.7%) | 2,320 (0.3%) |
| 5-Person Households | 46,523 (5.7%) | 587 (0.1%) |
| 6-Person Households | 15,428 (1.9%) | 442 (0.1%) |
| 7+ Person Households | 8,901 (1.1%) | 146 (0.0%) |
| Total | 527,516 (64.7%) | 287,834 (35.3%) |
Female Fertility in Area Code 615
Fertility by Age in Area Code 615
Average fertility rate in Area Code 615 is 62.1 births per 1,000 women. Women in the age bracket of 20 to 34 years have the highest fertility rate with 112.1 births per 1,000 women. Women in the age bracket of 20 to 34 years acount for 74.2% of all women with births.
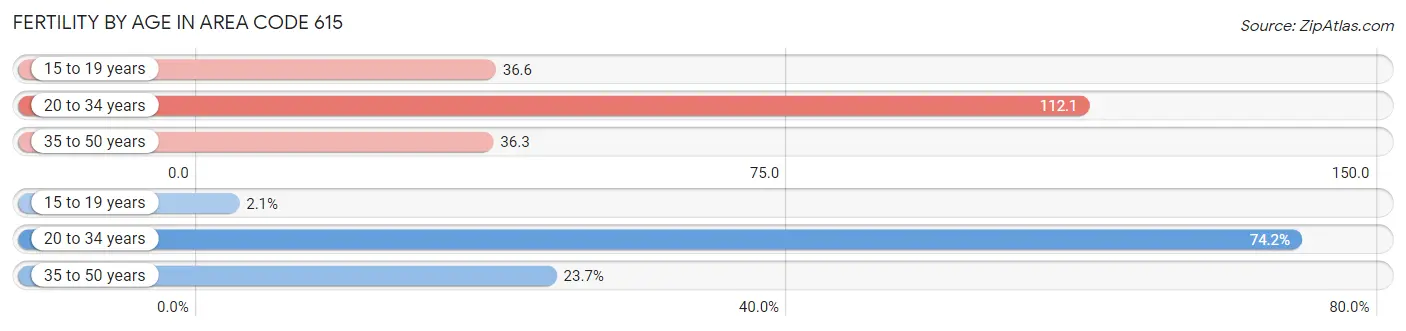
| Age Bracket | Women with Births | Births / 1,000 Women |
| 15 to 19 years | 624 (2.1%) | 36.6 |
| 20 to 34 years | 21,870 (74.2%) | 112.1 |
| 35 to 50 years | 6,970 (23.7%) | 36.3 |
| Total | 29,464 (100.0%) | 62.1 |
Fertility by Age by Marriage Status in Area Code 615
63.2% of women with births (29,464) in Area Code 615 are married. The highest percentage of unmarried women with births falls into 15 to 19 years age bracket with 94.6% of them unmarried at the time of birth, while the lowest percentage of unmarried women with births belong to 20 to 34 years age bracket with 39.4% of them unmarried.
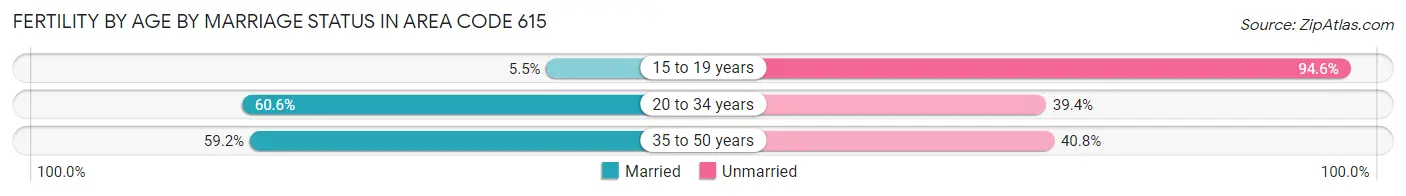
| Age Bracket | Married | Unmarried |
| 15 to 19 years | 34 (5.4%) | 590 (94.6%) |
| 20 to 34 years | 13,261 (60.6%) | 8,609 (39.4%) |
| 35 to 50 years | 4,124 (59.2%) | 2,846 (40.8%) |
| Total | 18,626 (63.2%) | 10,838 (36.8%) |
Fertility by Education in Area Code 615
Average fertility rate in Area Code 615 is 62.1 births per 1,000 women. Women with the education attainment of graduate degree have the highest fertility rate of 138.8 births per 1,000 women, while women with the education attainment of less than high school have the lowest fertility at 57.2 births per 1,000 women. Women with the education attainment of college or associate's degree represent 27.6% of all women with births.
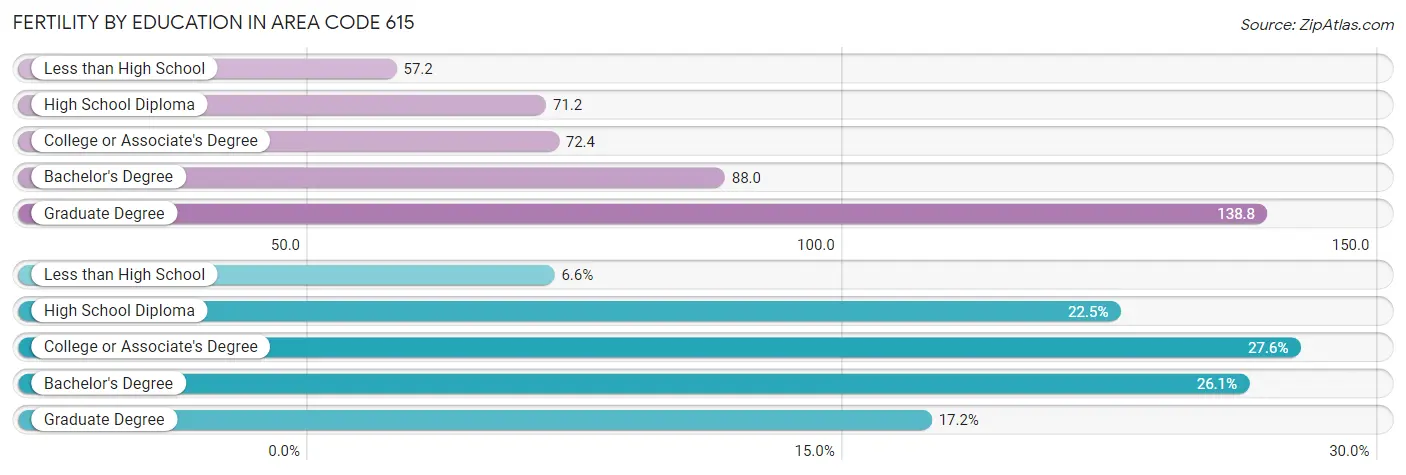
| Educational Attainment | Women with Births | Births / 1,000 Women |
| Less than High School | 1,947 (6.6%) | 57.2 |
| High School Diploma | 6,629 (22.5%) | 71.2 |
| College or Associate's Degree | 8,121 (27.6%) | 72.4 |
| Bachelor's Degree | 7,697 (26.1%) | 88.0 |
| Graduate Degree | 5,070 (17.2%) | 138.8 |
| Total | 29,464 (100.0%) | 62.1 |
Fertility by Education by Marriage Status in Area Code 615
36.8% of women with births in Area Code 615 are unmarried. Women with the educational attainment of bachelor's degree are most likely to be married with 72.2% of them married at childbirth, while women with the educational attainment of less than high school are least likely to be married with 76.9% of them unmarried at childbirth.
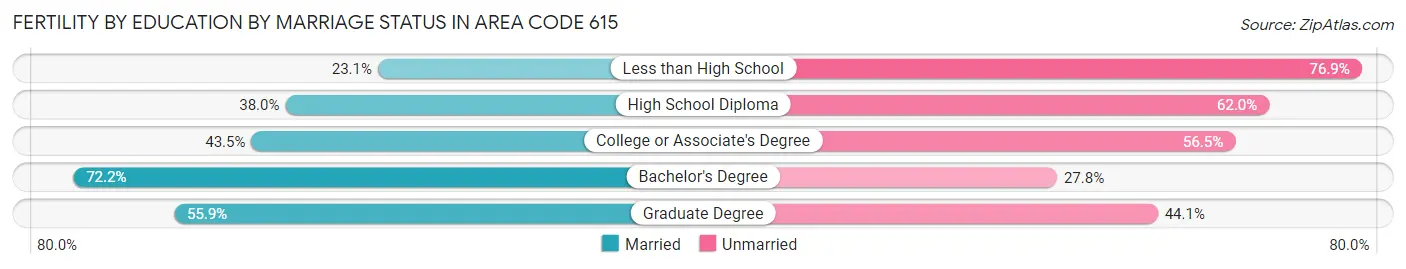
| Educational Attainment | Married | Unmarried |
| Less than High School | 449 (23.1%) | 1,498 (76.9%) |
| High School Diploma | 2,517 (38.0%) | 4,112 (62.0%) |
| College or Associate's Degree | 3,529 (43.5%) | 4,592 (56.5%) |
| Bachelor's Degree | 5,554 (72.2%) | 2,143 (27.8%) |
| Graduate Degree | 2,835 (55.9%) | 2,235 (44.1%) |
| Total | 18,626 (63.2%) | 10,838 (36.8%) |
Employment Characteristics in Area Code 615
Employment by Class of Employer in Area Code 615
Among the 1,086,640 employed individuals in Area Code 615, private company employees (754,702 | 69.5%), not-for-profit organizations (86,486 | 8.0%), and self-employed (not incorporated) (76,323 | 7.0%) make up the most common classes of employment.
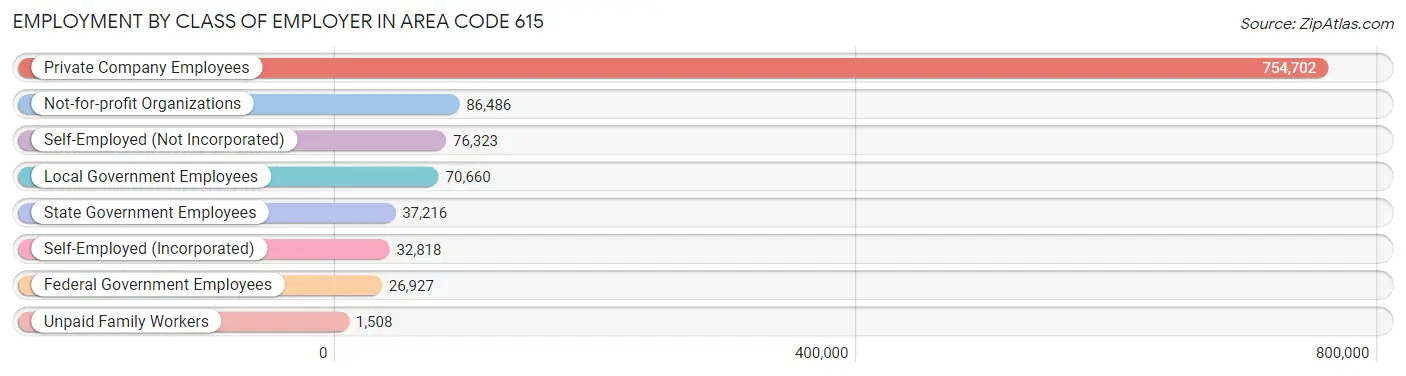
| Employer Class | # Employees | % Employees |
| Private Company Employees | 754,702 | 69.5% |
| Self-Employed (Incorporated) | 32,818 | 3.0% |
| Self-Employed (Not Incorporated) | 76,323 | 7.0% |
| Not-for-profit Organizations | 86,486 | 8.0% |
| Local Government Employees | 70,660 | 6.5% |
| State Government Employees | 37,216 | 3.4% |
| Federal Government Employees | 26,927 | 2.5% |
| Unpaid Family Workers | 1,508 | 0.1% |
| Total | 1,086,640 | 100.0% |
Employment Status by Age in Area Code 615
According to the labor force statistics for Area Code 615, out of the total population over 16 years of age (1,682,126), 64.2% or 1,080,598 individuals are in the labor force, with 4.0% or 43,656 of them unemployed. The age group with the highest labor force participation rate is 30 to 34 years, with 84.5% or 136,246 individuals in the labor force. Within the labor force, the 16 to 19 years age range has the highest percentage of unemployed individuals, with 980.1% or 492,735 of them being unemployed.
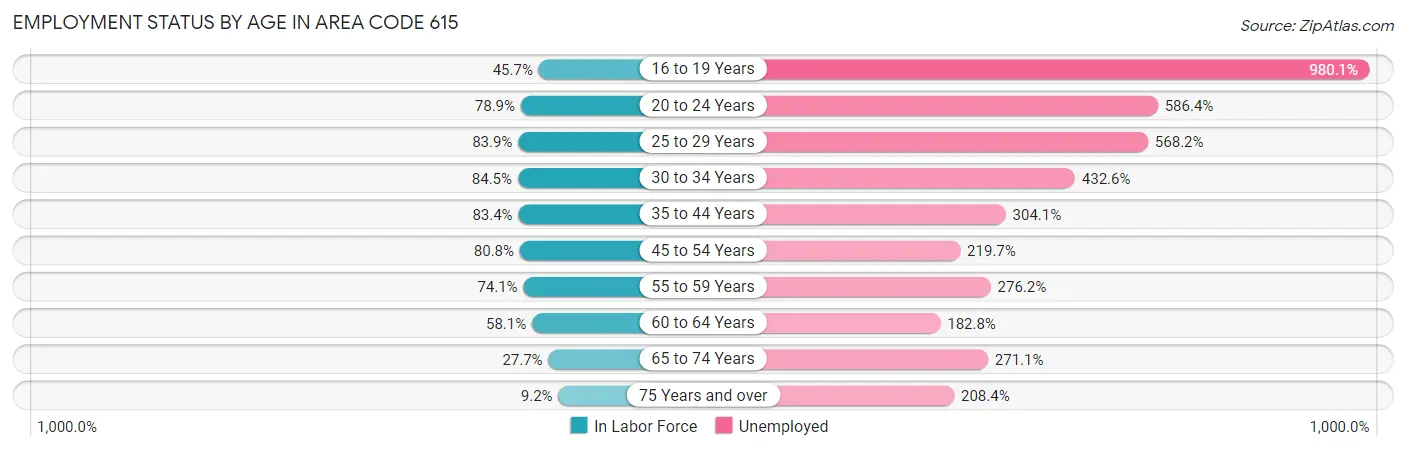
| Age Bracket | In Labor Force | Unemployed |
| 16 to 19 Years | 50,279 (45.7%) | 492,735 (980.1%) |
| 20 to 24 Years | 113,989 (78.9%) | 668,396 (586.4%) |
| 25 to 29 Years | 136,769 (83.9%) | 777,104 (568.2%) |
| 30 to 34 Years | 136,244 (84.5%) | 589,400 (432.6%) |
| 35 to 44 Years | 246,728 (83.4%) | 750,263 (304.1%) |
| 45 to 54 Years | 216,191 (80.7%) | 474,976 (219.7%) |
| 55 to 59 Years | 100,060 (74.1%) | 276,357 (276.2%) |
| 60 to 64 Years | 68,916 (58.1%) | 125,978 (182.8%) |
| 65 to 74 Years | 48,931 (27.7%) | 132,638 (271.1%) |
| 75 Years and over | 10,025 (9.2%) | 20,888 (208.4%) |
| Total | 1,080,562 (64.2%) | 43,707 (4.0%) |
Employment Status by Educational Attainment in Area Code 615
According to labor force statistics for Area Code 615, 77.2% of individuals (881,677) out of the total population between 25 and 64 years of age (1,141,921) are in the labor force, with 324.2% or 2,858,397 of them being unemployed. The group with the highest labor force participation rate are those with the educational attainment of bachelor's degree or higher, with 86.1% or 404,300 individuals in the labor force. Within the labor force, individuals with less than high school education have the highest percentage of unemployment, with 648.9% or 328,240 of them being unemployed.
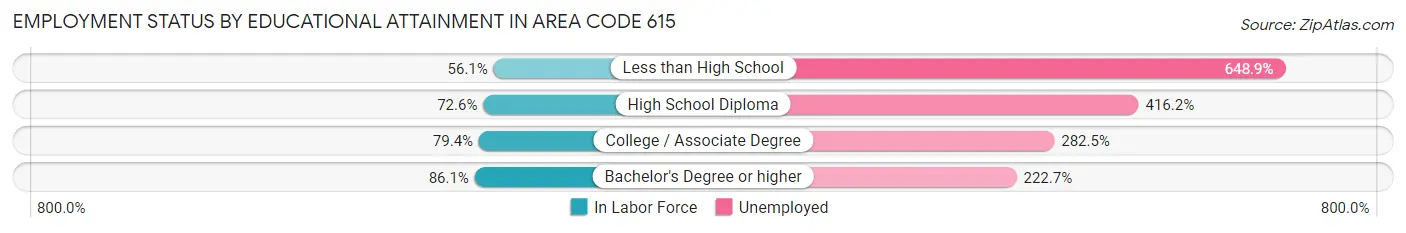
| Educational Attainment | In Labor Force | Unemployed |
| Less than High School | 50,585 (56.1%) | 584,893 (648.9%) |
| High School Diploma | 199,587 (72.6%) | 1,144,970 (416.2%) |
| College / Associate Degree | 243,824 (79.4%) | 867,750 (282.5%) |
| Bachelor's Degree or higher | 404,295 (86.1%) | 1,045,612 (222.7%) |
| Total | 881,729 (77.2%) | 3,702,108 (324.2%) |
Employment Occupations by Sex in Area Code 615
Management, Business, Science and Arts Occupations
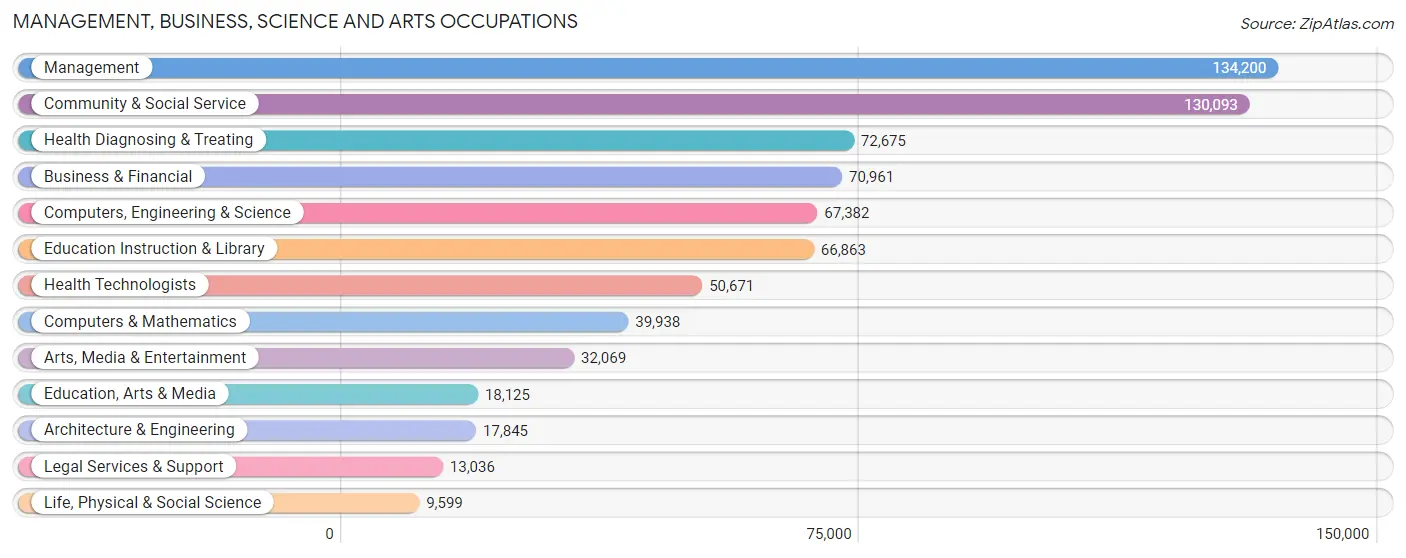
The most common Management, Business, Science and Arts occupations in Area Code 615 are Management (134,200 | 12.2%), Community & Social Service (130,093 | 11.8%), Health Diagnosing & Treating (72,675 | 6.6%), Business & Financial (70,961 | 6.5%), and Computers, Engineering & Science (67,382 | 6.1%).
Management, Business, Science and Arts Occupations by Sex
Within the Management, Business, Science and Arts occupations in Area Code 615, the most male-oriented occupations are Architecture & Engineering (85.0%), Computers & Mathematics (75.3%), and Computers, Engineering & Science (73.4%), while the most female-oriented occupations are Health Diagnosing & Treating (74.7%), Education Instruction & Library (74.4%), and Health Technologists (73.8%).
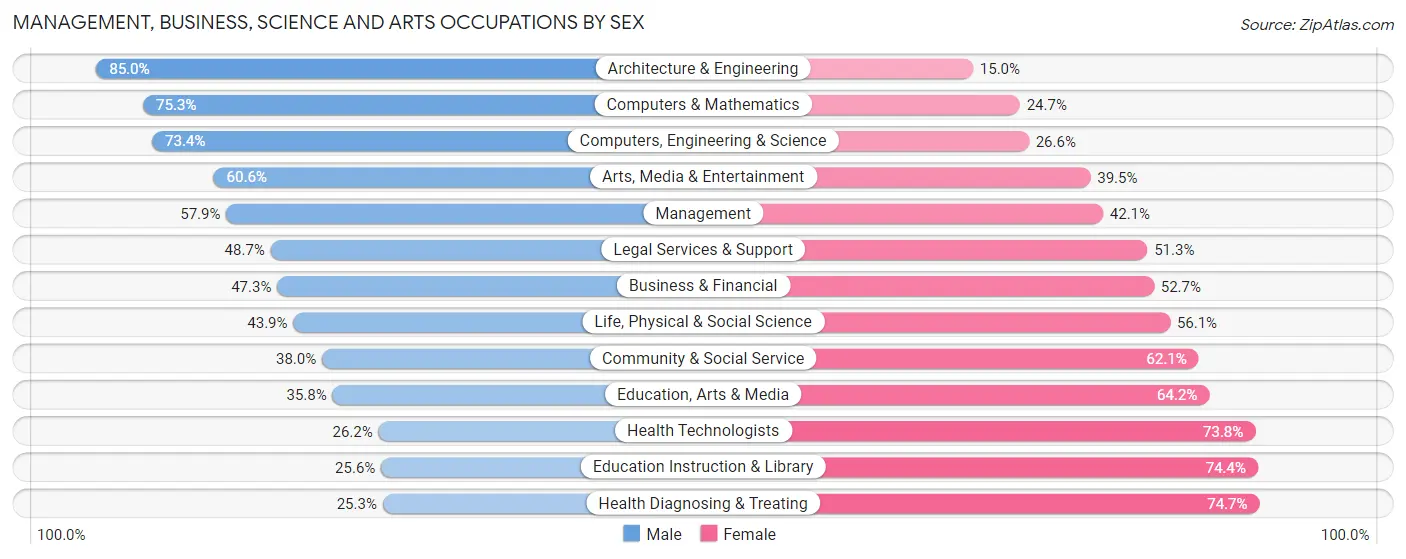
| Occupation | Male | Female |
| Management | 77,747 (57.9%) | 56,453 (42.1%) |
| Business & Financial | 33,563 (47.3%) | 37,398 (52.7%) |
| Computers, Engineering & Science | 49,453 (73.4%) | 17,929 (26.6%) |
| Computers & Mathematics | 30,061 (75.3%) | 9,877 (24.7%) |
| Architecture & Engineering | 15,175 (85.0%) | 2,670 (15.0%) |
| Life, Physical & Social Science | 4,217 (43.9%) | 5,382 (56.1%) |
| Community & Social Service | 49,375 (38.0%) | 80,718 (62.1%) |
| Education, Arts & Media | 6,482 (35.8%) | 11,643 (64.2%) |
| Legal Services & Support | 6,344 (48.7%) | 6,692 (51.3%) |
| Education Instruction & Library | 17,131 (25.6%) | 49,732 (74.4%) |
| Arts, Media & Entertainment | 19,418 (60.6%) | 12,651 (39.5%) |
| Health Diagnosing & Treating | 18,382 (25.3%) | 54,293 (74.7%) |
| Health Technologists | 13,259 (26.2%) | 37,412 (73.8%) |
| Total (Category) | 228,520 (48.1%) | 246,791 (51.9%) |
| Total (Overall) | 580,142 (52.7%) | 520,233 (47.3%) |
Services Occupations
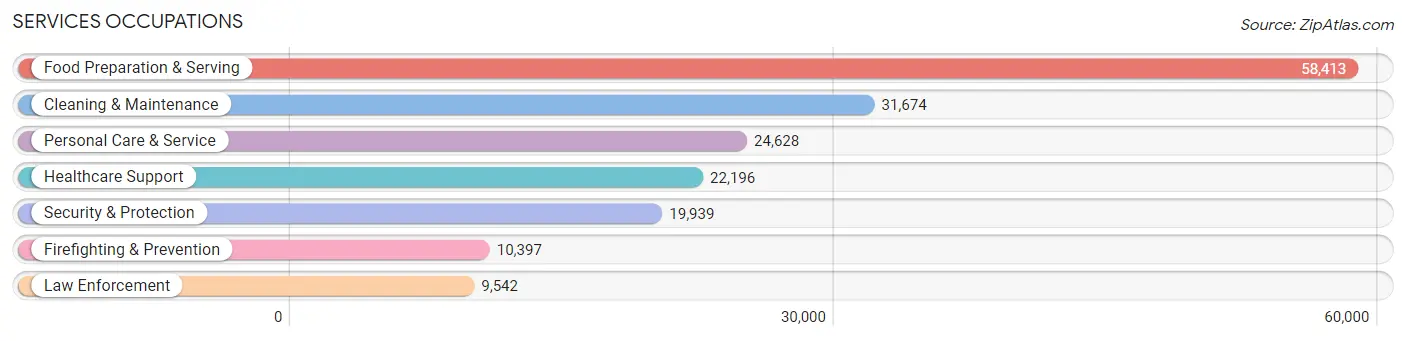
The most common Services occupations in Area Code 615 are Food Preparation & Serving (58,413 | 5.3%), Cleaning & Maintenance (31,674 | 2.9%), Personal Care & Service (24,628 | 2.2%), Healthcare Support (22,196 | 2.0%), and Security & Protection (19,939 | 1.8%).
Services Occupations by Sex
Within the Services occupations in Area Code 615, the most male-oriented occupations are Law Enforcement (84.4%), Security & Protection (78.2%), and Firefighting & Prevention (72.6%), while the most female-oriented occupations are Healthcare Support (83.6%), Personal Care & Service (78.5%), and Food Preparation & Serving (52.8%).
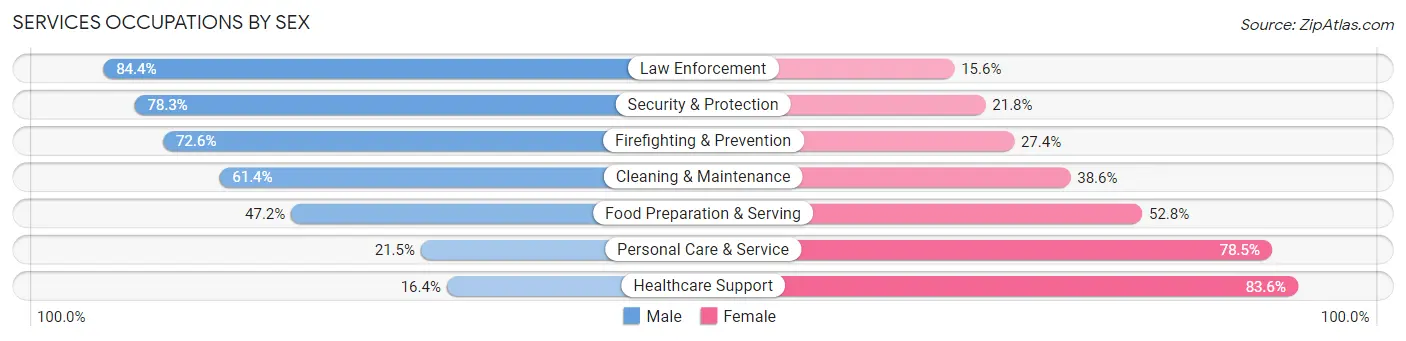
| Occupation | Male | Female |
| Healthcare Support | 3,643 (16.4%) | 18,553 (83.6%) |
| Security & Protection | 15,602 (78.2%) | 4,337 (21.7%) |
| Firefighting & Prevention | 7,547 (72.6%) | 2,850 (27.4%) |
| Law Enforcement | 8,055 (84.4%) | 1,487 (15.6%) |
| Food Preparation & Serving | 27,587 (47.2%) | 30,826 (52.8%) |
| Cleaning & Maintenance | 19,456 (61.4%) | 12,218 (38.6%) |
| Personal Care & Service | 5,305 (21.5%) | 19,323 (78.5%) |
| Total (Category) | 71,593 (45.6%) | 85,257 (54.4%) |
| Total (Overall) | 580,142 (52.7%) | 520,233 (47.3%) |
Sales and Office Occupations
The most common Sales and Office occupations in Area Code 615 are Office & Administration (124,122 | 11.3%), and Sales & Related (112,365 | 10.2%).
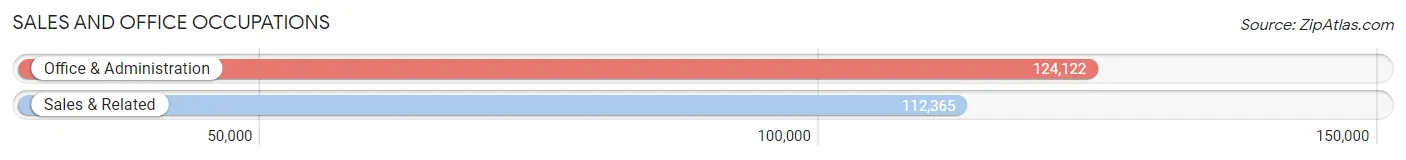
Sales and Office Occupations by Sex
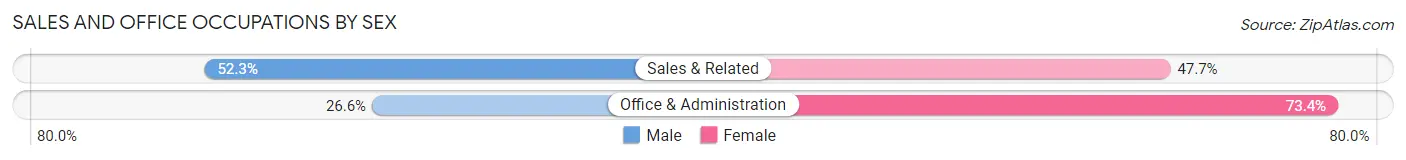
| Occupation | Male | Female |
| Sales & Related | 58,791 (52.3%) | 53,574 (47.7%) |
| Office & Administration | 32,970 (26.6%) | 91,152 (73.4%) |
| Total (Category) | 91,761 (38.8%) | 144,726 (61.2%) |
| Total (Overall) | 580,142 (52.7%) | 520,233 (47.3%) |
Natural Resources, Construction and Maintenance Occupations
The most common Natural Resources, Construction and Maintenance occupations in Area Code 615 are Construction & Extraction (50,458 | 4.6%), Installation, Maintenance & Repair (30,209 | 2.8%), and Farming, Fishing & Forestry (2,355 | 0.2%).
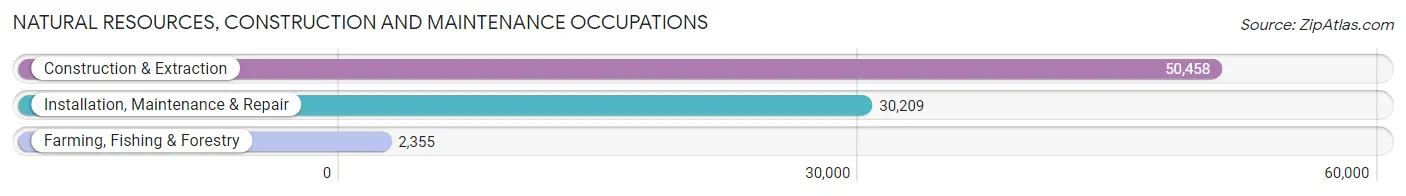
Natural Resources, Construction and Maintenance Occupations by Sex
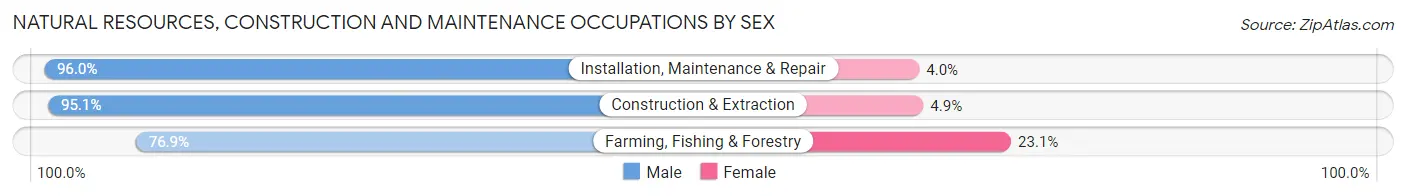
| Occupation | Male | Female |
| Farming, Fishing & Forestry | 1,810 (76.9%) | 545 (23.1%) |
| Construction & Extraction | 47,990 (95.1%) | 2,468 (4.9%) |
| Installation, Maintenance & Repair | 28,989 (96.0%) | 1,220 (4.0%) |
| Total (Category) | 78,789 (94.9%) | 4,233 (5.1%) |
| Total (Overall) | 580,142 (52.7%) | 520,233 (47.3%) |
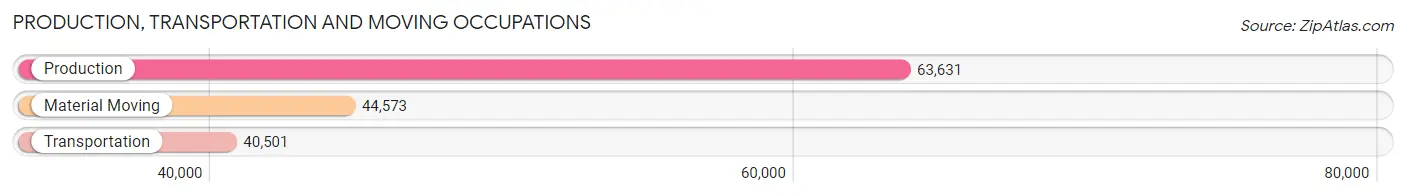
Production, Transportation and Moving Occupations
The most common Production, Transportation and Moving occupations in Area Code 615 are Production (63,631 | 5.8%), Material Moving (44,573 | 4.1%), and Transportation (40,501 | 3.7%).
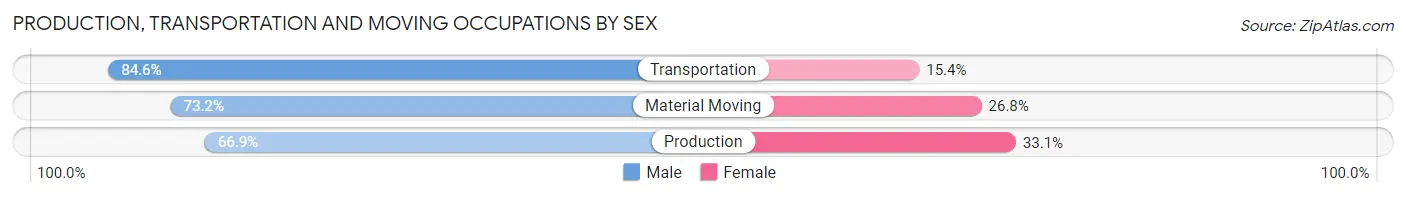
Production, Transportation and Moving Occupations by Sex
| Occupation | Male | Female |
| Production | 42,577 (66.9%) | 21,054 (33.1%) |
| Transportation | 34,276 (84.6%) | 6,225 (15.4%) |
| Material Moving | 32,626 (73.2%) | 11,947 (26.8%) |
| Total (Category) | 109,479 (73.6%) | 39,226 (26.4%) |
| Total (Overall) | 580,142 (52.7%) | 520,233 (47.3%) |
Employment Industries by Sex in Area Code 615
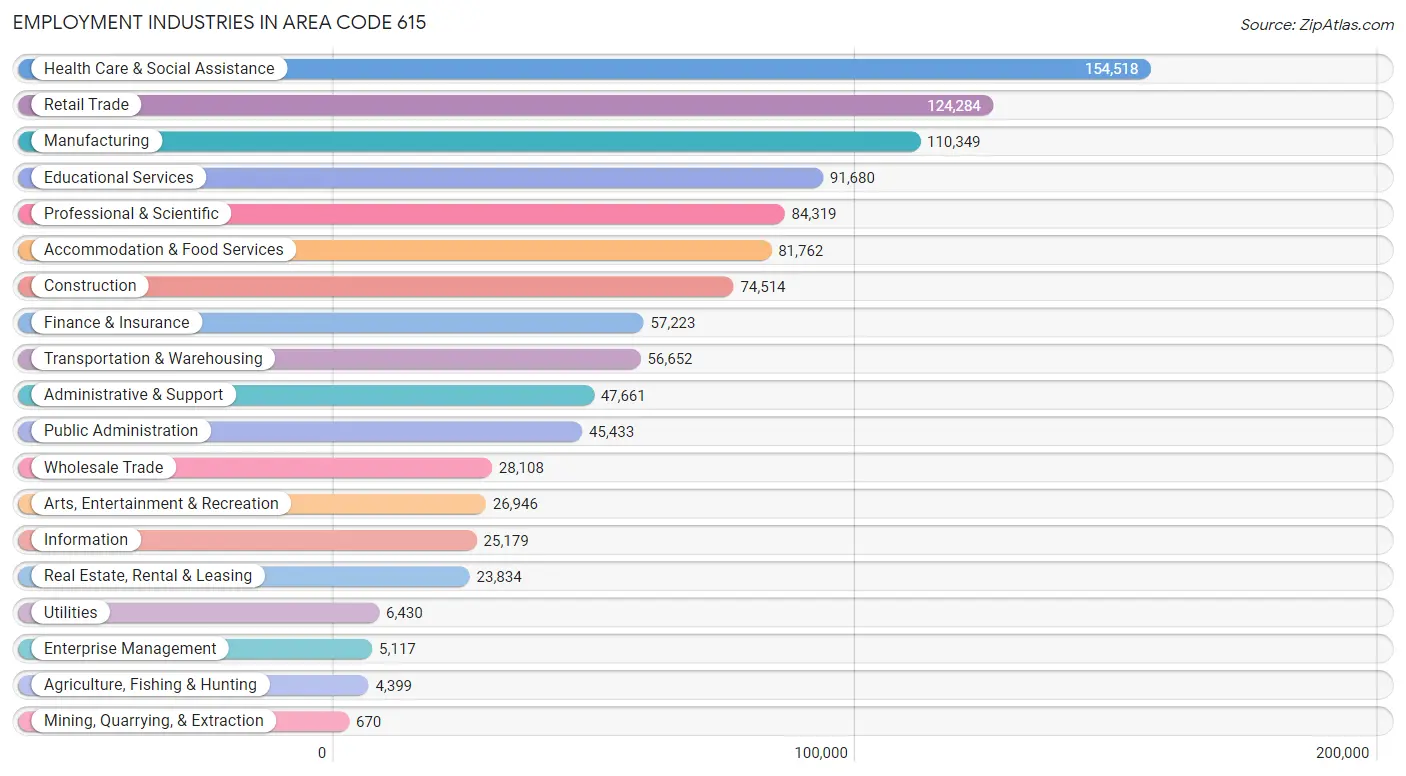
Employment Industries in Area Code 615
The major employment industries in Area Code 615 include Health Care & Social Assistance (154,518 | 14.0%), Retail Trade (124,284 | 11.3%), Manufacturing (110,349 | 10.0%), Educational Services (91,680 | 8.3%), and Professional & Scientific (84,319 | 7.7%).
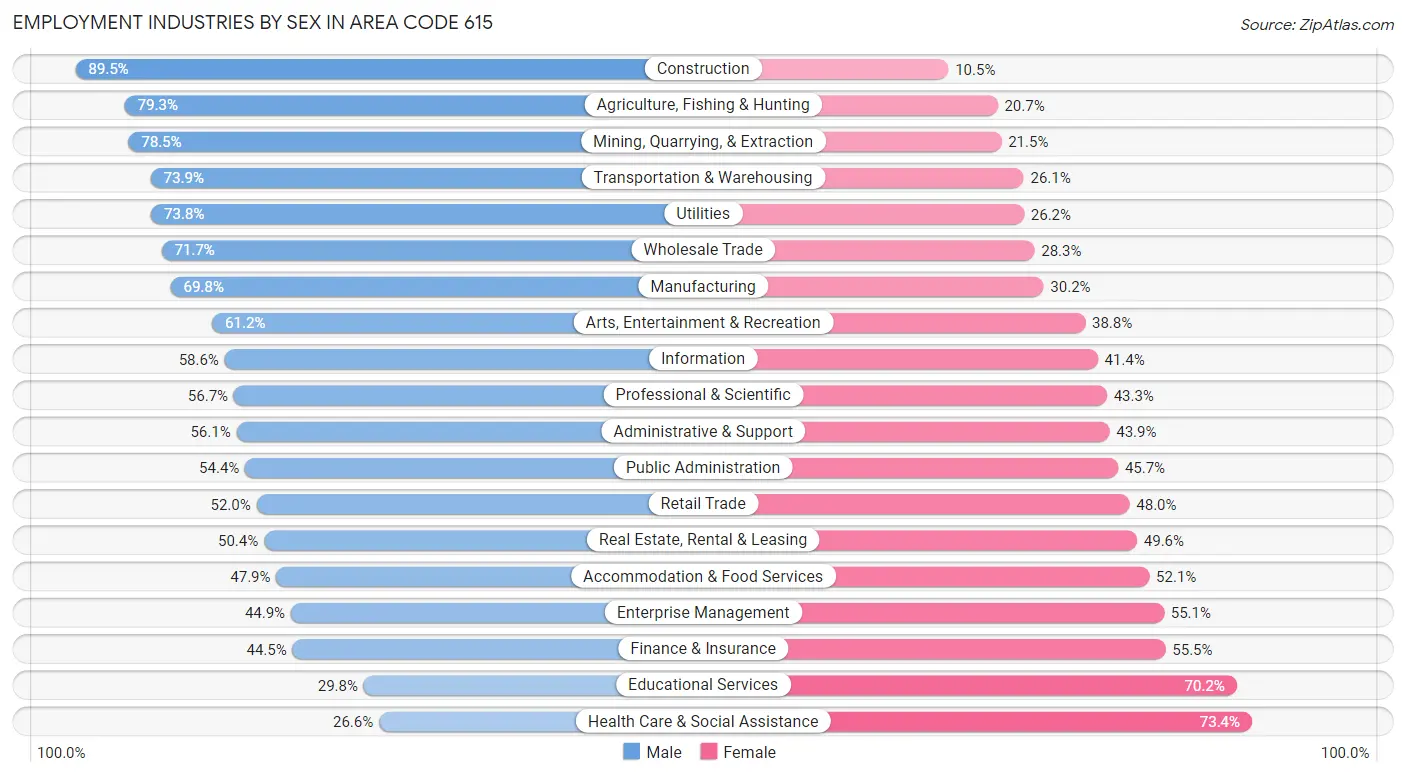
Employment Industries by Sex in Area Code 615
The Area Code 615 industries that see more men than women are Construction (89.5%), Agriculture, Fishing & Hunting (79.3%), and Mining, Quarrying, & Extraction (78.5%), whereas the industries that tend to have a higher number of women are Health Care & Social Assistance (73.4%), Educational Services (70.2%), and Finance & Insurance (55.5%).
| Industry | Male | Female |
| Agriculture, Fishing & Hunting | 3,488 (79.3%) | 911 (20.7%) |
| Mining, Quarrying, & Extraction | 526 (78.5%) | 144 (21.5%) |
| Construction | 66,672 (89.5%) | 7,842 (10.5%) |
| Manufacturing | 77,004 (69.8%) | 33,345 (30.2%) |
| Wholesale Trade | 20,145 (71.7%) | 7,963 (28.3%) |
| Retail Trade | 64,617 (52.0%) | 59,667 (48.0%) |
| Transportation & Warehousing | 41,863 (73.9%) | 14,789 (26.1%) |
| Utilities | 4,747 (73.8%) | 1,683 (26.2%) |
| Information | 14,751 (58.6%) | 10,428 (41.4%) |
| Finance & Insurance | 25,487 (44.5%) | 31,736 (55.5%) |
| Real Estate, Rental & Leasing | 12,023 (50.4%) | 11,811 (49.6%) |
| Professional & Scientific | 47,794 (56.7%) | 36,525 (43.3%) |
| Enterprise Management | 2,296 (44.9%) | 2,821 (55.1%) |
| Administrative & Support | 26,757 (56.1%) | 20,904 (43.9%) |
| Educational Services | 27,314 (29.8%) | 64,366 (70.2%) |
| Health Care & Social Assistance | 41,163 (26.6%) | 113,355 (73.4%) |
| Arts, Entertainment & Recreation | 16,483 (61.2%) | 10,463 (38.8%) |
| Accommodation & Food Services | 39,154 (47.9%) | 42,608 (52.1%) |
| Public Administration | 24,693 (54.3%) | 20,740 (45.7%) |
| Total | 580,142 (52.7%) | 520,233 (47.3%) |
Education in Area Code 615
School Enrollment in Area Code 615
The most common levels of schooling among the 507,186 students in Area Code 615 are high school (111,089 | 21.9%), middle school (110,402 | 21.8%), and elementary school (101,870 | 20.1%).
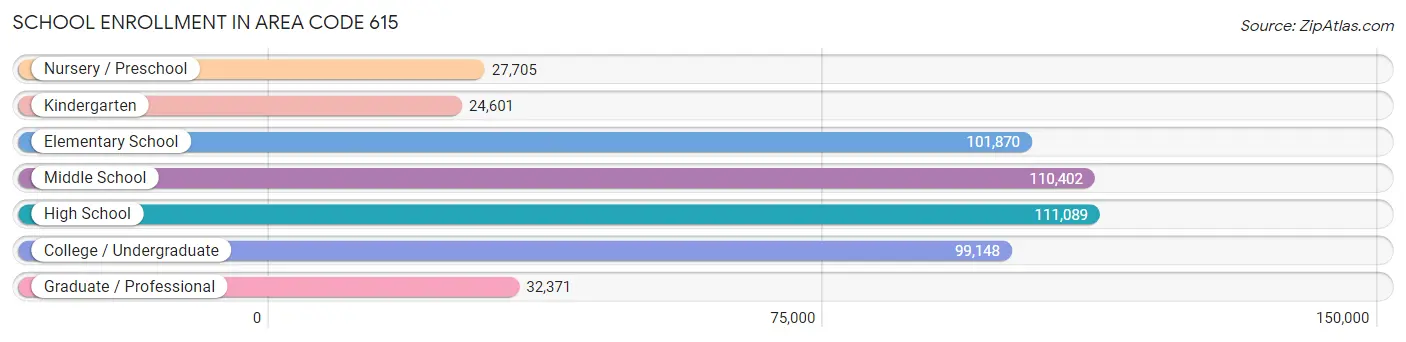
| School Level | # Students | % Students |
| Nursery / Preschool | 27,705 | 5.5% |
| Kindergarten | 24,601 | 4.9% |
| Elementary School | 101,870 | 20.1% |
| Middle School | 110,402 | 21.8% |
| High School | 111,089 | 21.9% |
| College / Undergraduate | 99,148 | 19.6% |
| Graduate / Professional | 32,371 | 6.4% |
| Total | 507,186 | 100.0% |
School Enrollment by Age by Funding Source in Area Code 615
Out of a total of 507,186 students who are enrolled in schools in Area Code 615, 115,087 (22.7%) attend a private institution, while the remaining 392,099 (77.3%) are enrolled in public schools. The age group of 3 to 4 year olds has the highest likelihood of being enrolled in private schools, with 10,376 (48.1% in the age bracket) enrolled. Conversely, the age group of 5 to 9 year old has the lowest likelihood of being enrolled in a private school, with 101,677 (83.8% in the age bracket) attending a public institution.
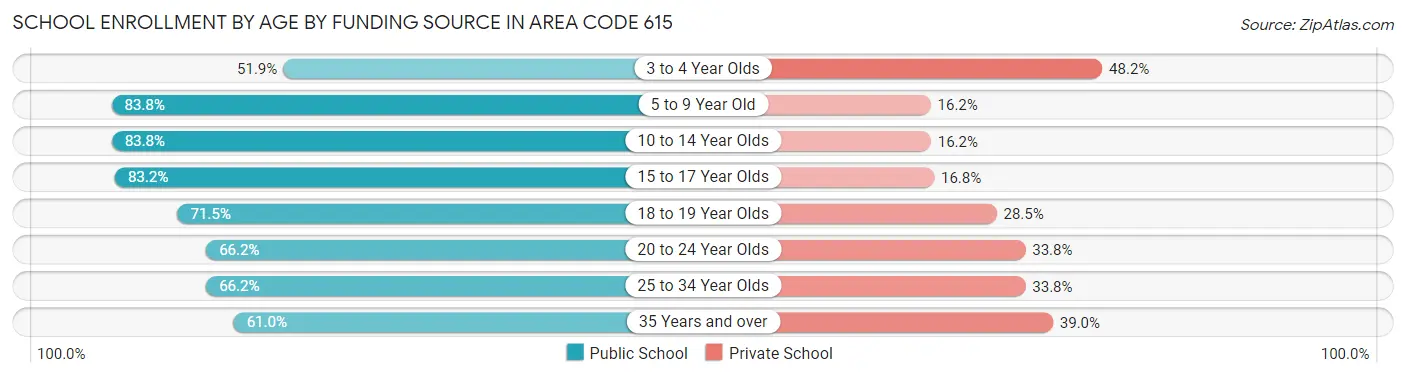
| Age Bracket | Public School | Private School |
| 3 to 4 Year Olds | 11,174 (51.8%) | 10,376 (48.1%) |
| 5 to 9 Year Old | 101,677 (83.8%) | 19,640 (16.2%) |
| 10 to 14 Year Olds | 113,348 (83.8%) | 21,955 (16.2%) |
| 15 to 17 Year Olds | 66,161 (83.2%) | 13,397 (16.8%) |
| 18 to 19 Year Olds | 29,040 (71.5%) | 11,562 (28.5%) |
| 20 to 24 Year Olds | 34,537 (66.2%) | 17,656 (33.8%) |
| 25 to 34 Year Olds | 20,476 (66.2%) | 10,474 (33.8%) |
| 35 Years and over | 15,694 (61.0%) | 10,019 (39.0%) |
| Total | 392,099 (77.3%) | 115,087 (22.7%) |
Educational Attainment by Field of Study in Area Code 615
Business (135,761 | 22.5%), science & technology (61,859 | 10.2%), education (61,032 | 10.1%), arts & humanities (41,536 | 6.9%), and social sciences (36,367 | 6.0%) are the most common fields of study among 603,705 individuals in Area Code 615 who have obtained a bachelor's degree or higher.
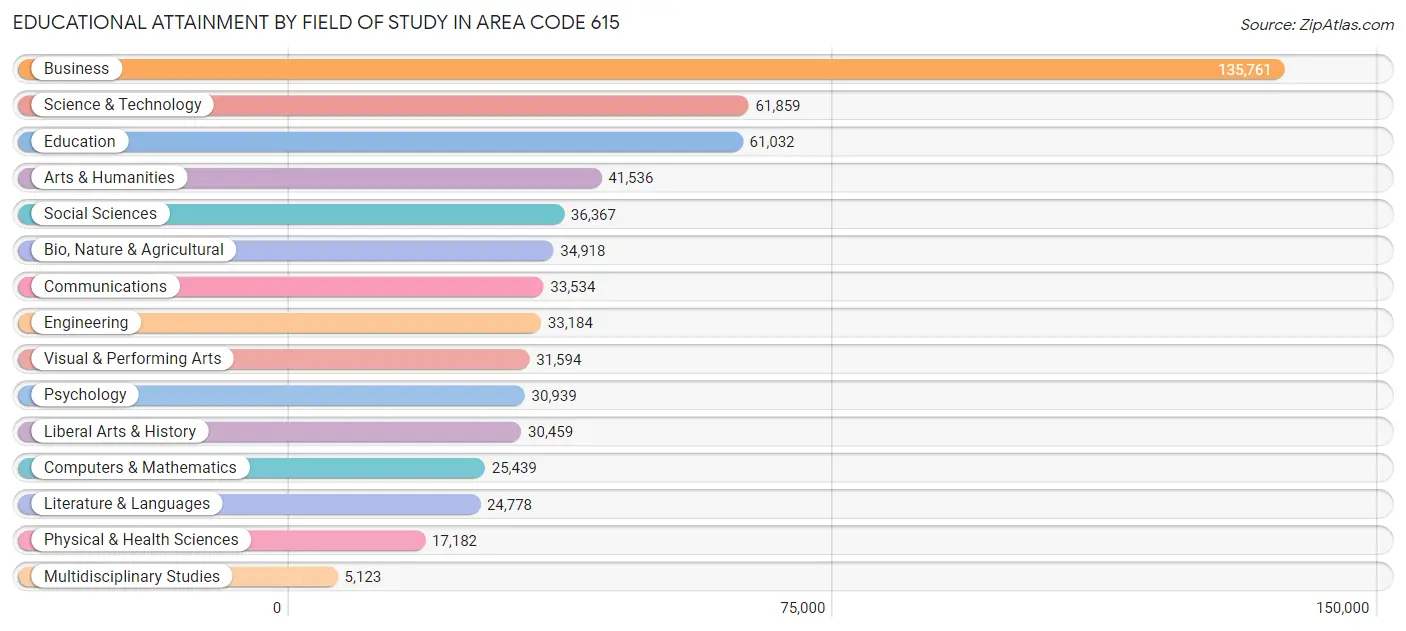
| Field of Study | # Graduates | % Graduates |
| Computers & Mathematics | 25,439 | 4.2% |
| Bio, Nature & Agricultural | 34,918 | 5.8% |
| Physical & Health Sciences | 17,182 | 2.9% |
| Psychology | 30,939 | 5.1% |
| Social Sciences | 36,367 | 6.0% |
| Engineering | 33,184 | 5.5% |
| Multidisciplinary Studies | 5,123 | 0.9% |
| Science & Technology | 61,859 | 10.2% |
| Business | 135,761 | 22.5% |
| Education | 61,032 | 10.1% |
| Literature & Languages | 24,778 | 4.1% |
| Liberal Arts & History | 30,459 | 5.1% |
| Visual & Performing Arts | 31,594 | 5.2% |
| Communications | 33,534 | 5.6% |
| Arts & Humanities | 41,536 | 6.9% |
| Total | 603,705 | 100.0% |
Transportation & Commute in Area Code 615
Vehicle Availability by Sex in Area Code 615
The most prevalent vehicle ownership categories in Area Code 615 are males with 2 vehicles (247,841, accounting for 43.1%) and females with 2 vehicles (205,590, making up 49.2%).
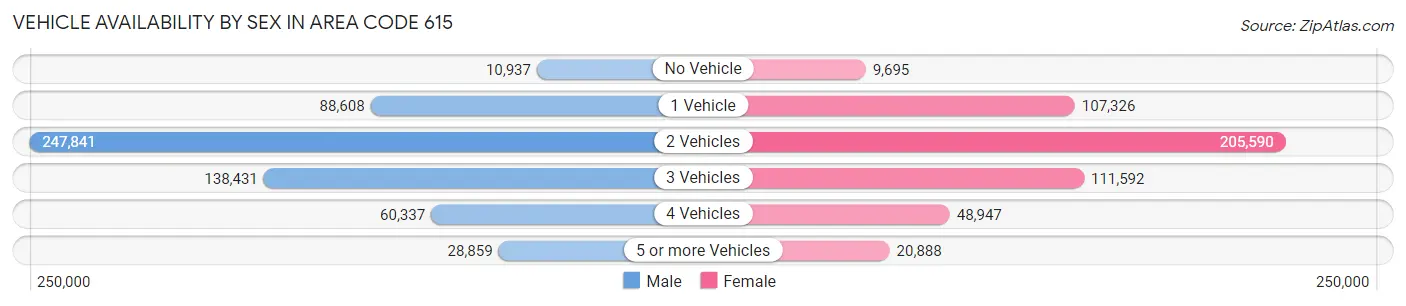
| Vehicles Available | Male | Female |
| No Vehicle | 10,937 (1.9%) | 9,695 (1.9%) |
| 1 Vehicle | 88,608 (15.4%) | 107,326 (21.3%) |
| 2 Vehicles | 247,841 (43.1%) | 205,590 (40.8%) |
| 3 Vehicles | 138,431 (24.1%) | 111,592 (22.1%) |
| 4 Vehicles | 60,337 (10.5%) | 48,947 (9.7%) |
| 5 or more Vehicles | 28,859 (5.0%) | 20,888 (4.1%) |
| Total | 575,013 (100.0%) | 504,038 (100.0%) |
Commute Time in Area Code 615
The most frequently occuring commute durations in Area Code 615 are 30 to 34 minutes (140,591 commuters, 15.0%), 15 to 19 minutes (138,801 commuters, 14.8%), and 20 to 24 minutes (133,960 commuters, 14.3%).
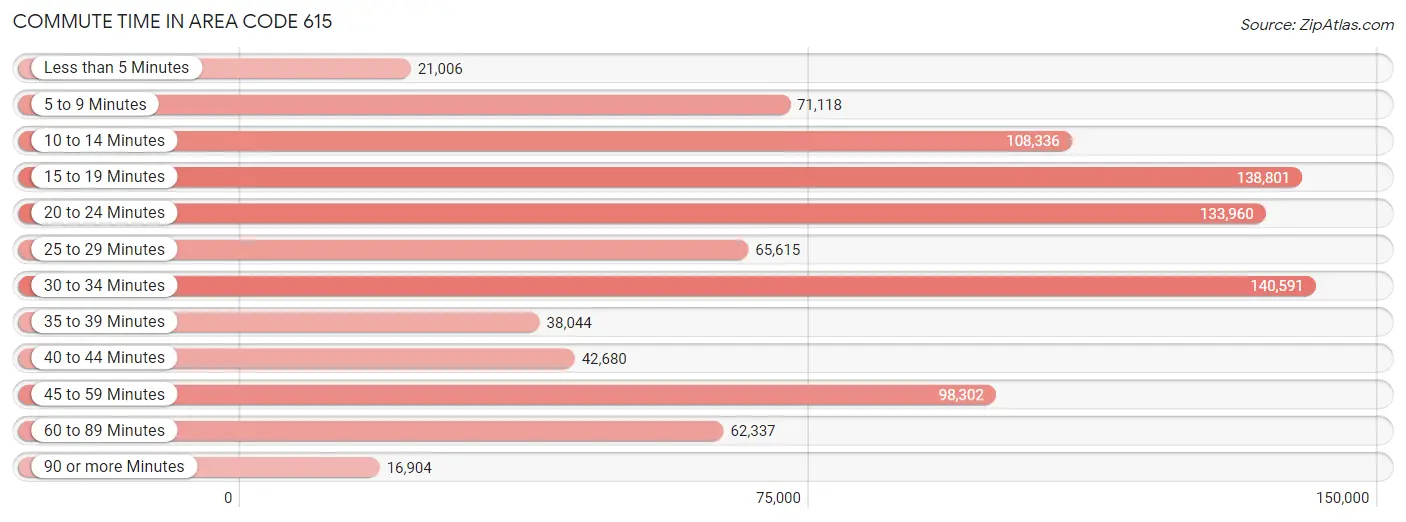
| Commute Time | # Commuters | % Commuters |
| Less than 5 Minutes | 21,006 | 2.2% |
| 5 to 9 Minutes | 71,118 | 7.6% |
| 10 to 14 Minutes | 108,336 | 11.6% |
| 15 to 19 Minutes | 138,801 | 14.8% |
| 20 to 24 Minutes | 133,960 | 14.3% |
| 25 to 29 Minutes | 65,615 | 7.0% |
| 30 to 34 Minutes | 140,591 | 15.0% |
| 35 to 39 Minutes | 38,044 | 4.1% |
| 40 to 44 Minutes | 42,680 | 4.5% |
| 45 to 59 Minutes | 98,302 | 10.5% |
| 60 to 89 Minutes | 62,337 | 6.7% |
| 90 or more Minutes | 16,904 | 1.8% |
Commute Time by Sex in Area Code 615
The most common commute times in Area Code 615 are 30 to 34 minutes (79,243 commuters, 15.7%) for males and 15 to 19 minutes (66,987 commuters, 15.5%) for females.
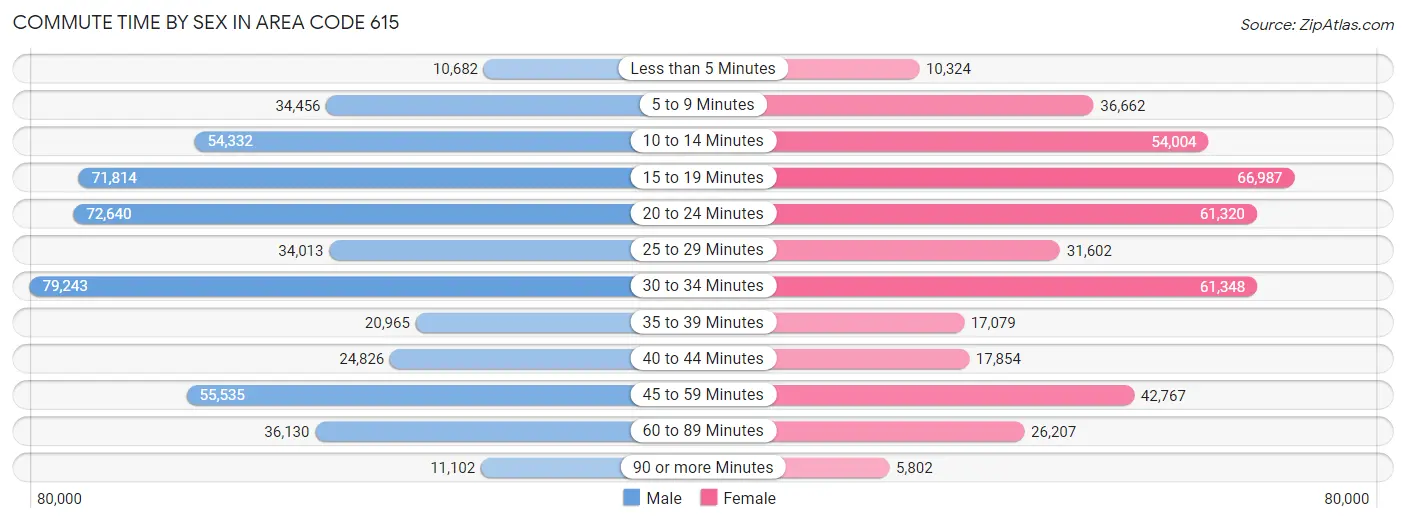
| Commute Time | Male | Female |
| Less than 5 Minutes | 10,682 (2.1%) | 10,324 (2.4%) |
| 5 to 9 Minutes | 34,456 (6.8%) | 36,662 (8.5%) |
| 10 to 14 Minutes | 54,332 (10.7%) | 54,004 (12.5%) |
| 15 to 19 Minutes | 71,814 (14.2%) | 66,987 (15.5%) |
| 20 to 24 Minutes | 72,640 (14.4%) | 61,320 (14.2%) |
| 25 to 29 Minutes | 34,013 (6.7%) | 31,602 (7.3%) |
| 30 to 34 Minutes | 79,243 (15.7%) | 61,348 (14.2%) |
| 35 to 39 Minutes | 20,965 (4.2%) | 17,079 (4.0%) |
| 40 to 44 Minutes | 24,826 (4.9%) | 17,854 (4.1%) |
| 45 to 59 Minutes | 55,535 (11.0%) | 42,767 (9.9%) |
| 60 to 89 Minutes | 36,130 (7.1%) | 26,207 (6.1%) |
| 90 or more Minutes | 11,102 (2.2%) | 5,802 (1.3%) |
Time of Departure to Work by Sex in Area Code 615
The most frequent times of departure to work in Area Code 615 are 7:00 AM to 7:29 AM (68,937, 13.6%) for males and 7:00 AM to 7:29 AM (68,235, 15.8%) for females.
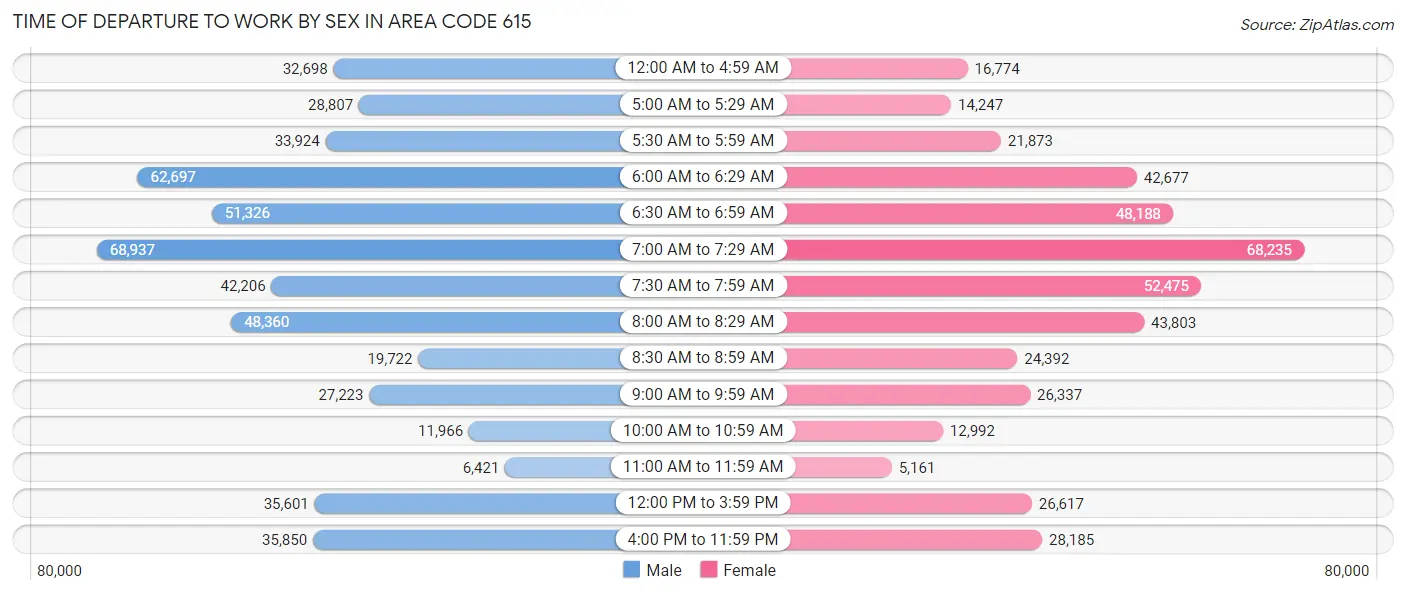
| Time of Departure | Male | Female |
| 12:00 AM to 4:59 AM | 32,698 (6.5%) | 16,774 (3.9%) |
| 5:00 AM to 5:29 AM | 28,807 (5.7%) | 14,247 (3.3%) |
| 5:30 AM to 5:59 AM | 33,924 (6.7%) | 21,873 (5.1%) |
| 6:00 AM to 6:29 AM | 62,697 (12.4%) | 42,677 (9.9%) |
| 6:30 AM to 6:59 AM | 51,326 (10.2%) | 48,188 (11.2%) |
| 7:00 AM to 7:29 AM | 68,937 (13.6%) | 68,235 (15.8%) |
| 7:30 AM to 7:59 AM | 42,206 (8.4%) | 52,475 (12.1%) |
| 8:00 AM to 8:29 AM | 48,360 (9.6%) | 43,803 (10.1%) |
| 8:30 AM to 8:59 AM | 19,722 (3.9%) | 24,392 (5.7%) |
| 9:00 AM to 9:59 AM | 27,223 (5.4%) | 26,337 (6.1%) |
| 10:00 AM to 10:59 AM | 11,966 (2.4%) | 12,992 (3.0%) |
| 11:00 AM to 11:59 AM | 6,421 (1.3%) | 5,161 (1.2%) |
| 12:00 PM to 3:59 PM | 35,601 (7.0%) | 26,617 (6.2%) |
| 4:00 PM to 11:59 PM | 35,850 (7.1%) | 28,185 (6.5%) |
| Total | 505,738 (100.0%) | 431,956 (100.0%) |
Housing Occupancy in Area Code 615
Occupancy by Ownership in Area Code 615
Of the total 815,350 dwellings in Area Code 615, owner-occupied units account for 536,589 (65.8%), while renter-occupied units make up 278,761 (34.2%).
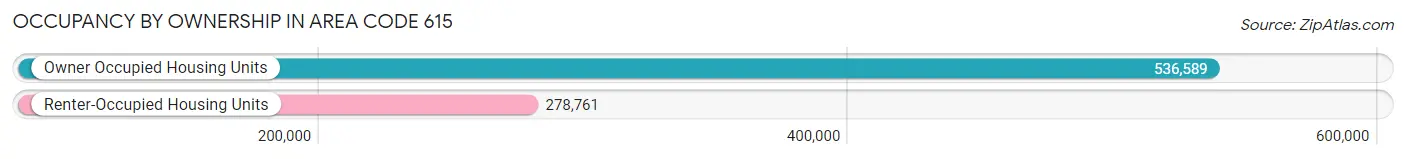
| Occupancy | # Housing Units | % Housing Units |
| Owner Occupied Housing Units | 536,589 | 65.8% |
| Renter-Occupied Housing Units | 278,761 | 34.2% |
| Total Occupied Housing Units | 815,350 | 100.0% |
Occupancy by Household Size in Area Code 615
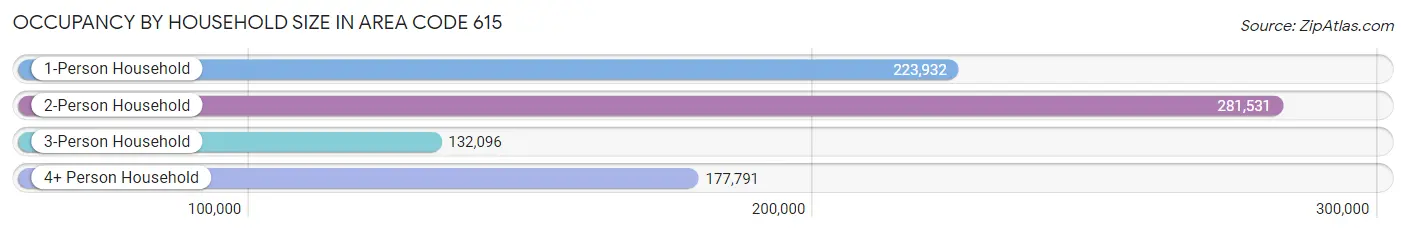
| Household Size | # Housing Units | % Housing Units |
| 1-Person Household | 223,932 | 27.5% |
| 2-Person Household | 281,531 | 34.5% |
| 3-Person Household | 132,096 | 16.2% |
| 4+ Person Household | 177,791 | 21.8% |
| Total Housing Units | 815,350 | 100.0% |
Occupancy by Ownership by Household Size in Area Code 615
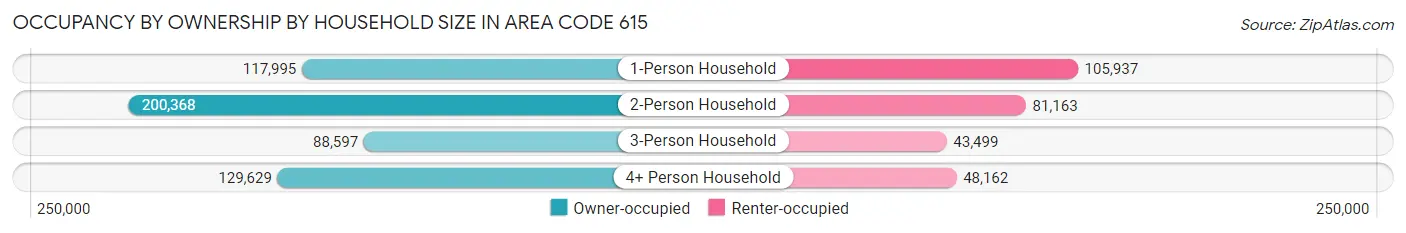
| Household Size | Owner-occupied | Renter-occupied |
| 1-Person Household | 117,995 (52.7%) | 105,937 (47.3%) |
| 2-Person Household | 200,368 (71.2%) | 81,163 (28.8%) |
| 3-Person Household | 88,597 (67.1%) | 43,499 (32.9%) |
| 4+ Person Household | 129,629 (72.9%) | 48,162 (27.1%) |
| Total Housing Units | 536,589 (65.8%) | 278,761 (34.2%) |
Occupancy by Educational Attainment in Area Code 615
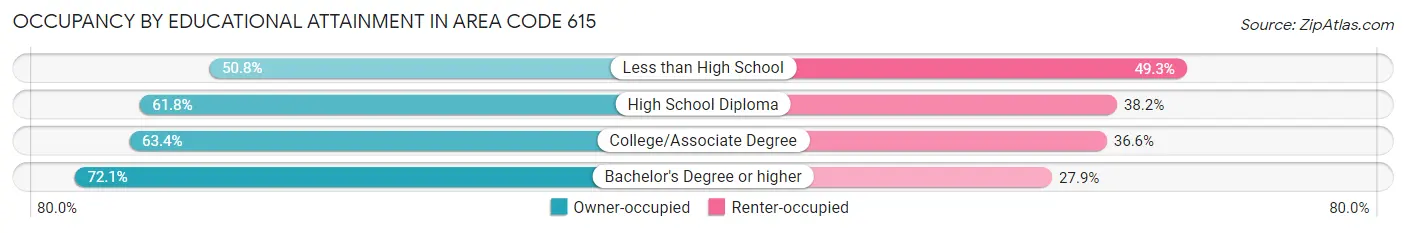
| Household Size | Owner-occupied | Renter-occupied |
| Less than High School | 28,942 (50.7%) | 28,083 (49.2%) |
| High School Diploma | 114,876 (61.8%) | 71,011 (38.2%) |
| College/Associate Degree | 145,238 (63.4%) | 83,825 (36.6%) |
| Bachelor's Degree or higher | 247,533 (72.1%) | 95,842 (27.9%) |
Occupancy by Age of Householder in Area Code 615
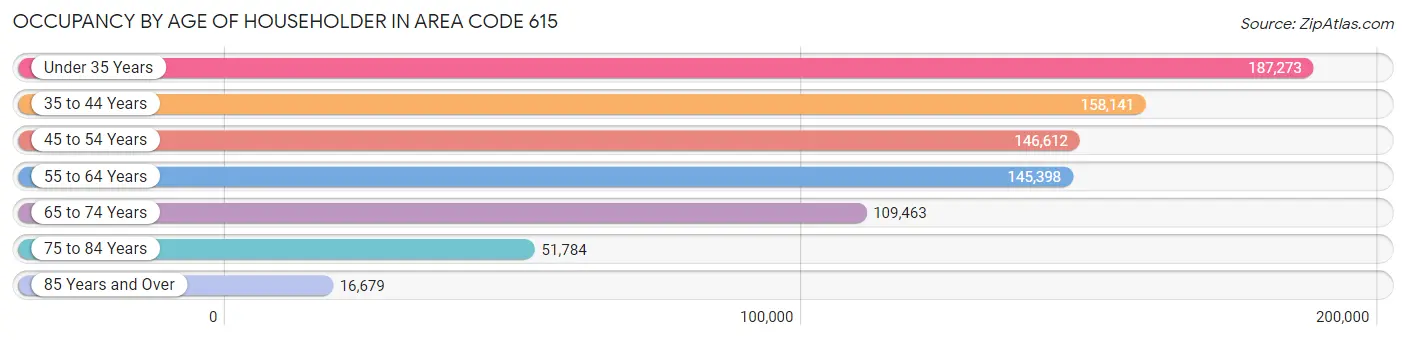
| Age Bracket | # Households | % Households |
| Under 35 Years | 187,273 | 23.0% |
| 35 to 44 Years | 158,141 | 19.4% |
| 45 to 54 Years | 146,612 | 18.0% |
| 55 to 64 Years | 145,398 | 17.8% |
| 65 to 74 Years | 109,463 | 13.4% |
| 75 to 84 Years | 51,784 | 6.4% |
| 85 Years and Over | 16,679 | 2.1% |
| Total | 815,350 | 100.0% |
Housing Finances in Area Code 615
Median Income by Occupancy in Area Code 615
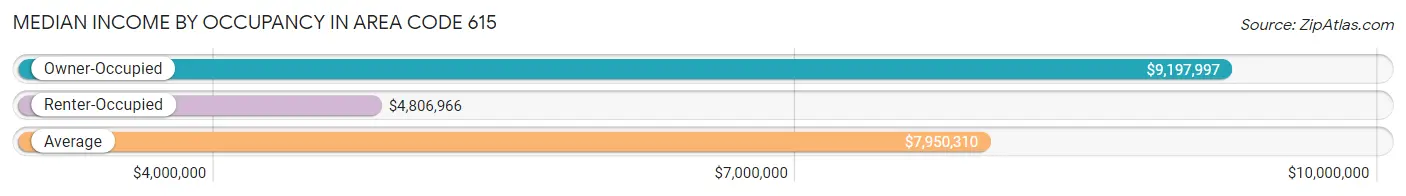
| Occupancy Type | # Households | Median Income |
| Owner-Occupied | 536,589 (65.8%) | $9,197,997 |
| Renter-Occupied | 278,761 (34.2%) | $4,806,966 |
| Average | 815,350 (100.0%) | $7,950,310 |
Occupancy by Householder Income Bracket in Area Code 615
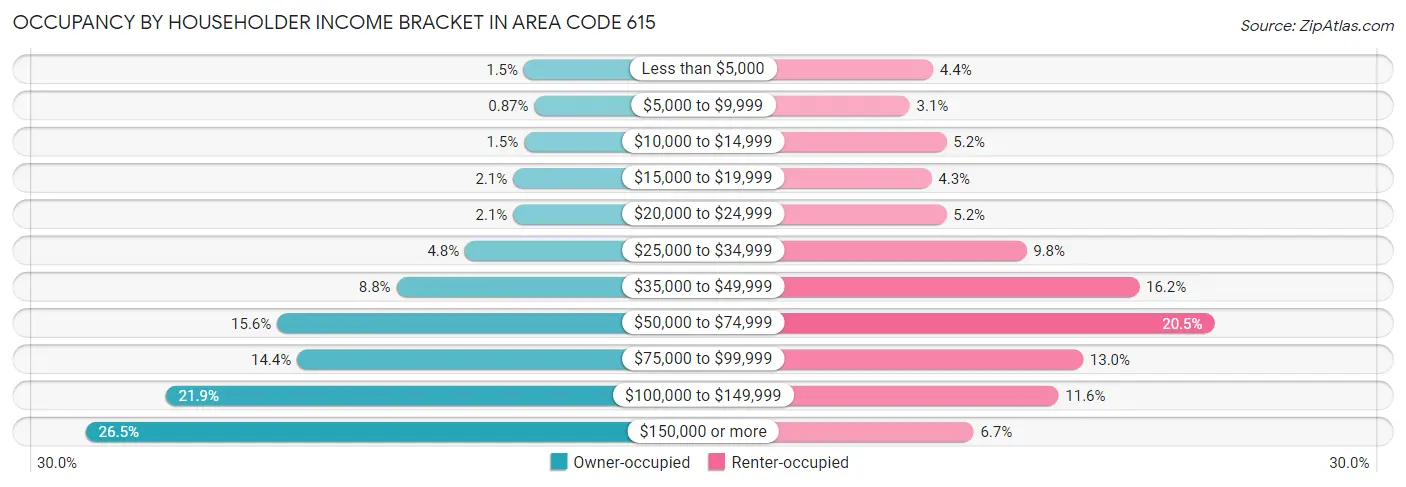
| Income Bracket | Owner-occupied | Renter-occupied |
| Less than $5,000 | 7,886 (1.5%) | 12,310 (4.4%) |
| $5,000 to $9,999 | 4,656 (0.9%) | 8,618 (3.1%) |
| $10,000 to $14,999 | 7,853 (1.5%) | 14,470 (5.2%) |
| $15,000 to $19,999 | 11,232 (2.1%) | 12,076 (4.3%) |
| $20,000 to $24,999 | 11,140 (2.1%) | 14,458 (5.2%) |
| $25,000 to $34,999 | 25,920 (4.8%) | 27,167 (9.8%) |
| $35,000 to $49,999 | 46,947 (8.7%) | 45,172 (16.2%) |
| $50,000 to $74,999 | 83,549 (15.6%) | 57,153 (20.5%) |
| $75,000 to $99,999 | 77,456 (14.4%) | 36,224 (13.0%) |
| $100,000 to $149,999 | 117,718 (21.9%) | 32,312 (11.6%) |
| $150,000 or more | 142,232 (26.5%) | 18,801 (6.7%) |
| Total | 536,589 (100.0%) | 278,761 (100.0%) |
Monthly Housing Cost Tiers in Area Code 615
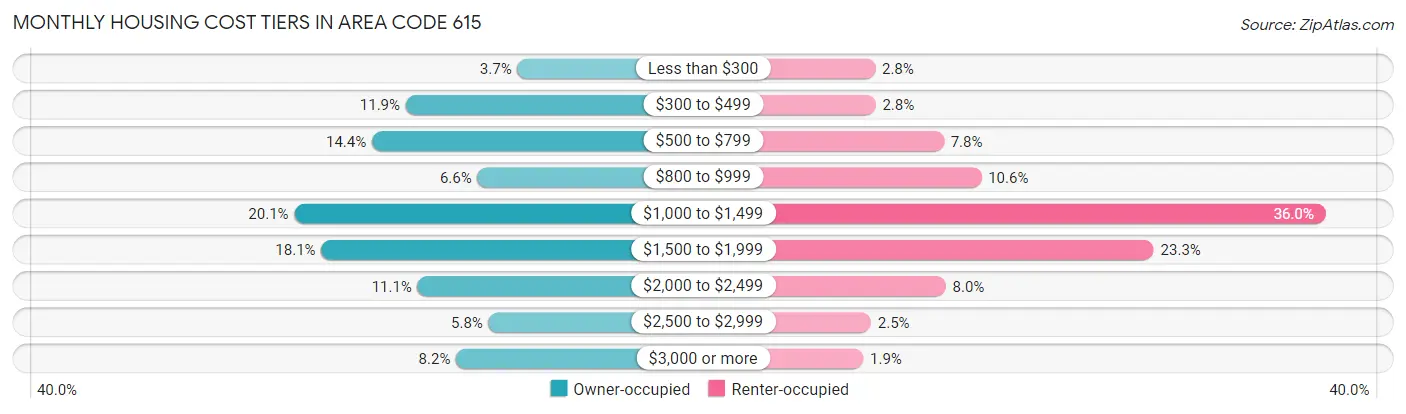
| Monthly Cost | Owner-occupied | Renter-occupied |
| Less than $300 | 19,843 (3.7%) | 7,726 (2.8%) |
| $300 to $499 | 63,946 (11.9%) | 7,818 (2.8%) |
| $500 to $799 | 77,298 (14.4%) | 21,830 (7.8%) |
| $800 to $999 | 35,615 (6.6%) | 29,511 (10.6%) |
| $1,000 to $1,499 | 108,008 (20.1%) | 100,251 (36.0%) |
| $1,500 to $1,999 | 97,324 (18.1%) | 64,927 (23.3%) |
| $2,000 to $2,499 | 59,269 (11.1%) | 22,225 (8.0%) |
| $2,500 to $2,999 | 31,251 (5.8%) | 6,864 (2.5%) |
| $3,000 or more | 44,035 (8.2%) | 5,255 (1.9%) |
| Total | 536,589 (100.0%) | 278,761 (100.0%) |
Physical Housing Characteristics in Area Code 615
Housing Structures in Area Code 615
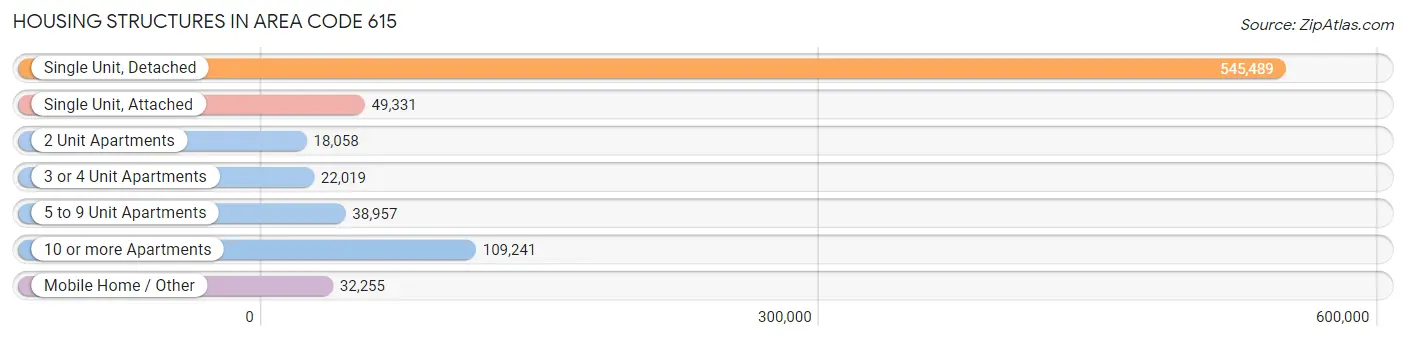
| Structure Type | # Housing Units | % Housing Units |
| Single Unit, Detached | 545,489 | 66.9% |
| Single Unit, Attached | 49,331 | 6.0% |
| 2 Unit Apartments | 18,058 | 2.2% |
| 3 or 4 Unit Apartments | 22,019 | 2.7% |
| 5 to 9 Unit Apartments | 38,957 | 4.8% |
| 10 or more Apartments | 109,241 | 13.4% |
| Mobile Home / Other | 32,255 | 4.0% |
| Total | 815,350 | 100.0% |
Housing Structures by Occupancy in Area Code 615
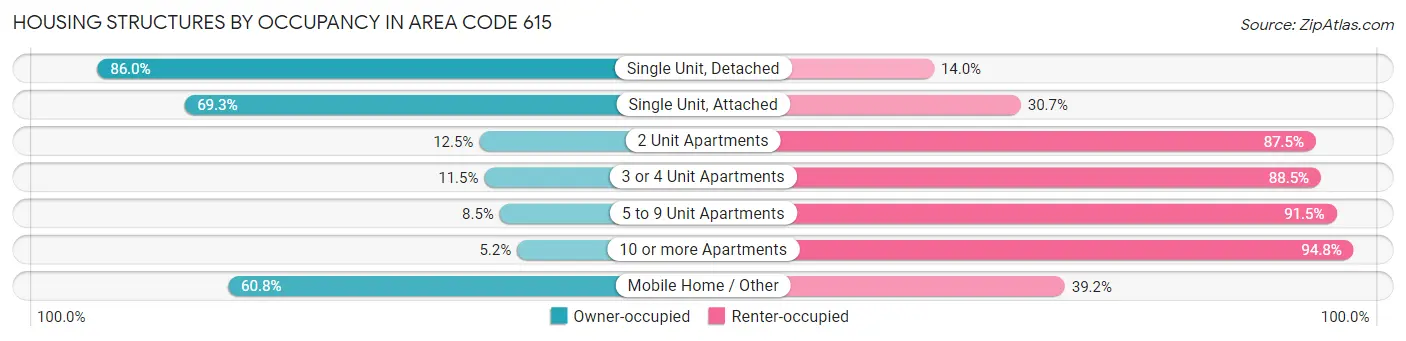
| Structure Type | Owner-occupied | Renter-occupied |
| Single Unit, Detached | 469,045 (86.0%) | 76,444 (14.0%) |
| Single Unit, Attached | 34,167 (69.3%) | 15,164 (30.7%) |
| 2 Unit Apartments | 2,252 (12.5%) | 15,806 (87.5%) |
| 3 or 4 Unit Apartments | 2,530 (11.5%) | 19,489 (88.5%) |
| 5 to 9 Unit Apartments | 3,323 (8.5%) | 35,634 (91.5%) |
| 10 or more Apartments | 5,662 (5.2%) | 103,579 (94.8%) |
| Mobile Home / Other | 19,610 (60.8%) | 12,645 (39.2%) |
| Total | 536,589 (65.8%) | 278,761 (34.2%) |
Housing Structures by Number of Rooms in Area Code 615
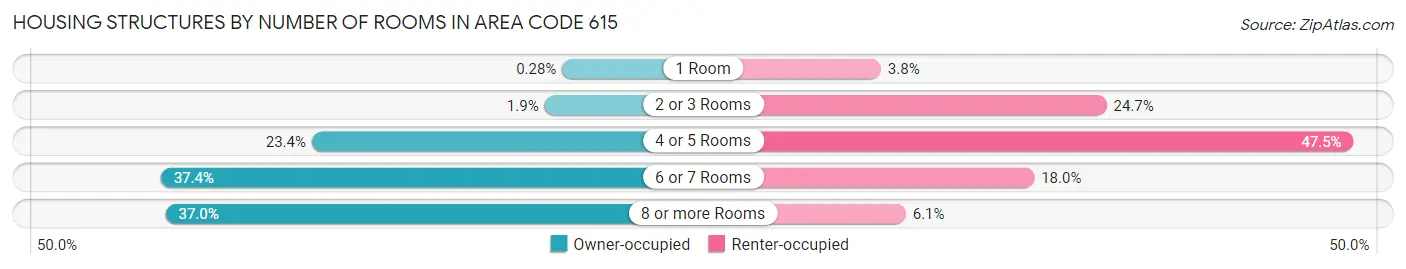
| Number of Rooms | Owner-occupied | Renter-occupied |
| 1 Room | 1,476 (0.3%) | 10,561 (3.8%) |
| 2 or 3 Rooms | 10,297 (1.9%) | 68,741 (24.7%) |
| 4 or 5 Rooms | 125,769 (23.4%) | 132,375 (47.5%) |
| 6 or 7 Rooms | 200,729 (37.4%) | 50,105 (18.0%) |
| 8 or more Rooms | 198,318 (37.0%) | 16,979 (6.1%) |
| Total | 536,589 (100.0%) | 278,761 (100.0%) |
Housing Structure by Heating Type in Area Code 615
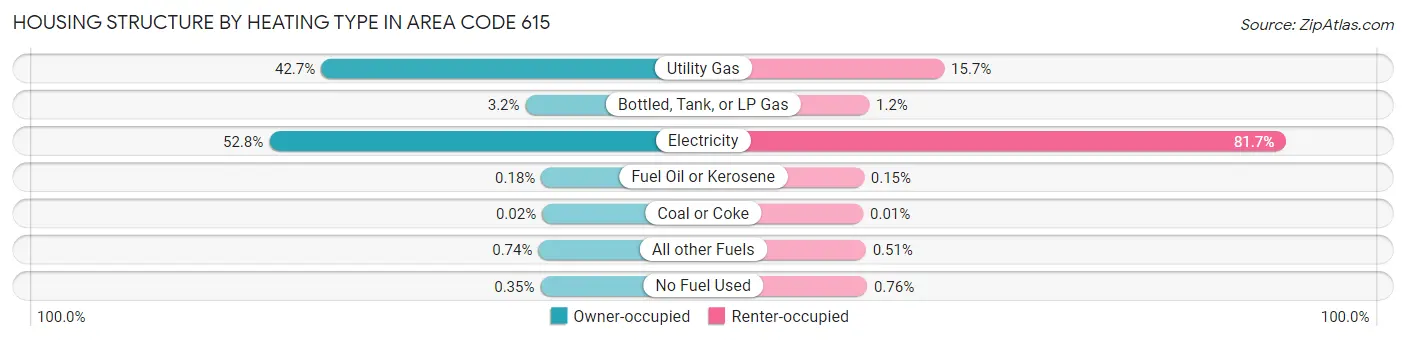
| Heating Type | Owner-occupied | Renter-occupied |
| Utility Gas | 229,236 (42.7%) | 43,691 (15.7%) |
| Bottled, Tank, or LP Gas | 17,357 (3.2%) | 3,255 (1.2%) |
| Electricity | 283,095 (52.8%) | 227,827 (81.7%) |
| Fuel Oil or Kerosene | 979 (0.2%) | 432 (0.2%) |
| Coal or Coke | 82 (0.0%) | 32 (0.0%) |
| All other Fuels | 3,973 (0.7%) | 1,416 (0.5%) |
| No Fuel Used | 1,867 (0.4%) | 2,108 (0.8%) |
| Total | 536,589 (100.0%) | 278,761 (100.0%) |
Household Vehicle Usage in Area Code 615
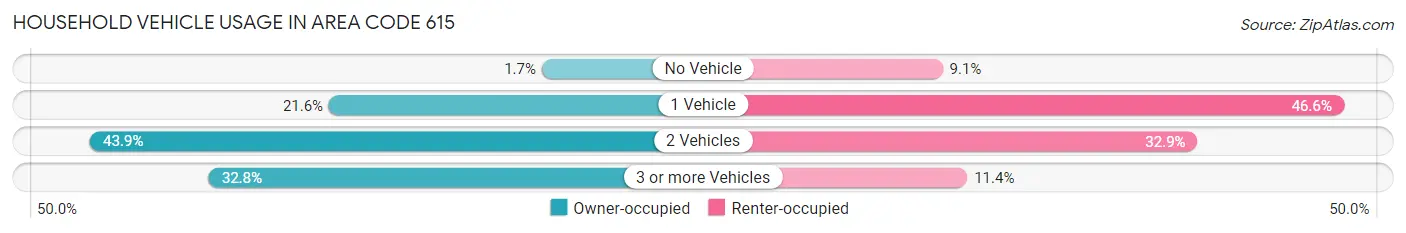
| Vehicles per Household | Owner-occupied | Renter-occupied |
| No Vehicle | 9,218 (1.7%) | 25,424 (9.1%) |
| 1 Vehicle | 115,833 (21.6%) | 129,778 (46.6%) |
| 2 Vehicles | 235,535 (43.9%) | 91,722 (32.9%) |
| 3 or more Vehicles | 176,003 (32.8%) | 31,837 (11.4%) |
| Total | 536,589 (100.0%) | 278,761 (100.0%) |
Real Estate & Mortgages in Area Code 615
Real Estate and Mortgage Overview in Area Code 615
| Characteristic | Without Mortgage | With Mortgage |
| Housing Units | 175,601 | 360,988 |
| Median Property Value | $30,294,400 | $33,313,600 |
| Median Household Income | $6,791,744 | $108,476 |
| Monthly Housing Costs | $51,078 | $43,221 |
| Real Estate Taxes | $178,083 | $10,209 |
Property Value by Mortgage Status in Area Code 615
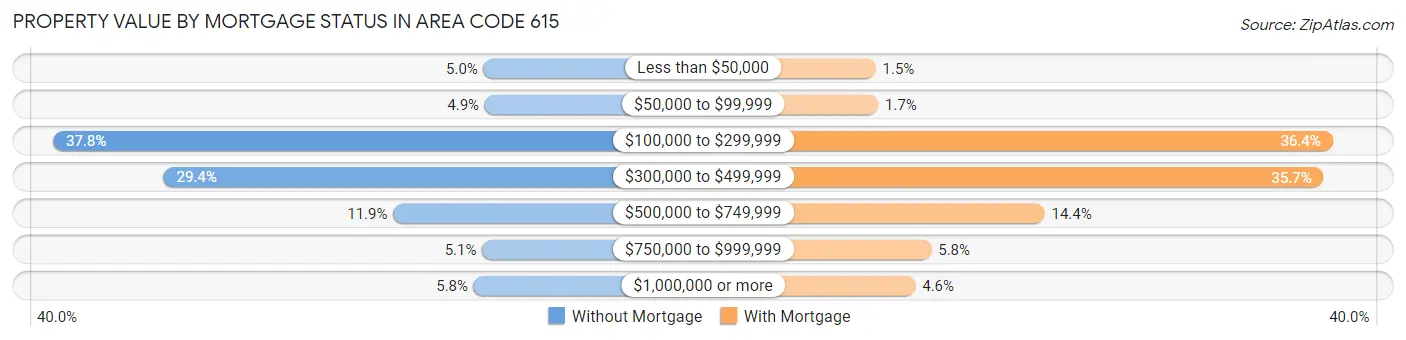
| Property Value | Without Mortgage | With Mortgage |
| Less than $50,000 | 8,823 (5.0%) | 5,540 (1.5%) |
| $50,000 to $99,999 | 8,664 (4.9%) | 6,215 (1.7%) |
| $100,000 to $299,999 | 66,425 (37.8%) | 131,222 (36.3%) |
| $300,000 to $499,999 | 51,638 (29.4%) | 128,741 (35.7%) |
| $500,000 to $749,999 | 20,910 (11.9%) | 51,987 (14.4%) |
| $750,000 to $999,999 | 9,004 (5.1%) | 20,842 (5.8%) |
| $1,000,000 or more | 10,137 (5.8%) | 16,441 (4.5%) |
| Total | 175,601 (100.0%) | 360,988 (100.0%) |
Household Income by Mortgage Status in Area Code 615
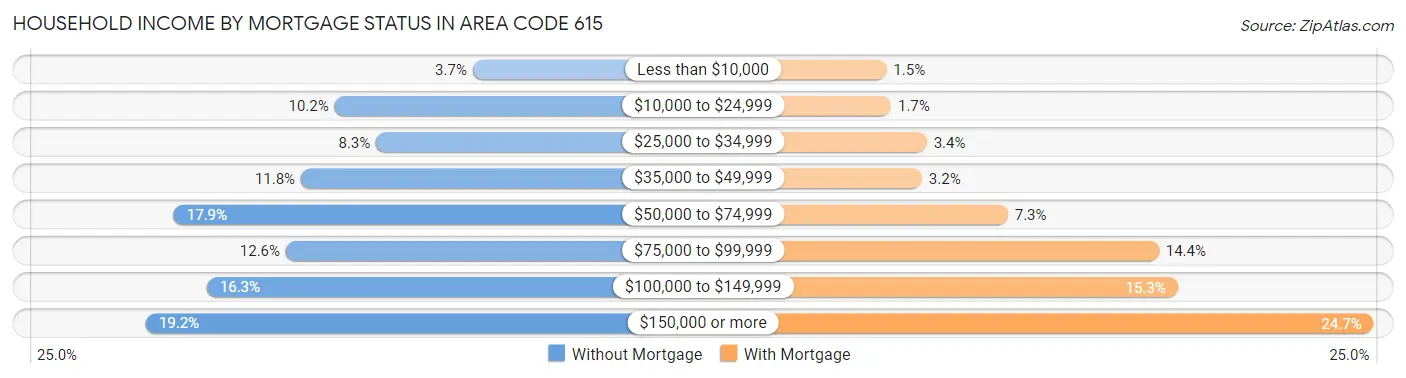
| Household Income | Without Mortgage | With Mortgage |
| Less than $10,000 | 6,429 (3.7%) | 5,306 (1.5%) |
| $10,000 to $24,999 | 17,980 (10.2%) | 6,113 (1.7%) |
| $25,000 to $34,999 | 14,508 (8.3%) | 12,245 (3.4%) |
| $35,000 to $49,999 | 20,788 (11.8%) | 11,412 (3.2%) |
| $50,000 to $74,999 | 31,411 (17.9%) | 26,159 (7.2%) |
| $75,000 to $99,999 | 22,064 (12.6%) | 52,138 (14.4%) |
| $100,000 to $149,999 | 28,665 (16.3%) | 55,392 (15.3%) |
| $150,000 or more | 33,756 (19.2%) | 89,053 (24.7%) |
| Total | 175,601 (100.0%) | 360,988 (100.0%) |
Property Value to Household Income Ratio in Area Code 615
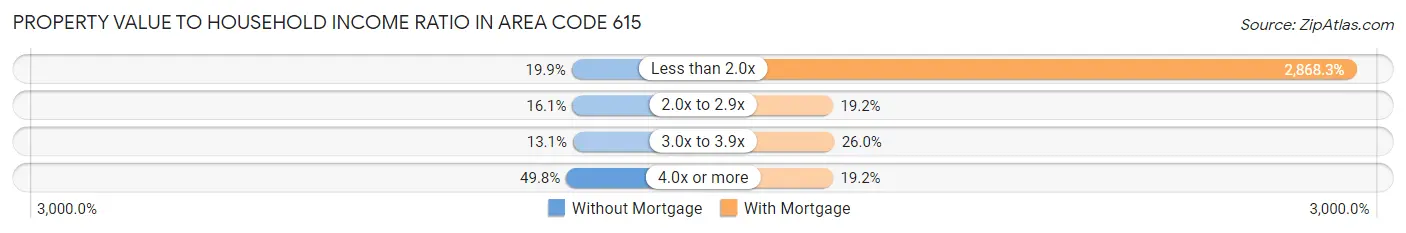
| Value-to-Income Ratio | Without Mortgage | With Mortgage |
| Less than 2.0x | 35,019 (19.9%) | 10,354,210 (2,868.3%) |
| 2.0x to 2.9x | 28,199 (16.1%) | 69,281 (19.2%) |
| 3.0x to 3.9x | 23,030 (13.1%) | 93,842 (26.0%) |
| 4.0x or more | 87,380 (49.8%) | 69,349 (19.2%) |
| Total | 175,601 (100.0%) | 360,988 (100.0%) |
Real Estate Taxes by Mortgage Status in Area Code 615
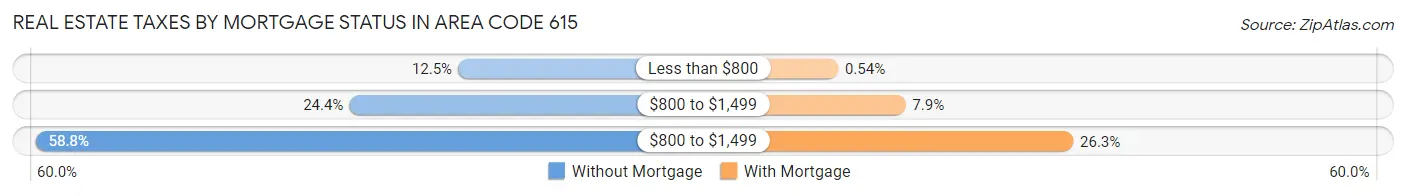
| Property Taxes | Without Mortgage | With Mortgage |
| Less than $800 | 21,976 (12.5%) | 1,965 (0.5%) |
| $800 to $1,499 | 42,898 (24.4%) | 28,623 (7.9%) |
| $800 to $1,499 | 103,229 (58.8%) | 94,973 (26.3%) |
| Total | 175,601 (100.0%) | 360,988 (100.0%) |
Health & Disability in Area Code 615
Health Insurance Coverage by Age in Area Code 615
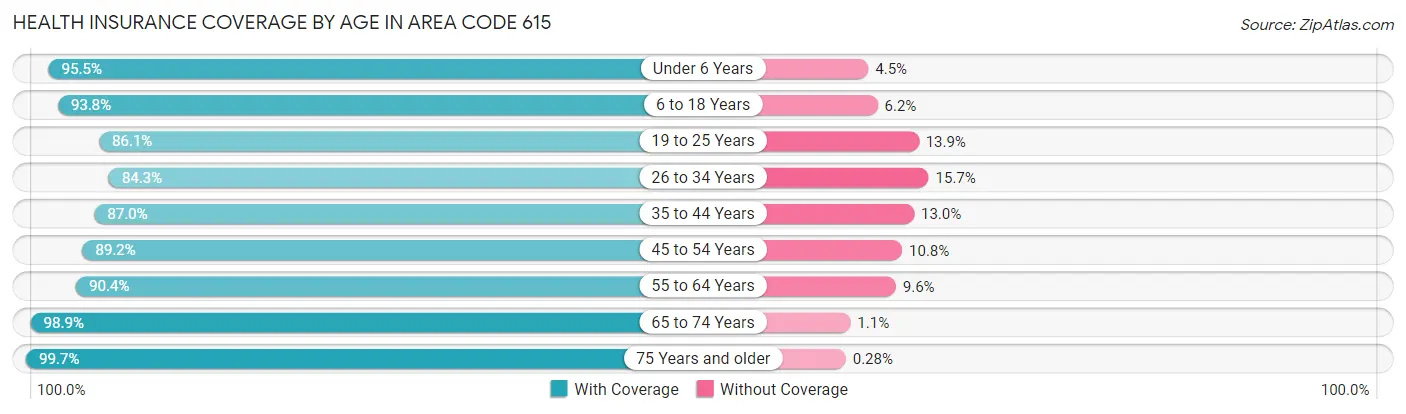
| Age Bracket | With Coverage | Without Coverage |
| Under 6 Years | 148,556 (95.5%) | 6,967 (4.5%) |
| 6 to 18 Years | 333,514 (93.8%) | 22,067 (6.2%) |
| 19 to 25 Years | 173,107 (86.1%) | 27,888 (13.9%) |
| 26 to 34 Years | 241,182 (84.3%) | 44,989 (15.7%) |
| 35 to 44 Years | 253,556 (87.0%) | 37,921 (13.0%) |
| 45 to 54 Years | 236,818 (89.2%) | 28,602 (10.8%) |
| 55 to 64 Years | 227,998 (90.4%) | 24,238 (9.6%) |
| 65 to 74 Years | 172,924 (98.9%) | 1,993 (1.1%) |
| 75 Years and older | 105,063 (99.7%) | 300 (0.3%) |
| Total | 1,892,718 (90.7%) | 194,965 (9.3%) |
Health Insurance Coverage by Citizenship Status in Area Code 615
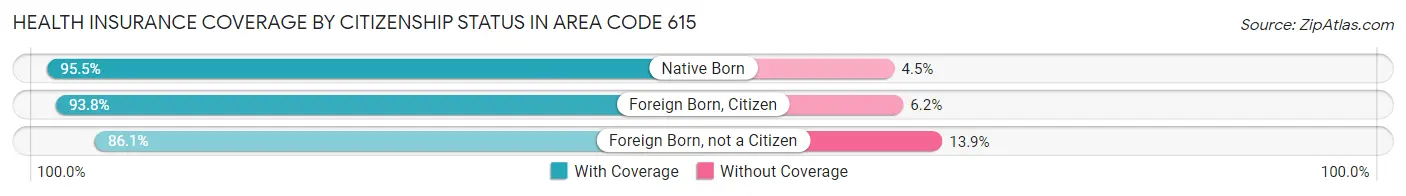
| Citizenship Status | With Coverage | Without Coverage |
| Native Born | 148,556 (95.5%) | 6,967 (4.5%) |
| Foreign Born, Citizen | 333,514 (93.8%) | 22,067 (6.2%) |
| Foreign Born, not a Citizen | 173,107 (86.1%) | 27,888 (13.9%) |
Health Insurance Coverage by Household Income in Area Code 615
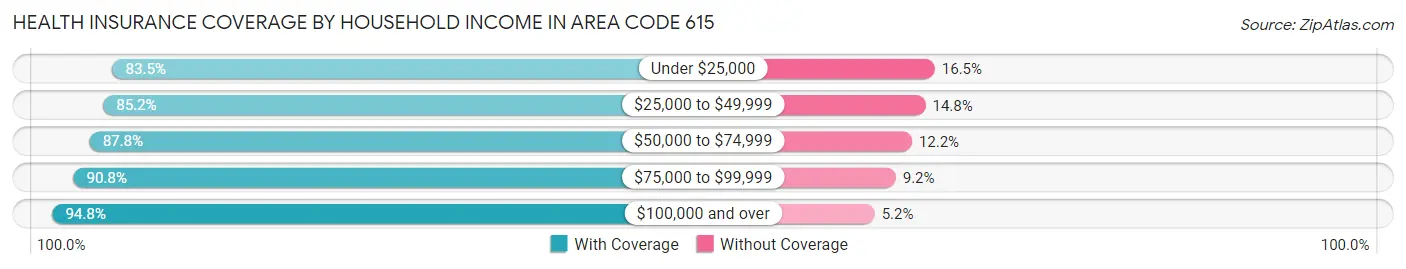
| Household Income | With Coverage | Without Coverage |
| Under $25,000 | 159,601 (83.5%) | 31,549 (16.5%) |
| $25,000 to $49,999 | 253,419 (85.2%) | 43,894 (14.8%) |
| $50,000 to $74,999 | 282,950 (87.8%) | 39,363 (12.2%) |
| $75,000 to $99,999 | 276,820 (90.8%) | 27,967 (9.2%) |
| $100,000 and over | 900,813 (94.8%) | 49,699 (5.2%) |
Public vs Private Health Insurance Coverage by Age in Area Code 615
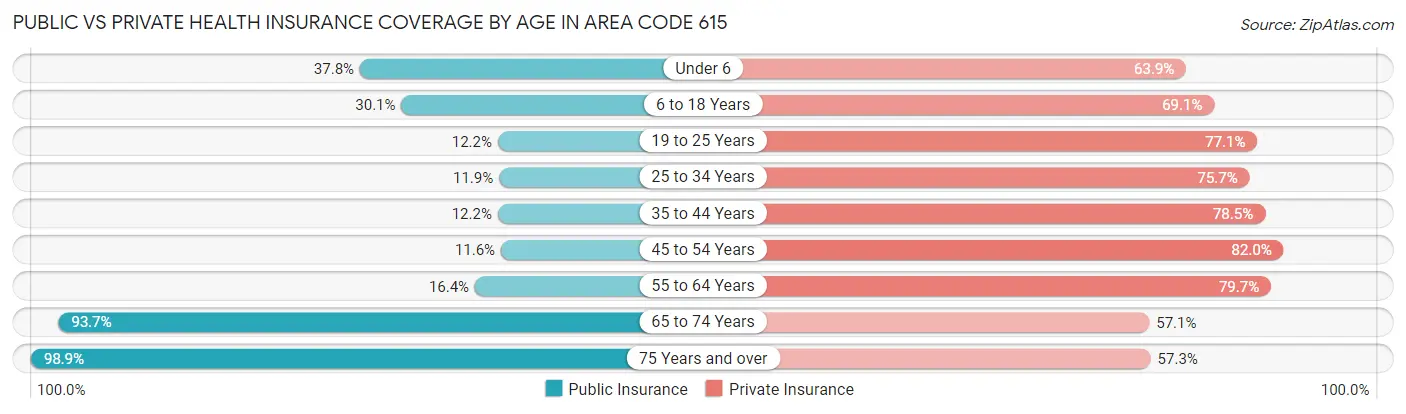
| Age Bracket | Public Insurance | Private Insurance |
| Under 6 | 58,724 (37.8%) | 99,391 (63.9%) |
| 6 to 18 Years | 106,920 (30.1%) | 245,778 (69.1%) |
| 19 to 25 Years | 24,467 (12.2%) | 155,016 (77.1%) |
| 25 to 34 Years | 34,144 (11.9%) | 216,570 (75.7%) |
| 35 to 44 Years | 35,505 (12.2%) | 228,917 (78.5%) |
| 45 to 54 Years | 30,725 (11.6%) | 217,672 (82.0%) |
| 55 to 64 Years | 41,382 (16.4%) | 200,922 (79.7%) |
| 65 to 74 Years | 163,963 (93.7%) | 99,819 (57.1%) |
| 75 Years and over | 104,152 (98.9%) | 60,407 (57.3%) |
| Total | 599,982 (28.7%) | 1,524,492 (73.0%) |
Disability Status by Sex by Age in Area Code 615
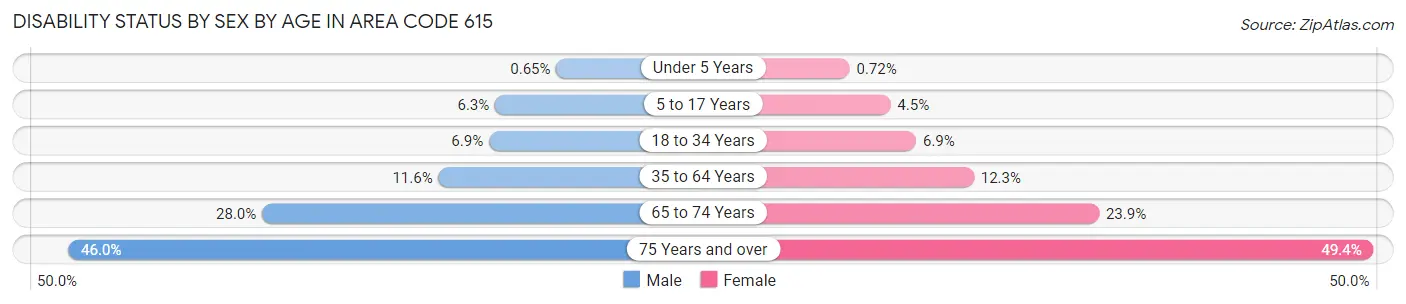
| Age Bracket | Male | Female |
| Under 5 Years | 434 (0.6%) | 458 (0.7%) |
| 5 to 17 Years | 11,388 (6.3%) | 7,776 (4.5%) |
| 18 to 34 Years | 17,487 (6.9%) | 18,026 (6.9%) |
| 35 to 64 Years | 46,108 (11.6%) | 50,393 (12.2%) |
| 65 to 74 Years | 22,764 (28.0%) | 22,315 (23.9%) |
| 75 Years and over | 19,683 (46.0%) | 30,860 (49.3%) |
Disability Class by Sex by Age in Area Code 615
Disability Class: Hearing Difficulty
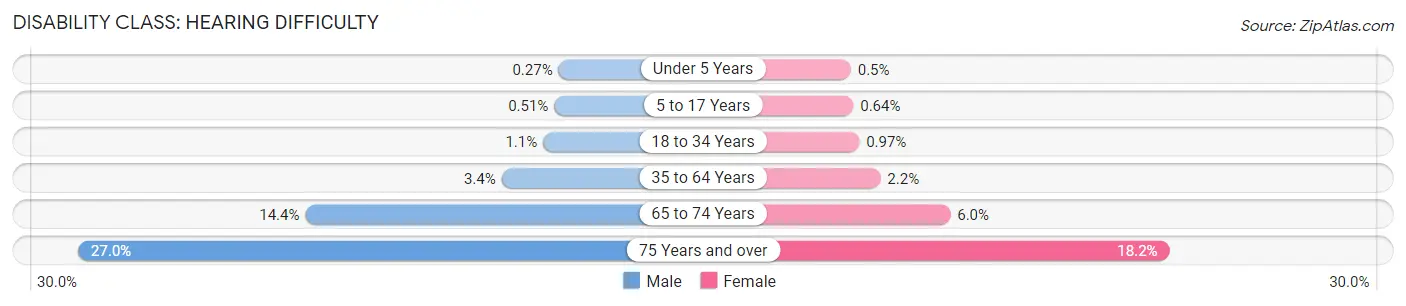
| Age Bracket | Male | Female |
| Under 5 Years | 180 (0.3%) | 316 (0.5%) |
| 5 to 17 Years | 921 (0.5%) | 1,113 (0.6%) |
| 18 to 34 Years | 2,855 (1.1%) | 2,527 (1.0%) |
| 35 to 64 Years | 13,686 (3.4%) | 8,834 (2.1%) |
| 65 to 74 Years | 11,704 (14.4%) | 5,643 (6.0%) |
| 75 Years and over | 11,577 (27.0%) | 11,406 (18.2%) |
Disability Class: Vision Difficulty
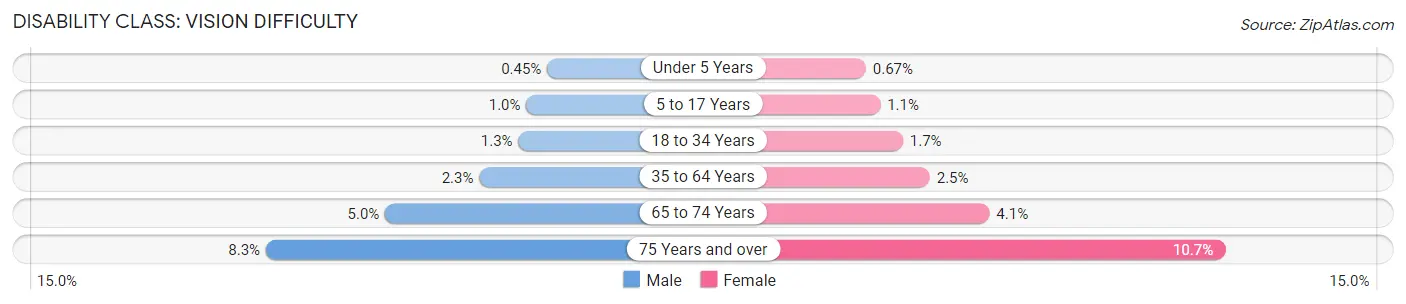
| Age Bracket | Male | Female |
| Under 5 Years | 302 (0.4%) | 426 (0.7%) |
| 5 to 17 Years | 1,860 (1.0%) | 1,849 (1.1%) |
| 18 to 34 Years | 3,169 (1.3%) | 4,462 (1.7%) |
| 35 to 64 Years | 9,313 (2.3%) | 10,072 (2.5%) |
| 65 to 74 Years | 4,038 (5.0%) | 3,844 (4.1%) |
| 75 Years and over | 3,544 (8.3%) | 6,673 (10.7%) |
Disability Class: Cognitive Difficulty
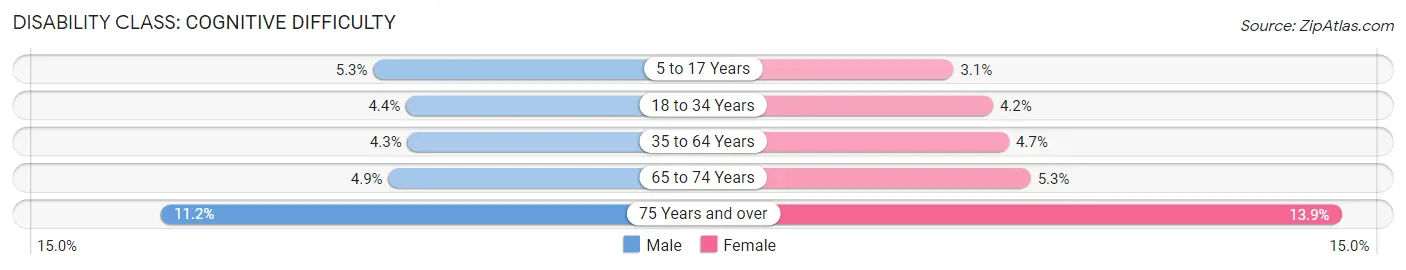
| Age Bracket | Male | Female |
| 5 to 17 Years | 9,518 (5.3%) | 5,366 (3.1%) |
| 18 to 34 Years | 11,093 (4.4%) | 11,018 (4.2%) |
| 35 to 64 Years | 17,262 (4.3%) | 19,173 (4.7%) |
| 65 to 74 Years | 3,968 (4.9%) | 4,916 (5.3%) |
| 75 Years and over | 4,797 (11.2%) | 8,698 (13.9%) |
Disability Class: Ambulatory Difficulty
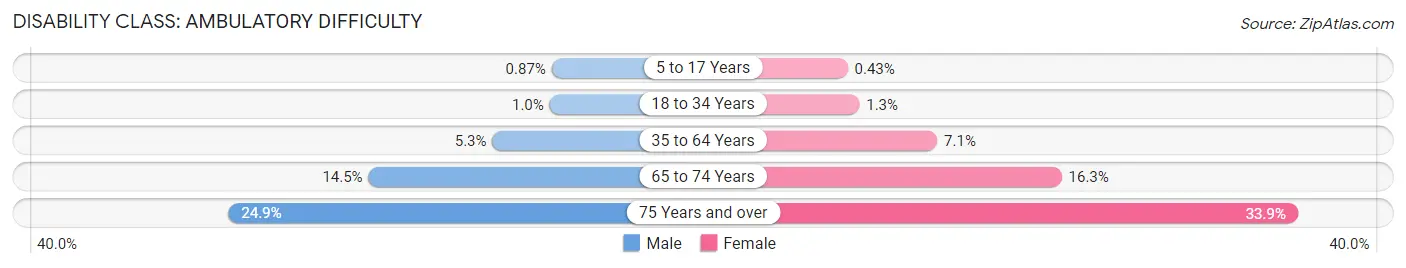
| Age Bracket | Male | Female |
| 5 to 17 Years | 1,574 (0.9%) | 748 (0.4%) |
| 18 to 34 Years | 2,579 (1.0%) | 3,394 (1.3%) |
| 35 to 64 Years | 20,966 (5.3%) | 29,097 (7.1%) |
| 65 to 74 Years | 11,781 (14.5%) | 15,263 (16.3%) |
| 75 Years and over | 10,652 (24.9%) | 21,168 (33.9%) |
Disability Class: Self-Care Difficulty
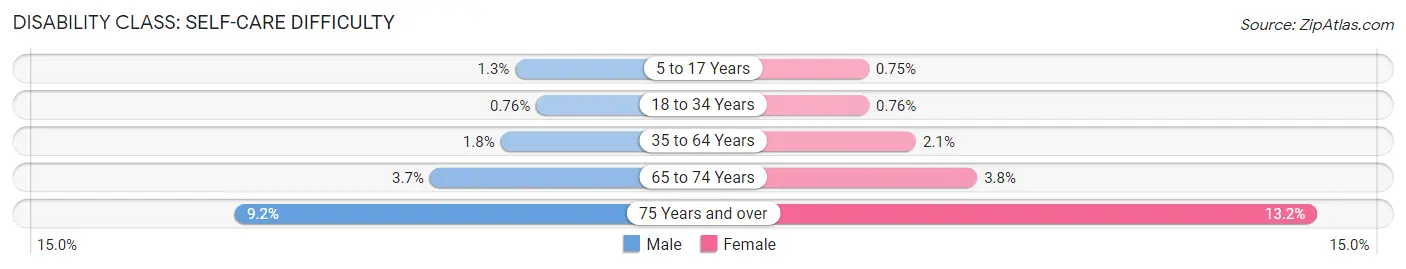
| Age Bracket | Male | Female |
| 5 to 17 Years | 2,409 (1.3%) | 1,294 (0.7%) |
| 18 to 34 Years | 1,921 (0.8%) | 1,996 (0.8%) |
| 35 to 64 Years | 6,978 (1.8%) | 8,518 (2.1%) |
| 65 to 74 Years | 3,028 (3.7%) | 3,523 (3.8%) |
| 75 Years and over | 3,929 (9.2%) | 8,273 (13.2%) |
Technology Access in Area Code 615
Computing Device Access in Area Code 615
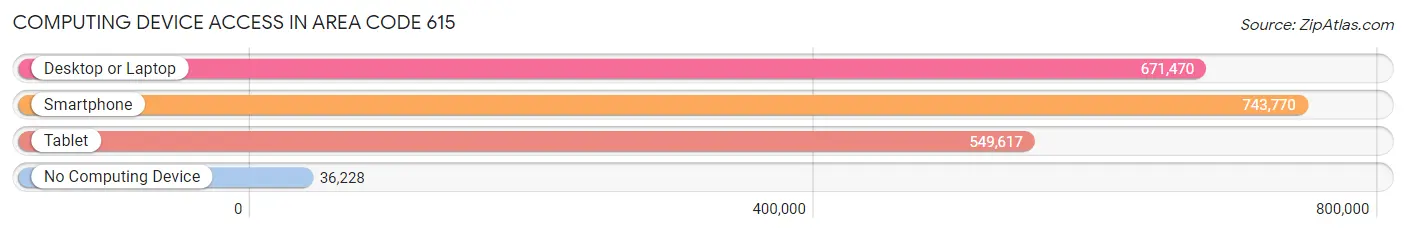
| Device Type | # Households | % Households |
| Desktop or Laptop | 671,470 | 82.4% |
| Smartphone | 743,770 | 91.2% |
| Tablet | 549,617 | 67.4% |
| No Computing Device | 36,228 | 4.4% |
| Total | 815,350 | 100.0% |
Internet Access in Area Code 615
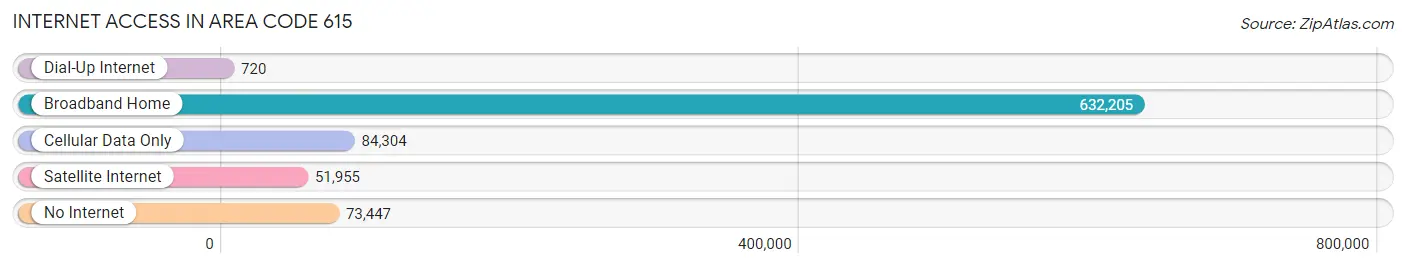
| Internet Type | # Households | % Households |
| Dial-Up Internet | 720 | 0.1% |
| Broadband Home | 632,205 | 77.5% |
| Cellular Data Only | 84,304 | 10.3% |
| Satellite Internet | 51,955 | 6.4% |
| No Internet | 73,447 | 9.0% |
| Total | 815,350 | 100.0% |
Area Code 615 Summary
Geography
Area code 615 is located in the state of Tennessee and covers the Nashville metropolitan area. It is bordered by area codes 423 to the east, 931 to the south, and 629 to the west.
Social
Area code 615 is home to many of the state's most popular attractions, including the Grand Ole Opry, the Country Music Hall of Fame, and the Tennessee State Capitol. It is also home to many of the state's most popular music venues, including the Ryman Auditorium and the Bridgestone Arena.
Economics
Area code 615 is home to many of the state's largest employers, including Vanderbilt University, HCA Healthcare, and Nissan North America. It is also home to many of the state's largest companies, including Bridgestone, Dollar General, and Dollar Tree.
Demographics
Area code 615 is home to a diverse population, with a median age of 35.7 years. The population is predominantly white, with African Americans making up the second largest racial group. The median household income is $50,835, and the median home value is $223,400.
Common Questions
What is Per Capita Income in Area Code 615?
Per Capita income in Area Code 615 is $40,949.
What is the Median Family Income in Area Code 615?
Median Family Income in Area Code 615 is $98,008.
What is the Median Household income in Area Code 615?
Median Household Income in Area Code 615 is $80,306.
What is Income or Wage Gap in Area Code 615?
Income or Wage Gap in Area Code 615 is 28.2%.
Women in Area Code 615 earn 71.8 cents for every dollar earned by a man.
What is Family Income Deficit in Area Code 615?
Family Income Deficit in Area Code 615 is $10,726.
Families that are below poverty line in Area Code 615 earn $10,726 less on average than the poverty threshold level.
What is Inequality or Gini Index in Area Code 615?
Inequality or Gini Index in Area Code 615 is 42.98.
What is the Total Population of Area Code 615?
Total Population of Area Code 615 is 2,110,036.
What is the Total Male Population of Area Code 615?
Total Male Population of Area Code 615 is 1,038,002.
What is the Total Female Population of Area Code 615?
Total Female Population of Area Code 615 is 1,072,034.
What is the Ratio of Males per 100 Females in Area Code 615?
There are 96.83 Males per 100 Females in Area Code 615.
What is the Ratio of Females per 100 Males in Area Code 615?
There are 103.28 Females per 100 Males in Area Code 615.
What is the Median Population Age in Area Code 615?
Median Population Age in Area Code 615 is 39.0 Years.
What is the Average Family Size in Area Code 615
Average Family Size in Area Code 615 is 3.1 People.
What is the Average Household Size in Area Code 615
Average Household Size in Area Code 615 is 2.6 People.
How Large is the Labor Force in Area Code 615?
There are 1,080,562 People in the Labor Forcein in Area Code 615.
What is the Percentage of People in the Labor Force in Area Code 615?
64.2% of People are in the Labor Force in Area Code 615.
What is the Unemployment Rate in Area Code 615?
Unemployment Rate in Area Code 615 is 4.0%.