Trousdale County, TN Map & Demographics
Trousdale County Map
Trousdale County Overview
$26,522
PER CAPITA INCOME
$65,857
AVG FAMILY INCOME
$62,018
AVG HOUSEHOLD INCOME
12.8%
WAGE / INCOME GAP [ % ]
87.2¢/ $1
WAGE / INCOME GAP [ $ ]
0.39
INEQUALITY / GINI INDEX
11,596
TOTAL POPULATION
7,204
MALE POPULATION
4,392
FEMALE POPULATION
164.03
MALES / 100 FEMALES
60.97
FEMALES / 100 MALES
34.6
MEDIAN AGE
3.2
AVG FAMILY SIZE
2.6
AVG HOUSEHOLD SIZE
5,164
LABOR FORCE [ PEOPLE ]
52.2%
PERCENT IN LABOR FORCE
0.8%
UNEMPLOYMENT RATE
Trousdale County Area Codes
Income in Trousdale County
Income Overview in Trousdale County
Per Capita Income in Trousdale County is $26,522, while median incomes of families and households are $65,857 and $62,018 respectively.
| Characteristic | Number | Measure |
| Per Capita Income | 11,596 | $26,522 |
| Median Family Income | 2,406 | $65,857 |
| Mean Family Income | 2,406 | $82,618 |
| Median Household Income | 3,552 | $62,018 |
| Mean Household Income | 3,552 | $71,397 |
| Income Deficit | 2,406 | $0 |
| Wage / Income Gap (%) | 11,596 | 12.80% |
| Wage / Income Gap ($) | 11,596 | 87.20¢ per $1 |
| Gini / Inequality Index | 11,596 | 0.39 |
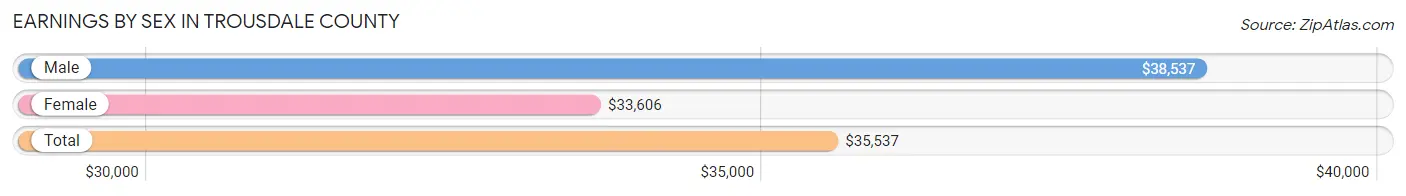
Earnings by Sex in Trousdale County
Average Earnings in Trousdale County are $35,537, $38,537 for men and $33,606 for women, a difference of 12.8%.
| Sex | Number | Average Earnings |
| Male | 3,428 (58.5%) | $38,537 |
| Female | 2,428 (41.5%) | $33,606 |
| Total | 5,856 (100.0%) | $35,537 |
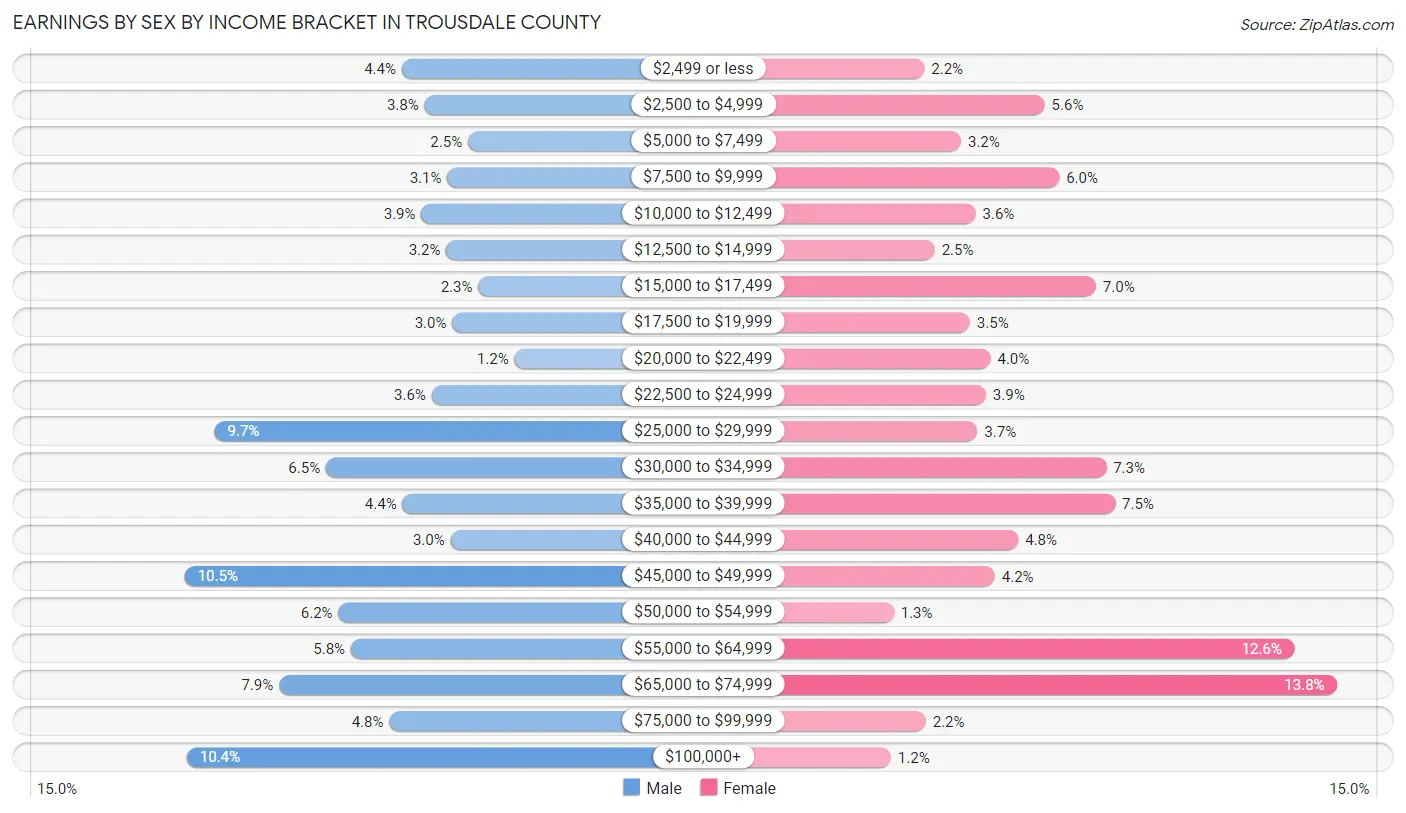
Earnings by Sex by Income Bracket in Trousdale County
The most common earnings brackets in Trousdale County are $45,000 to $49,999 for men (360 | 10.5%) and $65,000 to $74,999 for women (334 | 13.8%).
| Income | Male | Female |
| $2,499 or less | 151 (4.4%) | 53 (2.2%) |
| $2,500 to $4,999 | 129 (3.8%) | 135 (5.6%) |
| $5,000 to $7,499 | 87 (2.5%) | 78 (3.2%) |
| $7,500 to $9,999 | 107 (3.1%) | 145 (6.0%) |
| $10,000 to $12,499 | 132 (3.8%) | 88 (3.6%) |
| $12,500 to $14,999 | 108 (3.2%) | 60 (2.5%) |
| $15,000 to $17,499 | 77 (2.2%) | 170 (7.0%) |
| $17,500 to $19,999 | 102 (3.0%) | 84 (3.5%) |
| $20,000 to $22,499 | 42 (1.2%) | 98 (4.0%) |
| $22,500 to $24,999 | 122 (3.6%) | 95 (3.9%) |
| $25,000 to $29,999 | 331 (9.7%) | 89 (3.7%) |
| $30,000 to $34,999 | 224 (6.5%) | 177 (7.3%) |
| $35,000 to $39,999 | 150 (4.4%) | 183 (7.5%) |
| $40,000 to $44,999 | 104 (3.0%) | 117 (4.8%) |
| $45,000 to $49,999 | 360 (10.5%) | 101 (4.2%) |
| $50,000 to $54,999 | 212 (6.2%) | 32 (1.3%) |
| $55,000 to $64,999 | 200 (5.8%) | 305 (12.6%) |
| $65,000 to $74,999 | 269 (7.9%) | 334 (13.8%) |
| $75,000 to $99,999 | 163 (4.8%) | 54 (2.2%) |
| $100,000+ | 358 (10.4%) | 30 (1.2%) |
| Total | 3,428 (100.0%) | 2,428 (100.0%) |
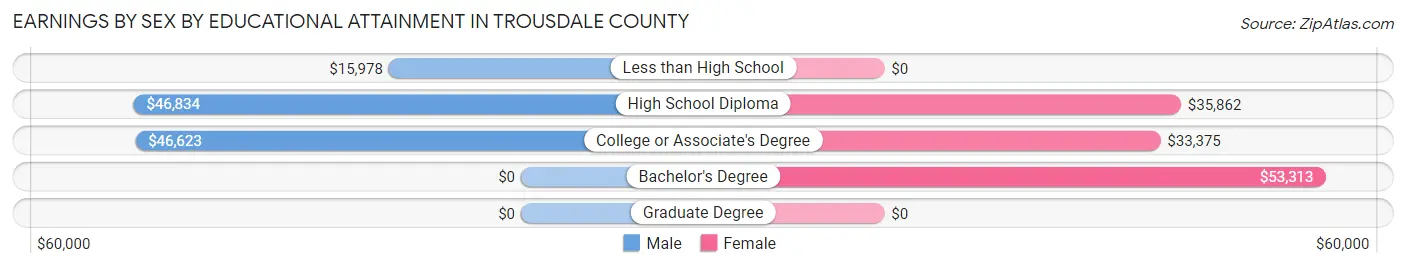
Earnings by Sex by Educational Attainment in Trousdale County
Average earnings in Trousdale County are $46,977 for men and $35,995 for women, a difference of 23.4%. Men with an educational attainment of high school diploma enjoy the highest average annual earnings of $46,834, while those with less than high school education earn the least with $15,978. Women with an educational attainment of bachelor's degree earn the most with the average annual earnings of $53,313, while those with college or associate's degree education have the smallest earnings of $33,375.
| Educational Attainment | Male Income | Female Income |
| Less than High School | $15,978 | $0 |
| High School Diploma | $46,834 | $35,862 |
| College or Associate's Degree | $46,623 | $33,375 |
| Bachelor's Degree | - | - |
| Graduate Degree | - | - |
| Total | $46,977 | $35,995 |
Family Income in Trousdale County
Family Income Brackets in Trousdale County
According to the Trousdale County family income data, there are 688 families falling into the $100,000 to $149,999 income range, which is the most common income bracket and makes up 28.6% of all families. Conversely, the $10,000 to $14,999 income bracket is the least frequent group with only 7 families (0.3%) belonging to this category.
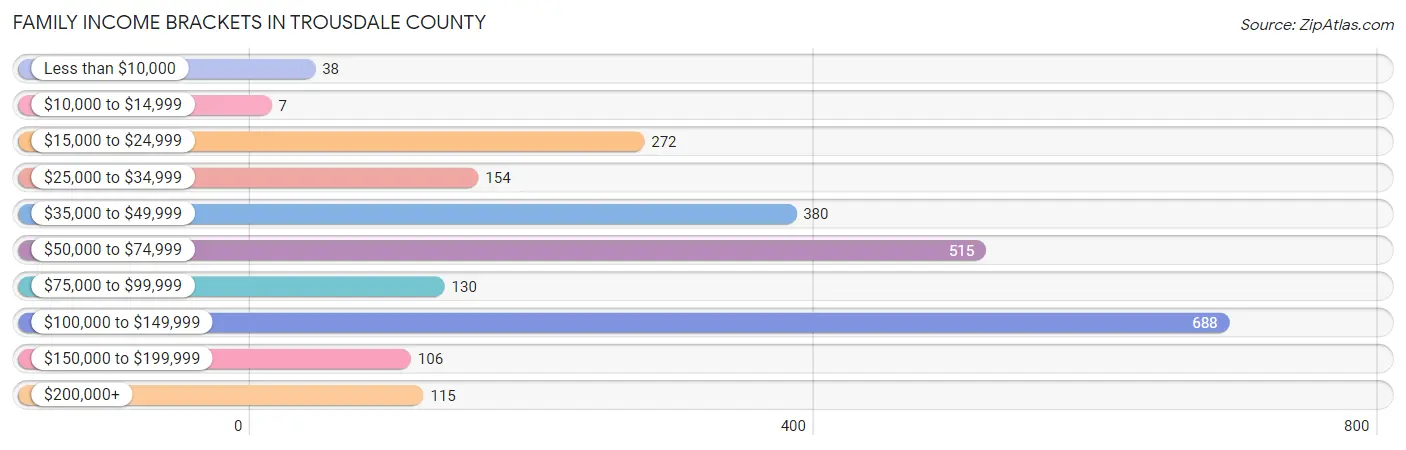
| Income Bracket | # Families | % Families |
| Less than $10,000 | 38 | 1.6% |
| $10,000 to $14,999 | 7 | 0.3% |
| $15,000 to $24,999 | 272 | 11.3% |
| $25,000 to $34,999 | 154 | 6.4% |
| $35,000 to $49,999 | 380 | 15.8% |
| $50,000 to $74,999 | 515 | 21.4% |
| $75,000 to $99,999 | 130 | 5.4% |
| $100,000 to $149,999 | 688 | 28.6% |
| $150,000 to $199,999 | 106 | 4.4% |
| $200,000+ | 115 | 4.8% |
Family Income by Famaliy Size in Trousdale County
3-person families (545 | 22.7%) account for the highest median family income in Trousdale County with $104,115 per family, while 3-person families (545 | 22.7%) have the highest median income of $34,705 per family member.
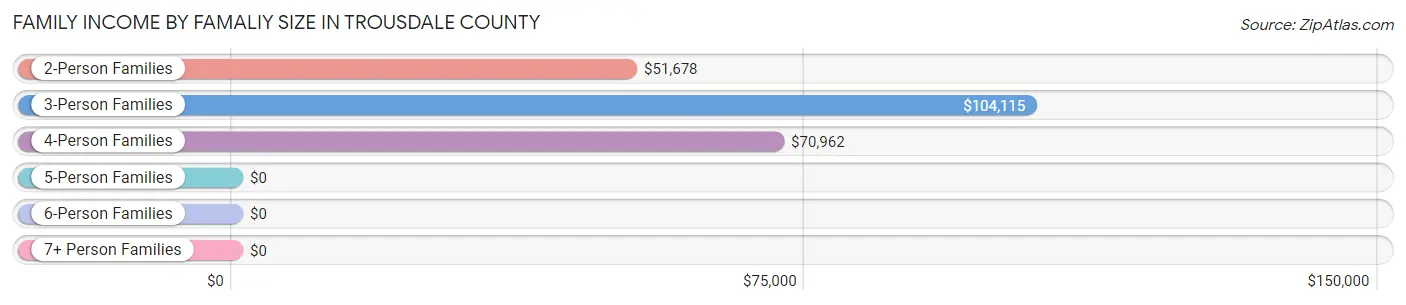
| Income Bracket | # Families | Median Income |
| 2-Person Families | 1,241 (51.6%) | $51,678 |
| 3-Person Families | 545 (22.7%) | $104,115 |
| 4-Person Families | 270 (11.2%) | $70,962 |
| 5-Person Families | 323 (13.4%) | $0 |
| 6-Person Families | 20 (0.8%) | $0 |
| 7+ Person Families | 7 (0.3%) | $0 |
| Total | 2,406 (100.0%) | $65,857 |
Family Income by Number of Earners in Trousdale County
The median family income in Trousdale County is $65,857, with families comprising 3+ earners (311) having the highest median family income of $110,438, while families with no earners (395) have the lowest median family income of $28,750, accounting for 12.9% and 16.4% of families, respectively.
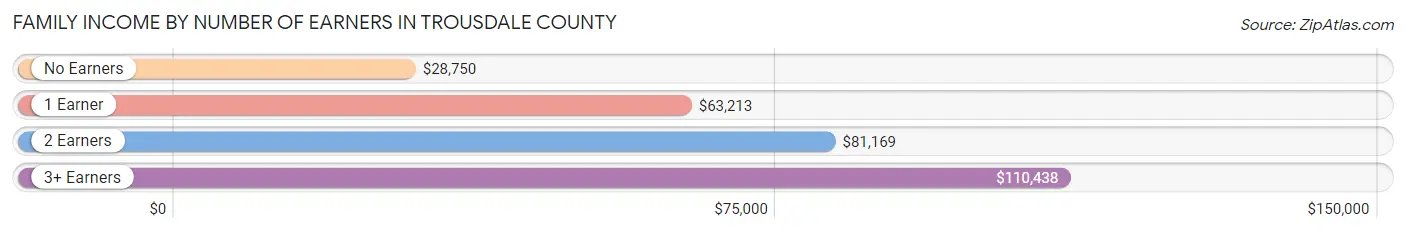
| Number of Earners | # Families | Median Income |
| No Earners | 395 (16.4%) | $28,750 |
| 1 Earner | 853 (35.4%) | $63,213 |
| 2 Earners | 847 (35.2%) | $81,169 |
| 3+ Earners | 311 (12.9%) | $110,438 |
| Total | 2,406 (100.0%) | $65,857 |
Household Income in Trousdale County
Household Income Brackets in Trousdale County
With 863 households falling in the category, the $50,000 to $74,999 income range is the most frequent in Trousdale County, accounting for 24.3% of all households. In contrast, only 60 households (1.7%) fall into the $10,000 to $14,999 income bracket, making it the least populous group.
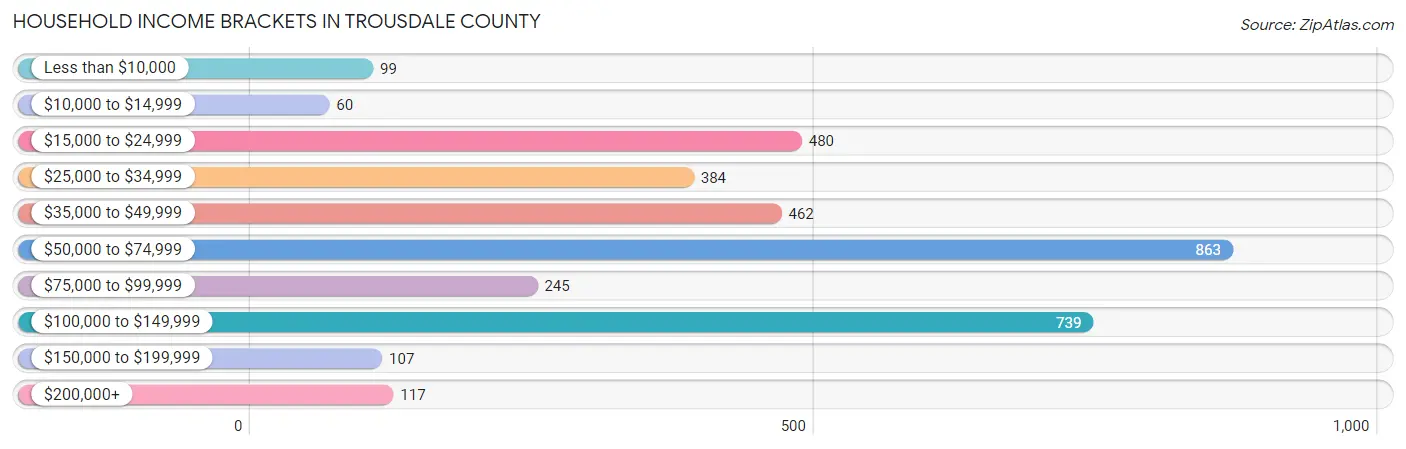
| Income Bracket | # Households | % Households |
| Less than $10,000 | 99 | 2.8% |
| $10,000 to $14,999 | 60 | 1.7% |
| $15,000 to $24,999 | 480 | 13.5% |
| $25,000 to $34,999 | 384 | 10.8% |
| $35,000 to $49,999 | 462 | 13.0% |
| $50,000 to $74,999 | 863 | 24.3% |
| $75,000 to $99,999 | 245 | 6.9% |
| $100,000 to $149,999 | 739 | 20.8% |
| $150,000 to $199,999 | 107 | 3.0% |
| $200,000+ | 117 | 3.3% |
Household Income by Householder Age in Trousdale County
The median household income in Trousdale County is $62,018, with the highest median household income of $69,075 found in the 45 to 64 years age bracket for the primary householder. A total of 1,278 households (36.0%) fall into this category. Meanwhile, the 15 to 24 years age bracket for the primary householder has the lowest median household income of $0, with 57 households (1.6%) in this group.
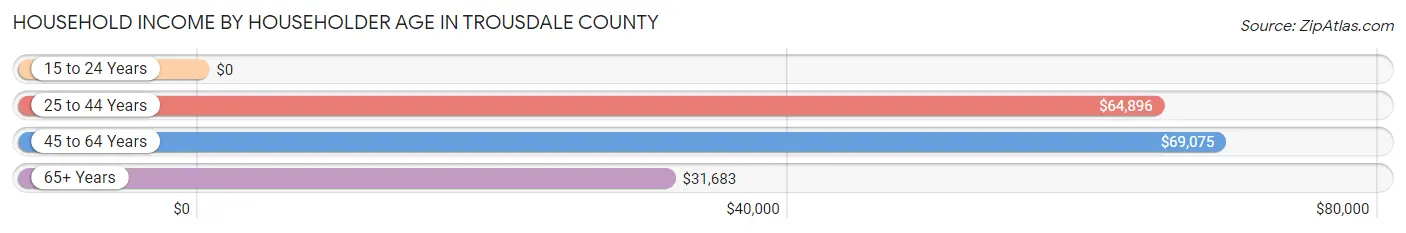
| Income Bracket | # Households | Median Income |
| 15 to 24 Years | 57 (1.6%) | $0 |
| 25 to 44 Years | 1,291 (36.3%) | $64,896 |
| 45 to 64 Years | 1,278 (36.0%) | $69,075 |
| 65+ Years | 926 (26.1%) | $31,683 |
| Total | 3,552 (100.0%) | $62,018 |
Poverty in Trousdale County
Income Below Poverty by Sex and Age in Trousdale County
With 8.5% poverty level for males and 14.8% for females among the residents of Trousdale County, 15 year old males and 15 year old females are the most vulnerable to poverty, with 14 males (87.5%) and 30 females (54.5%) in their respective age groups living below the poverty level.
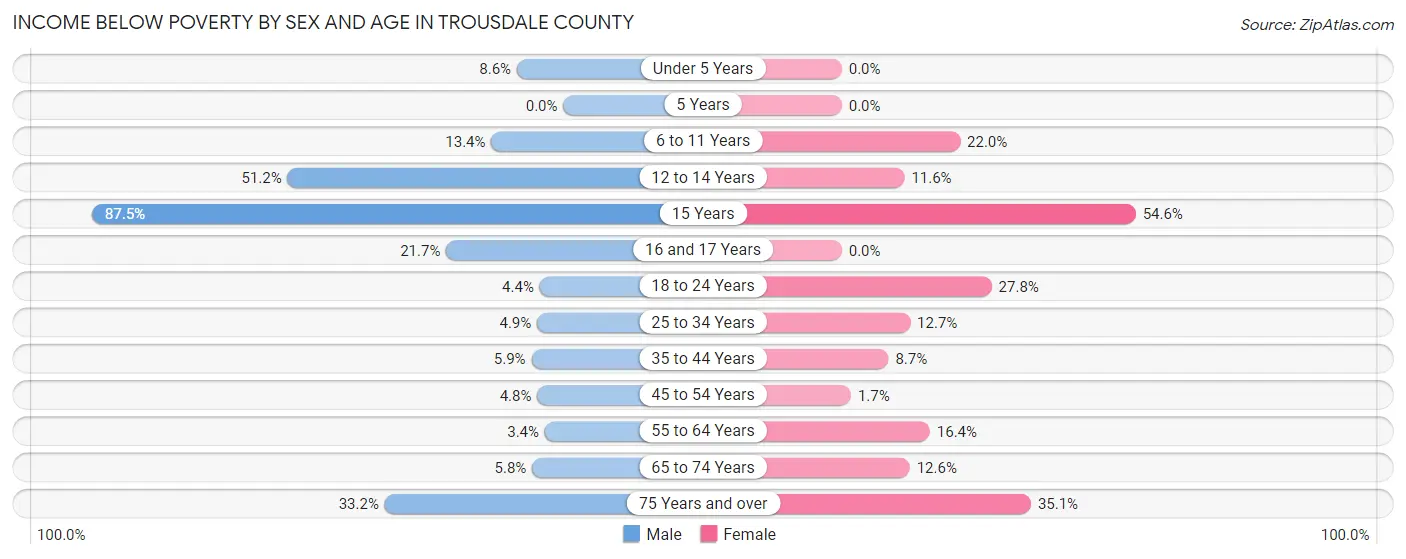
| Age Bracket | Male | Female |
| Under 5 Years | 38 (8.6%) | 0 (0.0%) |
| 5 Years | 0 (0.0%) | 0 (0.0%) |
| 6 to 11 Years | 58 (13.4%) | 92 (22.0%) |
| 12 to 14 Years | 43 (51.2%) | 5 (11.6%) |
| 15 Years | 14 (87.5%) | 30 (54.5%) |
| 16 and 17 Years | 30 (21.7%) | 0 (0.0%) |
| 18 to 24 Years | 40 (4.4%) | 79 (27.8%) |
| 25 to 34 Years | 57 (4.9%) | 99 (12.7%) |
| 35 to 44 Years | 20 (5.9%) | 44 (8.7%) |
| 45 to 54 Years | 14 (4.8%) | 10 (1.7%) |
| 55 to 64 Years | 16 (3.4%) | 102 (16.4%) |
| 65 to 74 Years | 21 (5.8%) | 59 (12.6%) |
| 75 Years and over | 61 (33.2%) | 112 (35.1%) |
| Total | 412 (8.5%) | 632 (14.8%) |
Income Above Poverty by Sex and Age in Trousdale County
According to the poverty statistics in Trousdale County, males aged 55 to 64 years and females aged under 5 years are the age groups that are most secure financially, with 96.6% of males and 100.0% of females in these age groups living above the poverty line.
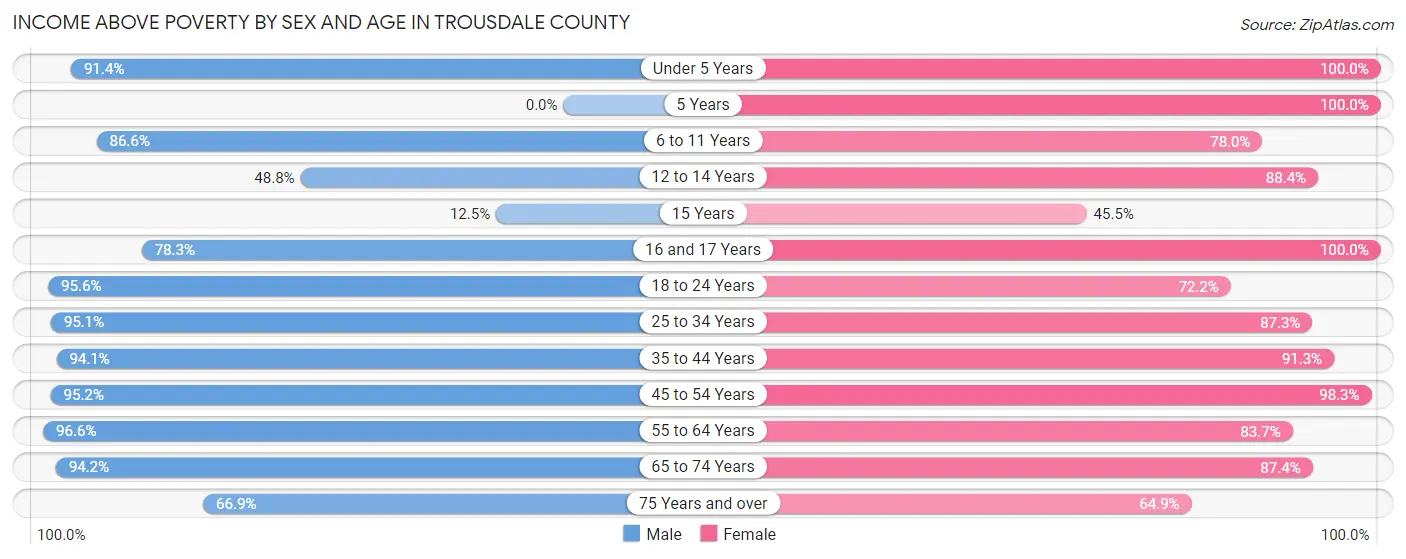
| Age Bracket | Male | Female |
| Under 5 Years | 403 (91.4%) | 81 (100.0%) |
| 5 Years | 0 (0.0%) | 38 (100.0%) |
| 6 to 11 Years | 376 (86.6%) | 327 (78.0%) |
| 12 to 14 Years | 41 (48.8%) | 38 (88.4%) |
| 15 Years | 2 (12.5%) | 25 (45.5%) |
| 16 and 17 Years | 108 (78.3%) | 72 (100.0%) |
| 18 to 24 Years | 873 (95.6%) | 205 (72.2%) |
| 25 to 34 Years | 1,114 (95.1%) | 681 (87.3%) |
| 35 to 44 Years | 318 (94.1%) | 464 (91.3%) |
| 45 to 54 Years | 276 (95.2%) | 576 (98.3%) |
| 55 to 64 Years | 451 (96.6%) | 522 (83.7%) |
| 65 to 74 Years | 342 (94.2%) | 409 (87.4%) |
| 75 Years and over | 123 (66.8%) | 207 (64.9%) |
| Total | 4,427 (91.5%) | 3,645 (85.2%) |
Income Below Poverty Among Married-Couple Families in Trousdale County
The poverty statistics for married-couple families in Trousdale County show that 10.0% or 167 of the total 1,667 families live below the poverty line. Families with no children have the highest poverty rate of 12.4%, comprising of 130 families. On the other hand, families with 3 or 4 children have the lowest poverty rate of 3.0%, which includes 4 families.
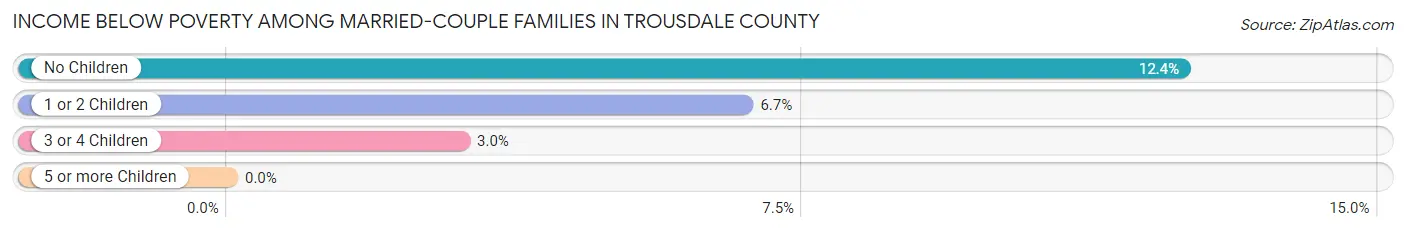
| Children | Above Poverty | Below Poverty |
| No Children | 915 (87.6%) | 130 (12.4%) |
| 1 or 2 Children | 457 (93.3%) | 33 (6.7%) |
| 3 or 4 Children | 128 (97.0%) | 4 (3.0%) |
| 5 or more Children | 0 (0.0%) | 0 (0.0%) |
| Total | 1,500 (90.0%) | 167 (10.0%) |
Income Below Poverty Among Single-Parent Households in Trousdale County
According to the poverty data in Trousdale County, 9.6% or 30 single-father households and 20.0% or 85 single-mother households are living below the poverty line. Among single-father households, those with 1 or 2 children have the highest poverty rate, with 30 households (17.9%) experiencing poverty. Likewise, among single-mother households, those with 3 or 4 children have the highest poverty rate, with 69 households (100.0%) falling below the poverty line.
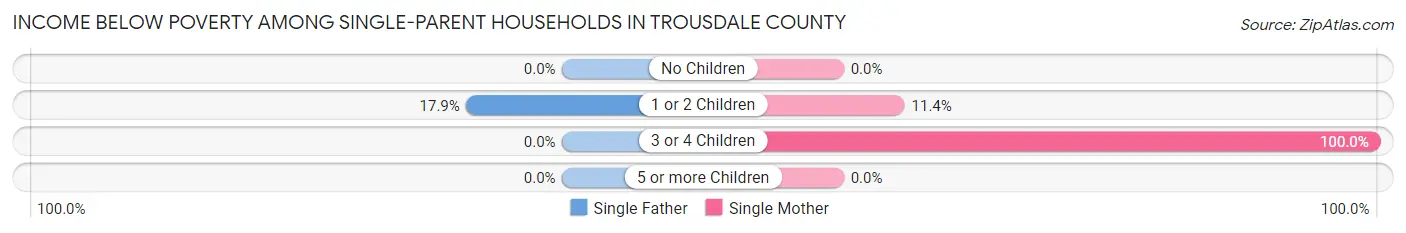
| Children | Single Father | Single Mother |
| No Children | 0 (0.0%) | 0 (0.0%) |
| 1 or 2 Children | 30 (17.9%) | 16 (11.4%) |
| 3 or 4 Children | 0 (0.0%) | 69 (100.0%) |
| 5 or more Children | 0 (0.0%) | 0 (0.0%) |
| Total | 30 (9.6%) | 85 (20.0%) |
Income Below Poverty Among Married-Couple vs Single-Parent Households in Trousdale County
The poverty data for Trousdale County shows that 167 of the married-couple family households (10.0%) and 115 of the single-parent households (15.6%) are living below the poverty level. Within the married-couple family households, those with no children have the highest poverty rate, with 130 households (12.4%) falling below the poverty line. Among the single-parent households, those with 3 or 4 children have the highest poverty rate, with 69 household (37.5%) living below poverty.
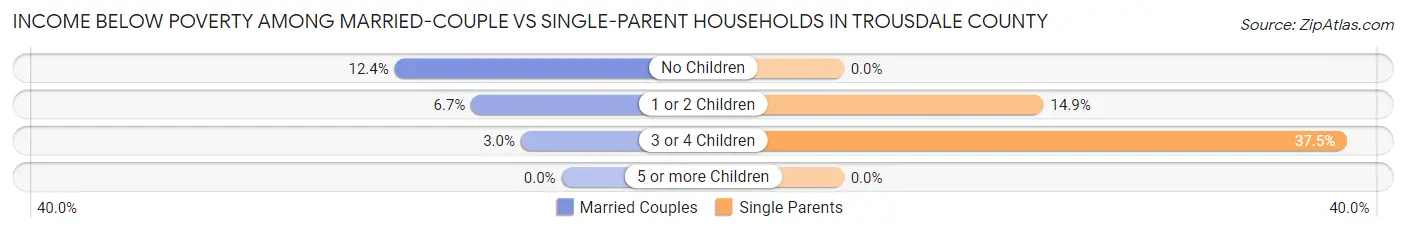
| Children | Married-Couple Families | Single-Parent Households |
| No Children | 130 (12.4%) | 0 (0.0%) |
| 1 or 2 Children | 33 (6.7%) | 46 (14.9%) |
| 3 or 4 Children | 4 (3.0%) | 69 (37.5%) |
| 5 or more Children | 0 (0.0%) | 0 (0.0%) |
| Total | 167 (10.0%) | 115 (15.6%) |
Race in Trousdale County
The most populous races in Trousdale County are White / Caucasian (9,524 | 82.1%), Black / African American (1,368 | 11.8%), and Two or more Races (451 | 3.9%).
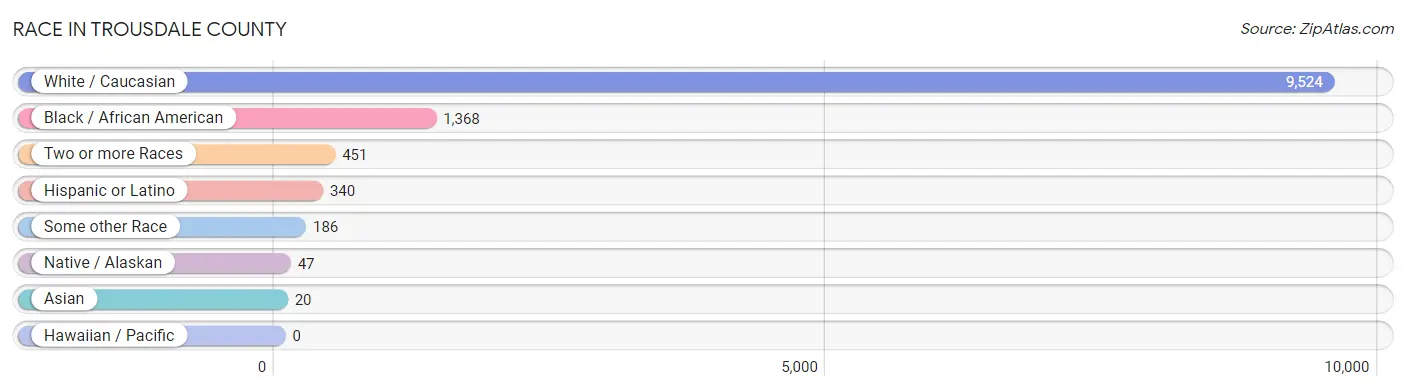
| Race | # Population | % Population |
| Asian | 20 | 0.2% |
| Black / African American | 1,368 | 11.8% |
| Hawaiian / Pacific | 0 | 0.0% |
| Hispanic or Latino | 340 | 2.9% |
| Native / Alaskan | 47 | 0.4% |
| White / Caucasian | 9,524 | 82.1% |
| Two or more Races | 451 | 3.9% |
| Some other Race | 186 | 1.6% |
| Total | 11,596 | 100.0% |
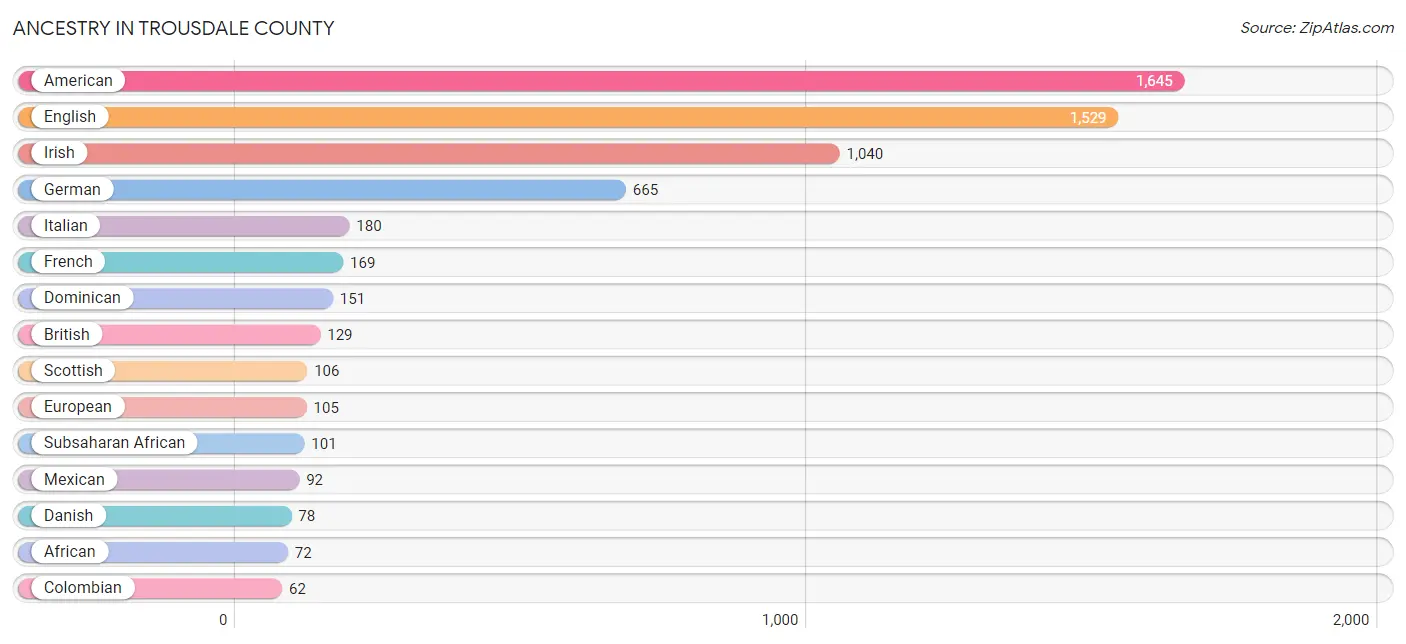
Ancestry in Trousdale County
The most populous ancestries reported in Trousdale County are American (1,645 | 14.2%), English (1,529 | 13.2%), Irish (1,040 | 9.0%), German (665 | 5.7%), and Italian (180 | 1.5%), together accounting for 43.6% of all Trousdale County residents.
| Ancestry | # Population | % Population |
| African | 72 | 0.6% |
| American | 1,645 | 14.2% |
| Apache | 20 | 0.2% |
| Blackfeet | 10 | 0.1% |
| British | 129 | 1.1% |
| Burmese | 10 | 0.1% |
| Central American | 25 | 0.2% |
| Cherokee | 47 | 0.4% |
| Colombian | 62 | 0.5% |
| Cuban | 10 | 0.1% |
| Czech | 21 | 0.2% |
| Danish | 78 | 0.7% |
| Dominican | 151 | 1.3% |
| Dutch | 60 | 0.5% |
| English | 1,529 | 13.2% |
| European | 105 | 0.9% |
| French | 169 | 1.5% |
| French Canadian | 9 | 0.1% |
| German | 665 | 5.7% |
| Greek | 20 | 0.2% |
| Guatemalan | 10 | 0.1% |
| Icelander | 11 | 0.1% |
| Irish | 1,040 | 9.0% |
| Italian | 180 | 1.5% |
| Jamaican | 10 | 0.1% |
| Malaysian | 10 | 0.1% |
| Mexican | 92 | 0.8% |
| Nigerian | 29 | 0.3% |
| Panamanian | 15 | 0.1% |
| Polish | 18 | 0.2% |
| Russian | 23 | 0.2% |
| Scotch-Irish | 19 | 0.2% |
| Scottish | 106 | 0.9% |
| Slavic | 11 | 0.1% |
| Slovak | 8 | 0.1% |
| South American | 62 | 0.5% |
| Subsaharan African | 101 | 0.9% |
| Welsh | 14 | 0.1% | View All 38 Rows |
Immigrants in Trousdale County
The most numerous immigrant groups reported in Trousdale County came from Latin America (183 | 1.6%), Caribbean (103 | 0.9%), Dominican Republic (82 | 0.7%), Colombia (62 | 0.5%), and South America (62 | 0.5%), together accounting for 4.2% of all Trousdale County residents.
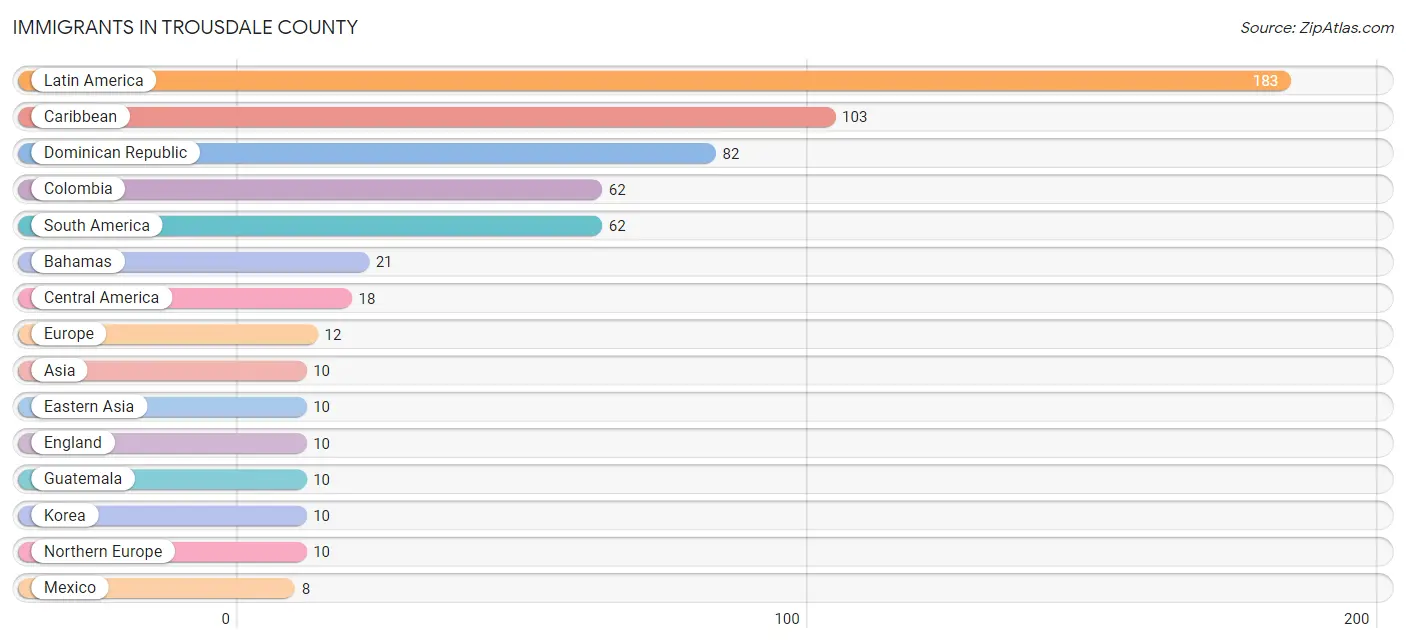
| Immigration Origin | # Population | % Population |
| Asia | 10 | 0.1% |
| Bahamas | 21 | 0.2% |
| Caribbean | 103 | 0.9% |
| Central America | 18 | 0.2% |
| Colombia | 62 | 0.5% |
| Dominican Republic | 82 | 0.7% |
| Eastern Asia | 10 | 0.1% |
| England | 10 | 0.1% |
| Europe | 12 | 0.1% |
| Germany | 2 | 0.0% |
| Guatemala | 10 | 0.1% |
| Korea | 10 | 0.1% |
| Latin America | 183 | 1.6% |
| Mexico | 8 | 0.1% |
| Northern Europe | 10 | 0.1% |
| South America | 62 | 0.5% |
| Western Europe | 2 | 0.0% | View All 17 Rows |
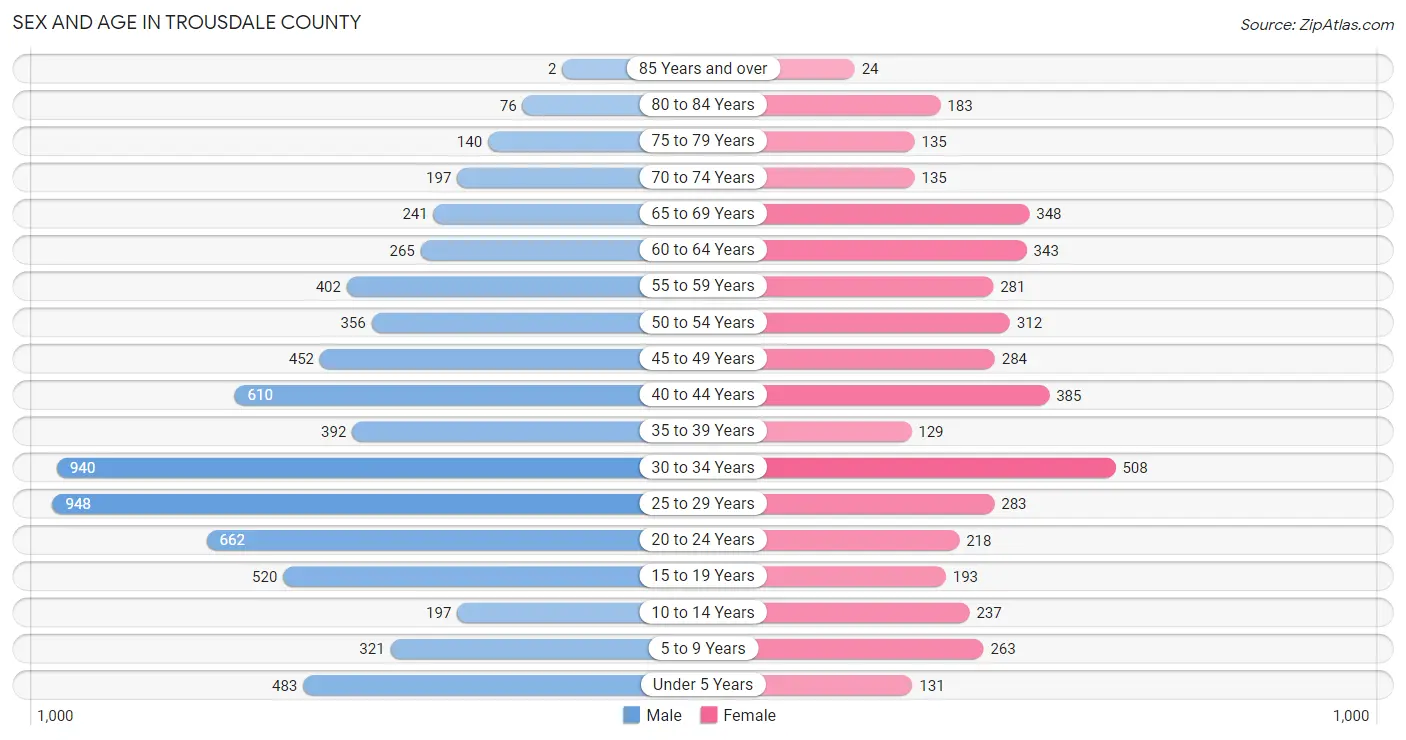
Sex and Age in Trousdale County
Sex and Age in Trousdale County
The most populous age groups in Trousdale County are 25 to 29 Years (948 | 13.2%) for men and 30 to 34 Years (508 | 11.6%) for women.
| Age Bracket | Male | Female |
| Under 5 Years | 483 (6.7%) | 131 (3.0%) |
| 5 to 9 Years | 321 (4.5%) | 263 (6.0%) |
| 10 to 14 Years | 197 (2.7%) | 237 (5.4%) |
| 15 to 19 Years | 520 (7.2%) | 193 (4.4%) |
| 20 to 24 Years | 662 (9.2%) | 218 (5.0%) |
| 25 to 29 Years | 948 (13.2%) | 283 (6.4%) |
| 30 to 34 Years | 940 (13.1%) | 508 (11.6%) |
| 35 to 39 Years | 392 (5.4%) | 129 (2.9%) |
| 40 to 44 Years | 610 (8.5%) | 385 (8.8%) |
| 45 to 49 Years | 452 (6.3%) | 284 (6.5%) |
| 50 to 54 Years | 356 (4.9%) | 312 (7.1%) |
| 55 to 59 Years | 402 (5.6%) | 281 (6.4%) |
| 60 to 64 Years | 265 (3.7%) | 343 (7.8%) |
| 65 to 69 Years | 241 (3.4%) | 348 (7.9%) |
| 70 to 74 Years | 197 (2.7%) | 135 (3.1%) |
| 75 to 79 Years | 140 (1.9%) | 135 (3.1%) |
| 80 to 84 Years | 76 (1.1%) | 183 (4.2%) |
| 85 Years and over | 2 (0.0%) | 24 (0.5%) |
| Total | 7,204 (100.0%) | 4,392 (100.0%) |
Families and Households in Trousdale County
Median Family Size in Trousdale County
The median family size in Trousdale County is 3.18 persons per family, with single female/mother families (426 | 17.7%) accounting for the largest median family size of 4.23 persons per family. On the other hand, single male/father families (313 | 13.0%) represent the smallest median family size with 2.81 persons per family.
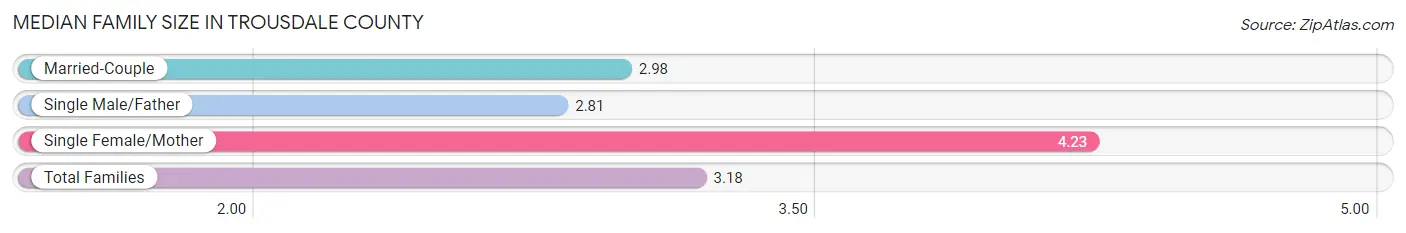
| Family Type | # Families | Family Size |
| Married-Couple | 1,667 (69.3%) | 2.98 |
| Single Male/Father | 313 (13.0%) | 2.81 |
| Single Female/Mother | 426 (17.7%) | 4.23 |
| Total Families | 2,406 (100.0%) | 3.18 |
Median Household Size in Trousdale County
The median household size in Trousdale County is 2.58 persons per household, with single female/mother households (426 | 12.0%) accounting for the largest median household size of 4.29 persons per household. non-family households (1,146 | 32.3%) represent the smallest median household size with 1.19 persons per household.
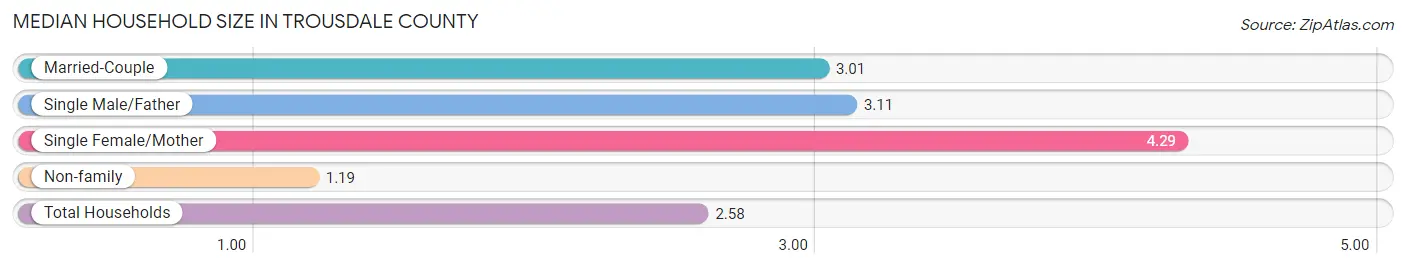
| Household Type | # Households | Household Size |
| Married-Couple | 1,667 (46.9%) | 3.01 |
| Single Male/Father | 313 (8.8%) | 3.11 |
| Single Female/Mother | 426 (12.0%) | 4.29 |
| Non-family | 1,146 (32.3%) | 1.19 |
| Total Households | 3,552 (100.0%) | 2.58 |
Household Size by Marriage Status in Trousdale County
Out of a total of 3,552 households in Trousdale County, 2,406 (67.7%) are family households, while 1,146 (32.3%) are nonfamily households. The most numerous type of family households are 2-person households, comprising 1,134, and the most common type of nonfamily households are 1-person households, comprising 1,016.
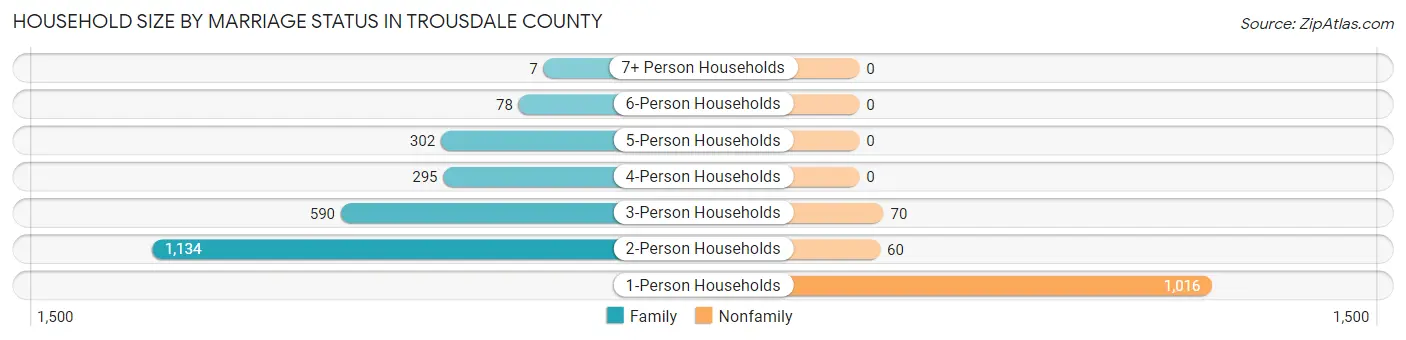
| Household Size | Family Households | Nonfamily Households |
| 1-Person Households | - | 1,016 (28.6%) |
| 2-Person Households | 1,134 (31.9%) | 60 (1.7%) |
| 3-Person Households | 590 (16.6%) | 70 (2.0%) |
| 4-Person Households | 295 (8.3%) | 0 (0.0%) |
| 5-Person Households | 302 (8.5%) | 0 (0.0%) |
| 6-Person Households | 78 (2.2%) | 0 (0.0%) |
| 7+ Person Households | 7 (0.2%) | 0 (0.0%) |
| Total | 2,406 (67.7%) | 1,146 (32.3%) |
Female Fertility in Trousdale County
Fertility by Age in Trousdale County
Average fertility rate in Trousdale County is 71.0 births per 1,000 women. Women in the age bracket of 20 to 34 years have the highest fertility rate with 142.0 births per 1,000 women. Women in the age bracket of 20 to 34 years acount for 100.0% of all women with births.
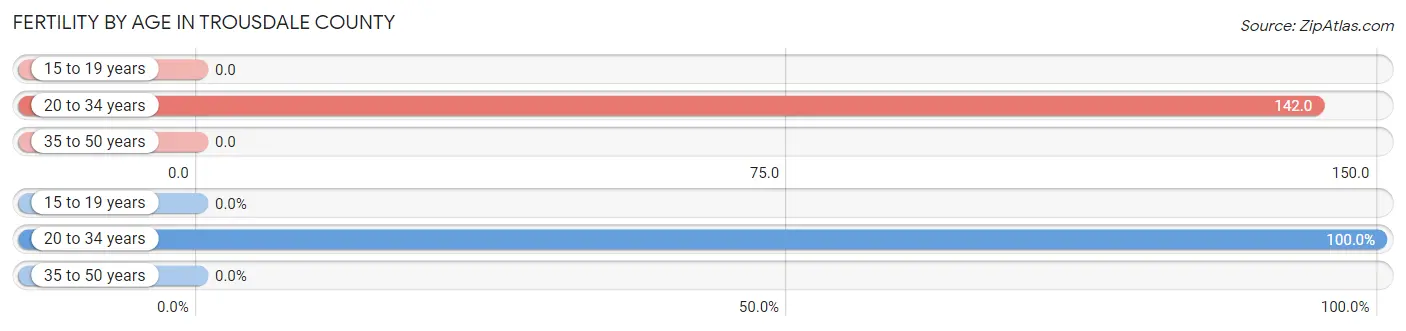
| Age Bracket | Women with Births | Births / 1,000 Women |
| 15 to 19 years | 0 (0.0%) | 0.0 |
| 20 to 34 years | 143 (100.0%) | 142.0 |
| 35 to 50 years | 0 (0.0%) | 0.0 |
| Total | 143 (100.0%) | 71.0 |
Fertility by Age by Marriage Status in Trousdale County
47.6% of women with births (143) in Trousdale County are married. The highest percentage of unmarried women with births falls into 20 to 34 years age bracket with 52.4% of them unmarried at the time of birth, while the lowest percentage of unmarried women with births belong to 20 to 34 years age bracket with 52.4% of them unmarried.
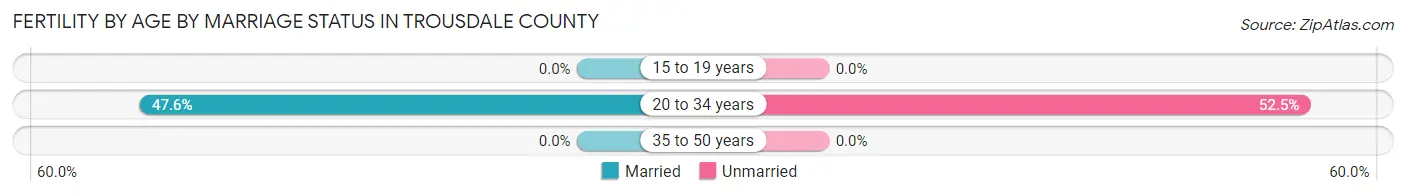
| Age Bracket | Married | Unmarried |
| 15 to 19 years | 0 (0.0%) | 0 (0.0%) |
| 20 to 34 years | 68 (47.5%) | 75 (52.4%) |
| 35 to 50 years | 0 (0.0%) | 0 (0.0%) |
| Total | 68 (47.5%) | 75 (52.4%) |
Fertility by Education in Trousdale County
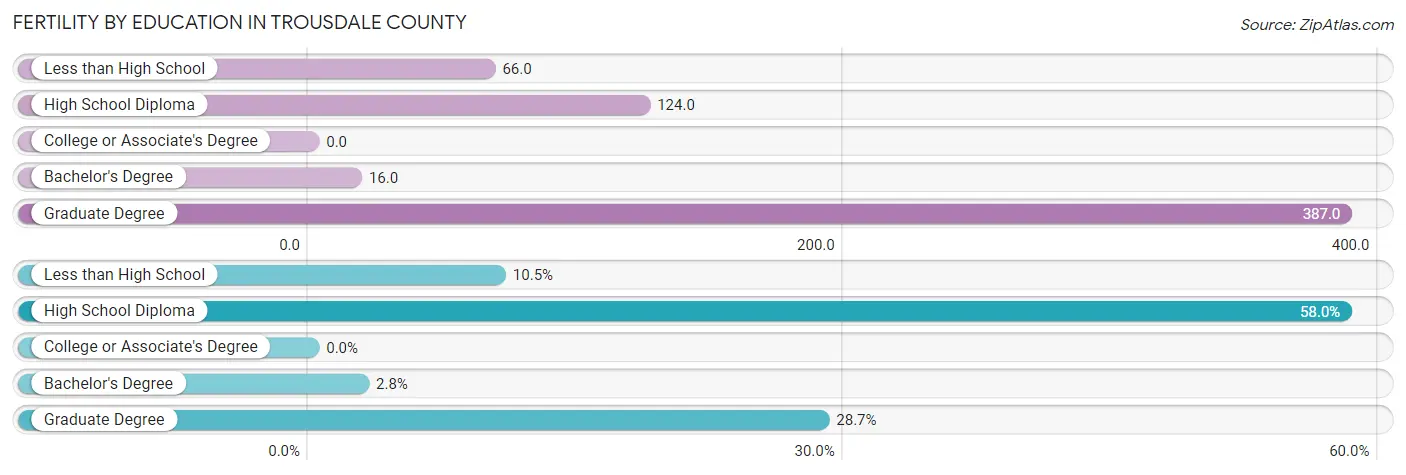
| Educational Attainment | Women with Births | Births / 1,000 Women |
| Less than High School | 15 (10.5%) | 66.0 |
| High School Diploma | 83 (58.0%) | 124.0 |
| College or Associate's Degree | 0 (0.0%) | 0.0 |
| Bachelor's Degree | 4 (2.8%) | 16.0 |
| Graduate Degree | 41 (28.7%) | 387.0 |
| Total | 143 (100.0%) | 71.0 |
Fertility by Education by Marriage Status in Trousdale County
52.4% of women with births in Trousdale County are unmarried. Women with the educational attainment of bachelor's degree are most likely to be married with 100.0% of them married at childbirth, while women with the educational attainment of less than high school are least likely to be married with 100.0% of them unmarried at childbirth.
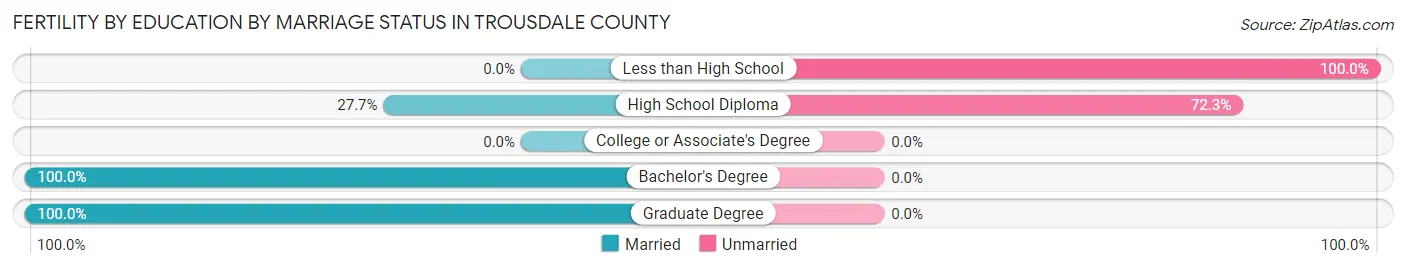
| Educational Attainment | Married | Unmarried |
| Less than High School | 0 (0.0%) | 15 (100.0%) |
| High School Diploma | 23 (27.7%) | 60 (72.3%) |
| College or Associate's Degree | 0 (0.0%) | 0 (0.0%) |
| Bachelor's Degree | 4 (100.0%) | 0 (0.0%) |
| Graduate Degree | 41 (100.0%) | 0 (0.0%) |
| Total | 68 (47.5%) | 75 (52.4%) |
Employment Characteristics in Trousdale County
Employment by Class of Employer in Trousdale County
Among the 4,880 employed individuals in Trousdale County, private company employees (3,594 | 73.7%), not-for-profit organizations (392 | 8.0%), and local government employees (302 | 6.2%) make up the most common classes of employment.
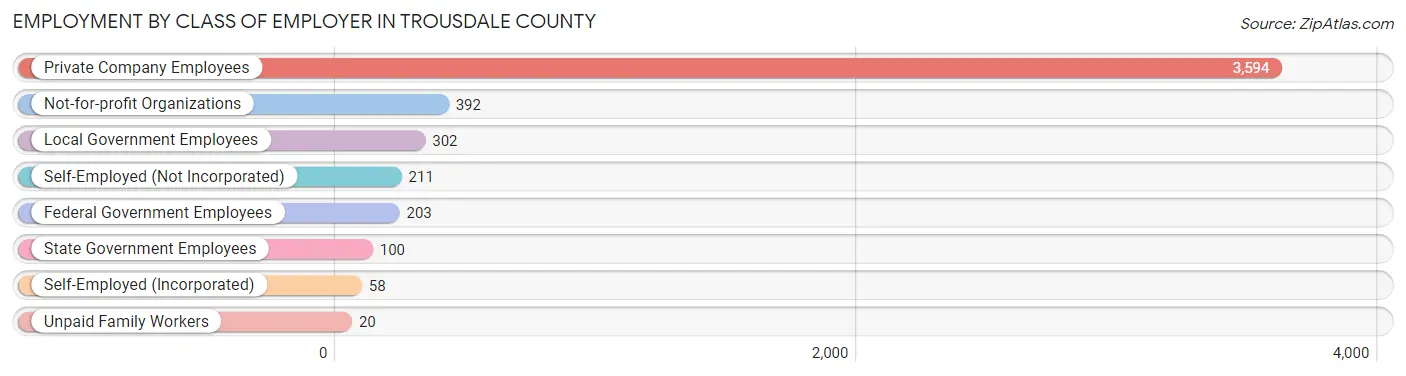
| Employer Class | # Employees | % Employees |
| Private Company Employees | 3,594 | 73.7% |
| Self-Employed (Incorporated) | 58 | 1.2% |
| Self-Employed (Not Incorporated) | 211 | 4.3% |
| Not-for-profit Organizations | 392 | 8.0% |
| Local Government Employees | 302 | 6.2% |
| State Government Employees | 100 | 2.1% |
| Federal Government Employees | 203 | 4.2% |
| Unpaid Family Workers | 20 | 0.4% |
| Total | 4,880 | 100.0% |
Employment Status by Age in Trousdale County
According to the labor force statistics for Trousdale County, out of the total population over 16 years of age (9,893), 52.2% or 5,164 individuals are in the labor force, with 0.8% or 41 of them unemployed. The age group with the highest labor force participation rate is 55 to 59 years, with 74.4% or 508 individuals in the labor force. Within the labor force, the 35 to 44 years age range has the highest percentage of unemployed individuals, with 3.5% or 28 of them being unemployed.
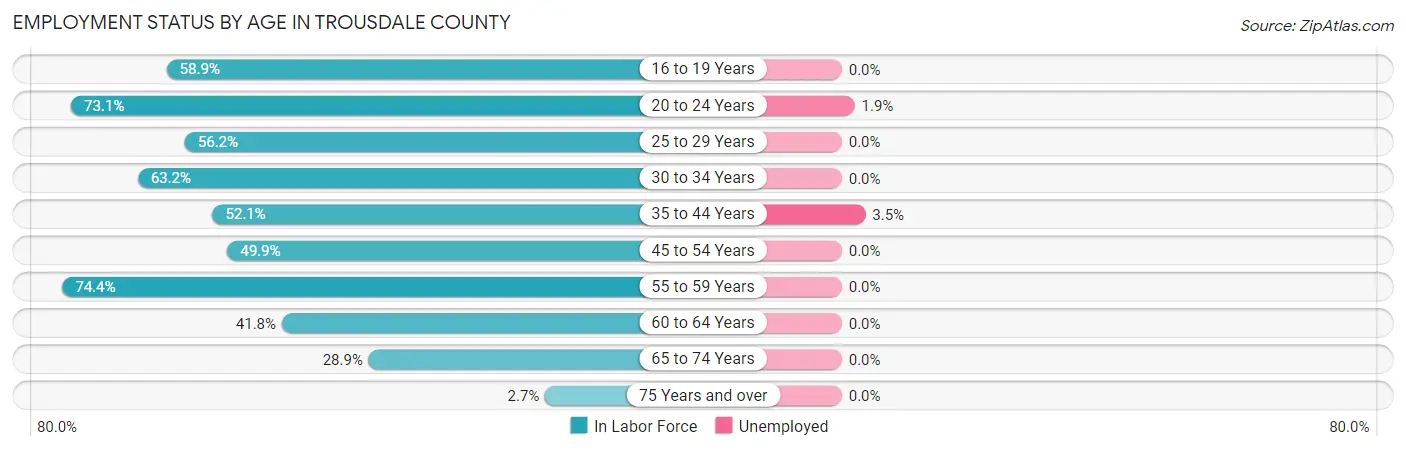
| Age Bracket | In Labor Force | Unemployed |
| 16 to 19 Years | 378 (58.9%) | 0 (0.0%) |
| 20 to 24 Years | 643 (73.1%) | 12 (1.9%) |
| 25 to 29 Years | 692 (56.2%) | 0 (0.0%) |
| 30 to 34 Years | 915 (63.2%) | 0 (0.0%) |
| 35 to 44 Years | 790 (52.1%) | 28 (3.5%) |
| 45 to 54 Years | 701 (49.9%) | 0 (0.0%) |
| 55 to 59 Years | 508 (74.4%) | 0 (0.0%) |
| 60 to 64 Years | 254 (41.8%) | 0 (0.0%) |
| 65 to 74 Years | 266 (28.9%) | 0 (0.0%) |
| 75 Years and over | 15 (2.7%) | 0 (0.0%) |
| Total | 5,164 (52.2%) | 41 (0.8%) |
Employment Status by Educational Attainment in Trousdale County
According to labor force statistics for Trousdale County, 56.0% of individuals (3,858) out of the total population between 25 and 64 years of age (6,890) are in the labor force, with 0.7% or 27 of them being unemployed. The group with the highest labor force participation rate are those with the educational attainment of bachelor's degree or higher, with 72.5% or 466 individuals in the labor force. Within the labor force, individuals with college / associate degree education have the highest percentage of unemployment, with 1.2% or 16 of them being unemployed.
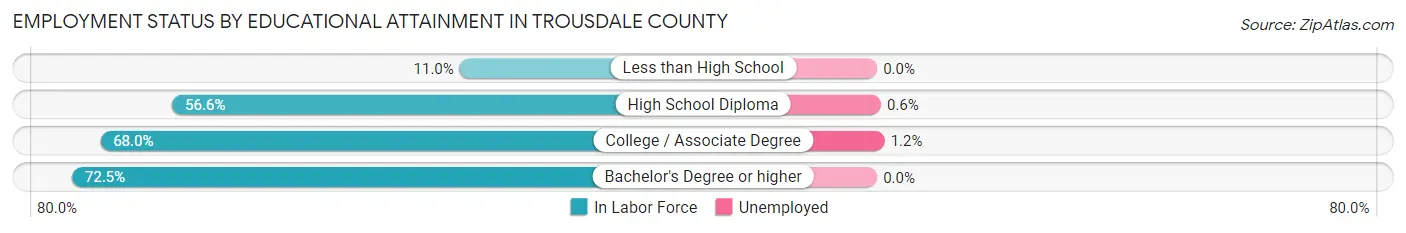
| Educational Attainment | In Labor Force | Unemployed |
| Less than High School | 87 (11.0%) | 0 (0.0%) |
| High School Diploma | 1,999 (56.6%) | 21 (0.6%) |
| College / Associate Degree | 1,310 (68.0%) | 23 (1.2%) |
| Bachelor's Degree or higher | 466 (72.5%) | 0 (0.0%) |
| Total | 3,858 (56.0%) | 48 (0.7%) |
Employment Occupations by Sex in Trousdale County
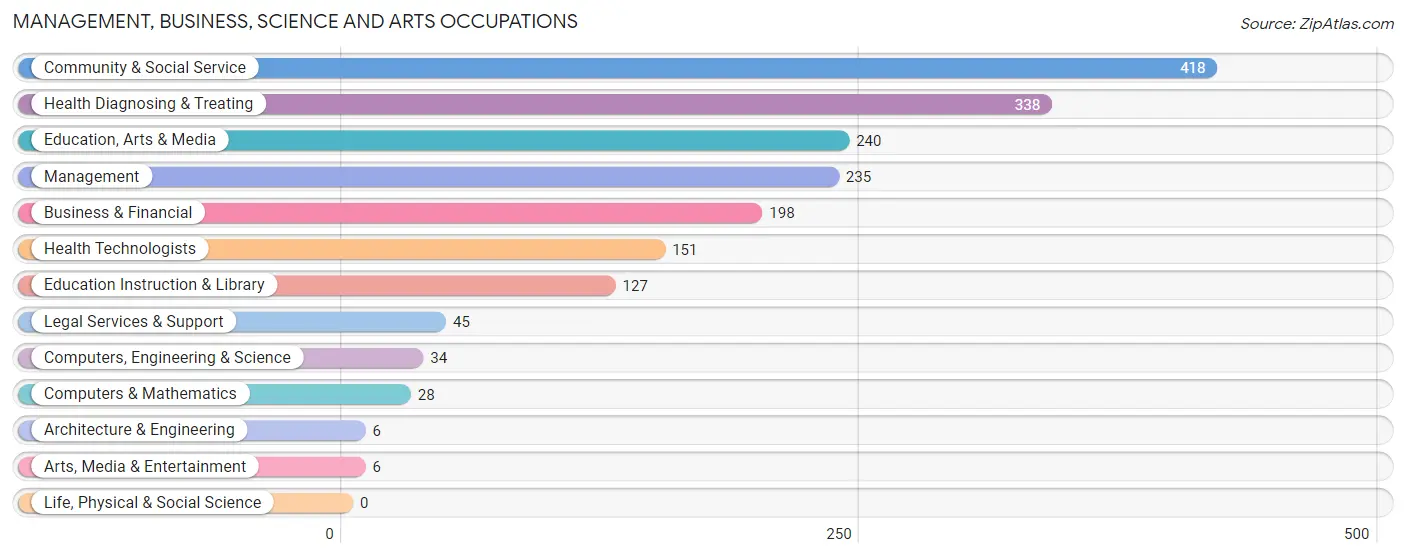
Management, Business, Science and Arts Occupations
The most common Management, Business, Science and Arts occupations in Trousdale County are Community & Social Service (418 | 8.2%), Health Diagnosing & Treating (338 | 6.6%), Education, Arts & Media (240 | 4.7%), Management (235 | 4.6%), and Business & Financial (198 | 3.9%).
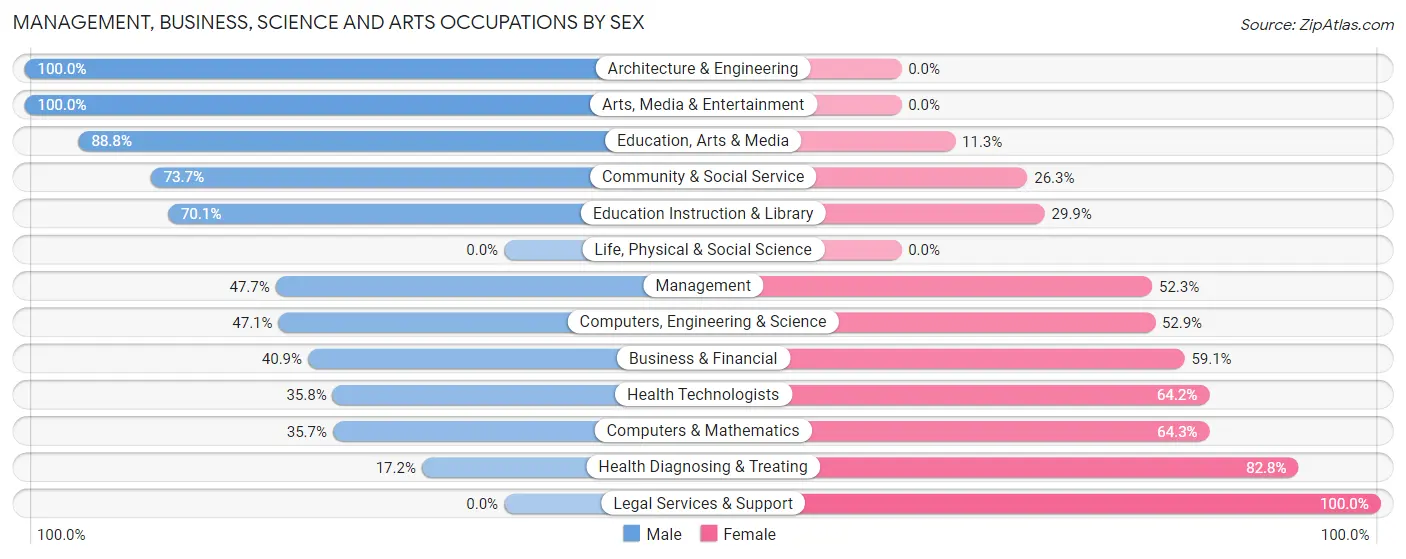
Management, Business, Science and Arts Occupations by Sex
Within the Management, Business, Science and Arts occupations in Trousdale County, the most male-oriented occupations are Architecture & Engineering (100.0%), Arts, Media & Entertainment (100.0%), and Education, Arts & Media (88.7%), while the most female-oriented occupations are Legal Services & Support (100.0%), Health Diagnosing & Treating (82.8%), and Computers & Mathematics (64.3%).
| Occupation | Male | Female |
| Management | 112 (47.7%) | 123 (52.3%) |
| Business & Financial | 81 (40.9%) | 117 (59.1%) |
| Computers, Engineering & Science | 16 (47.1%) | 18 (52.9%) |
| Computers & Mathematics | 10 (35.7%) | 18 (64.3%) |
| Architecture & Engineering | 6 (100.0%) | 0 (0.0%) |
| Life, Physical & Social Science | 0 (0.0%) | 0 (0.0%) |
| Community & Social Service | 308 (73.7%) | 110 (26.3%) |
| Education, Arts & Media | 213 (88.7%) | 27 (11.3%) |
| Legal Services & Support | 0 (0.0%) | 45 (100.0%) |
| Education Instruction & Library | 89 (70.1%) | 38 (29.9%) |
| Arts, Media & Entertainment | 6 (100.0%) | 0 (0.0%) |
| Health Diagnosing & Treating | 58 (17.2%) | 280 (82.8%) |
| Health Technologists | 54 (35.8%) | 97 (64.2%) |
| Total (Category) | 575 (47.0%) | 648 (53.0%) |
| Total (Overall) | 2,859 (55.8%) | 2,263 (44.2%) |
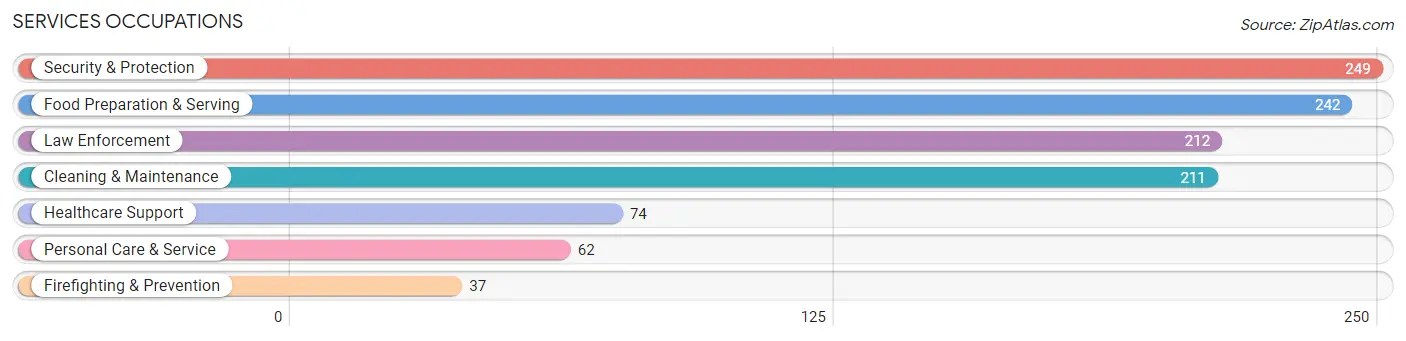
Services Occupations
The most common Services occupations in Trousdale County are Security & Protection (249 | 4.9%), Food Preparation & Serving (242 | 4.7%), Law Enforcement (212 | 4.1%), Cleaning & Maintenance (211 | 4.1%), and Healthcare Support (74 | 1.4%).
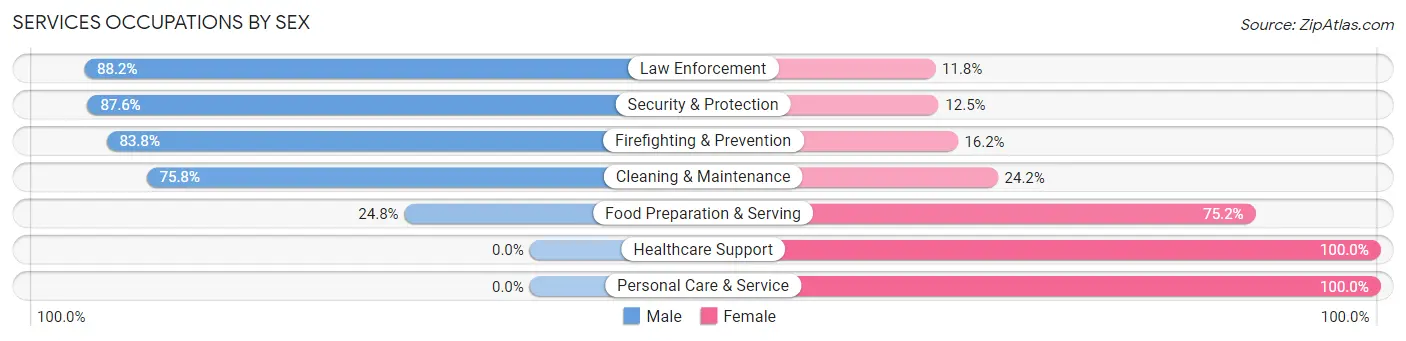
Services Occupations by Sex
Within the Services occupations in Trousdale County, the most male-oriented occupations are Law Enforcement (88.2%), Security & Protection (87.5%), and Firefighting & Prevention (83.8%), while the most female-oriented occupations are Healthcare Support (100.0%), Personal Care & Service (100.0%), and Food Preparation & Serving (75.2%).
| Occupation | Male | Female |
| Healthcare Support | 0 (0.0%) | 74 (100.0%) |
| Security & Protection | 218 (87.5%) | 31 (12.4%) |
| Firefighting & Prevention | 31 (83.8%) | 6 (16.2%) |
| Law Enforcement | 187 (88.2%) | 25 (11.8%) |
| Food Preparation & Serving | 60 (24.8%) | 182 (75.2%) |
| Cleaning & Maintenance | 160 (75.8%) | 51 (24.2%) |
| Personal Care & Service | 0 (0.0%) | 62 (100.0%) |
| Total (Category) | 438 (52.3%) | 400 (47.7%) |
| Total (Overall) | 2,859 (55.8%) | 2,263 (44.2%) |
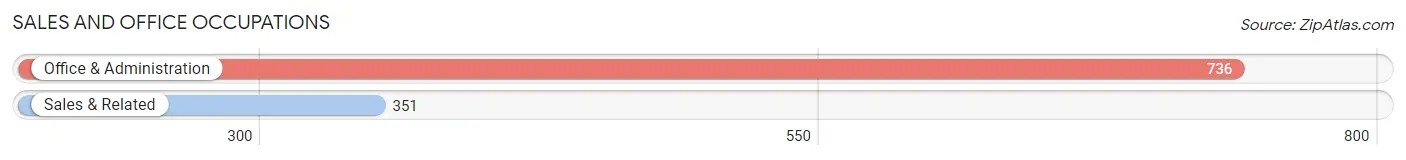
Sales and Office Occupations
The most common Sales and Office occupations in Trousdale County are Office & Administration (736 | 14.4%), and Sales & Related (351 | 6.9%).
Sales and Office Occupations by Sex
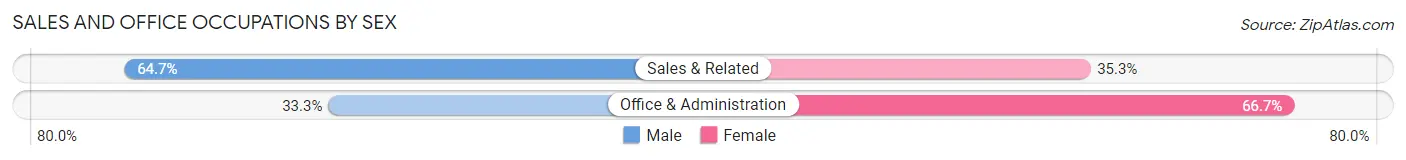
| Occupation | Male | Female |
| Sales & Related | 227 (64.7%) | 124 (35.3%) |
| Office & Administration | 245 (33.3%) | 491 (66.7%) |
| Total (Category) | 472 (43.4%) | 615 (56.6%) |
| Total (Overall) | 2,859 (55.8%) | 2,263 (44.2%) |
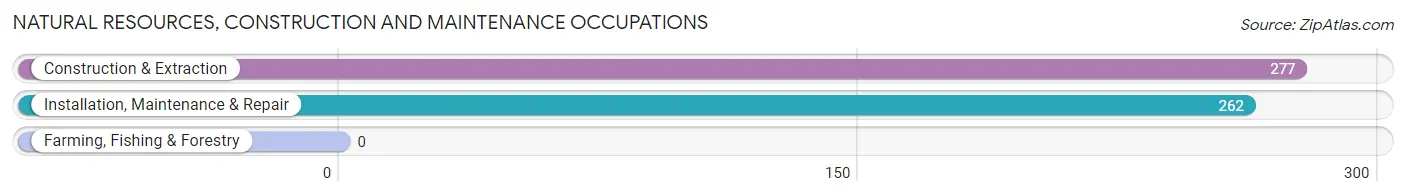
Natural Resources, Construction and Maintenance Occupations
The most common Natural Resources, Construction and Maintenance occupations in Trousdale County are Construction & Extraction (277 | 5.4%), and Installation, Maintenance & Repair (262 | 5.1%).
Natural Resources, Construction and Maintenance Occupations by Sex
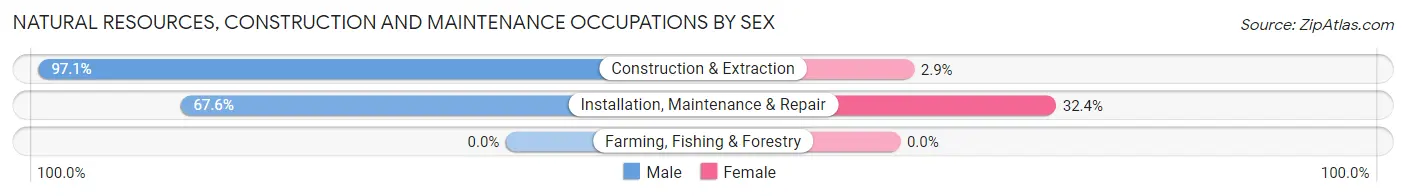
| Occupation | Male | Female |
| Farming, Fishing & Forestry | 0 (0.0%) | 0 (0.0%) |
| Construction & Extraction | 269 (97.1%) | 8 (2.9%) |
| Installation, Maintenance & Repair | 177 (67.6%) | 85 (32.4%) |
| Total (Category) | 446 (82.8%) | 93 (17.2%) |
| Total (Overall) | 2,859 (55.8%) | 2,263 (44.2%) |
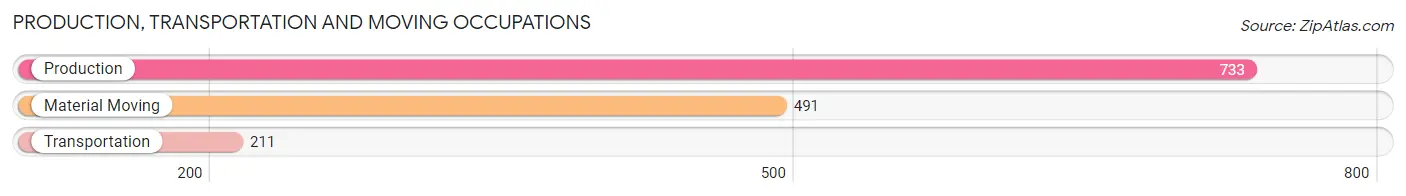
Production, Transportation and Moving Occupations
The most common Production, Transportation and Moving occupations in Trousdale County are Production (733 | 14.3%), Material Moving (491 | 9.6%), and Transportation (211 | 4.1%).
Production, Transportation and Moving Occupations by Sex
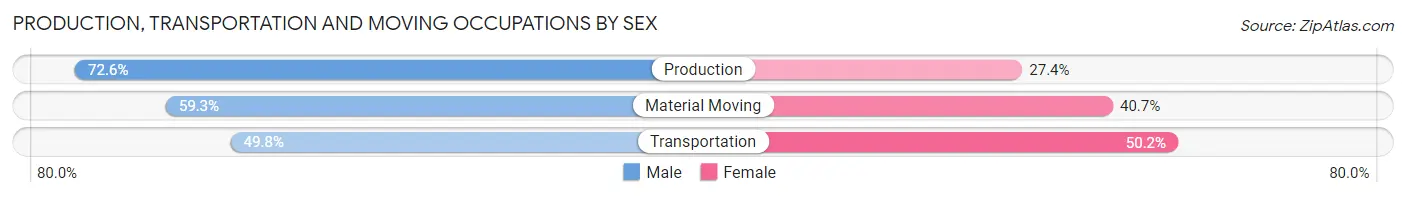
| Occupation | Male | Female |
| Production | 532 (72.6%) | 201 (27.4%) |
| Transportation | 105 (49.8%) | 106 (50.2%) |
| Material Moving | 291 (59.3%) | 200 (40.7%) |
| Total (Category) | 928 (64.7%) | 507 (35.3%) |
| Total (Overall) | 2,859 (55.8%) | 2,263 (44.2%) |
Employment Industries by Sex in Trousdale County
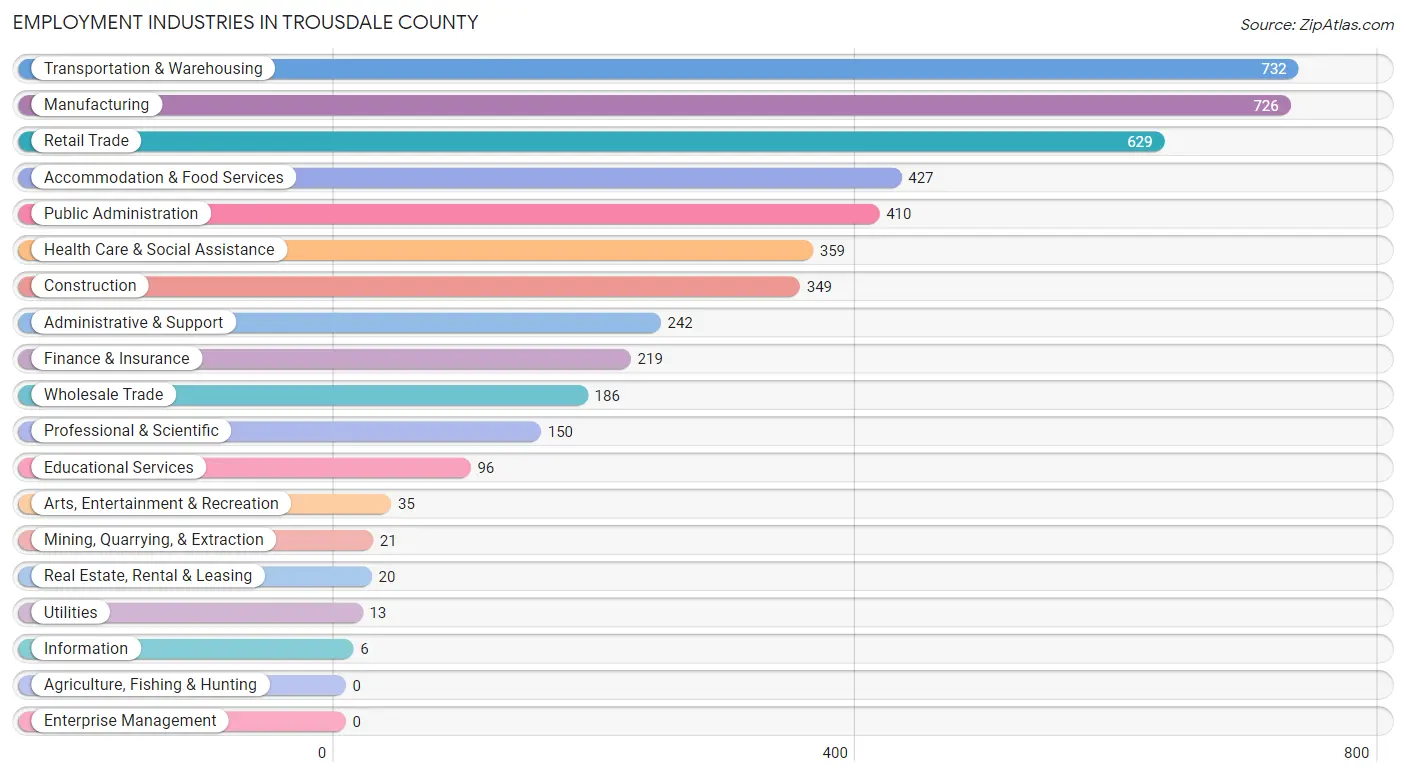
Employment Industries in Trousdale County
The major employment industries in Trousdale County include Transportation & Warehousing (732 | 14.3%), Manufacturing (726 | 14.2%), Retail Trade (629 | 12.3%), Accommodation & Food Services (427 | 8.3%), and Public Administration (410 | 8.0%).
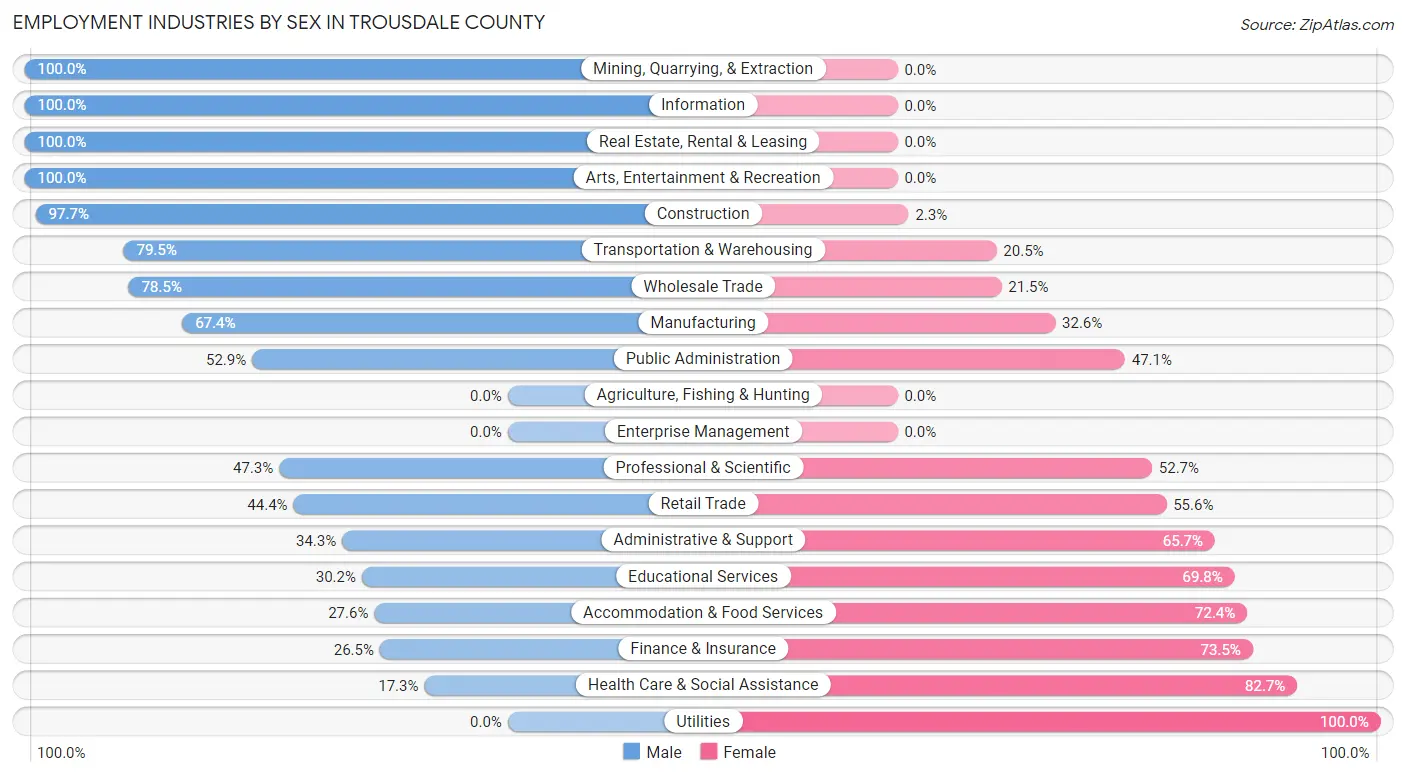
Employment Industries by Sex in Trousdale County
The Trousdale County industries that see more men than women are Mining, Quarrying, & Extraction (100.0%), Information (100.0%), and Real Estate, Rental & Leasing (100.0%), whereas the industries that tend to have a higher number of women are Utilities (100.0%), Health Care & Social Assistance (82.7%), and Finance & Insurance (73.5%).
| Industry | Male | Female |
| Agriculture, Fishing & Hunting | 0 (0.0%) | 0 (0.0%) |
| Mining, Quarrying, & Extraction | 21 (100.0%) | 0 (0.0%) |
| Construction | 341 (97.7%) | 8 (2.3%) |
| Manufacturing | 489 (67.4%) | 237 (32.6%) |
| Wholesale Trade | 146 (78.5%) | 40 (21.5%) |
| Retail Trade | 279 (44.4%) | 350 (55.6%) |
| Transportation & Warehousing | 582 (79.5%) | 150 (20.5%) |
| Utilities | 0 (0.0%) | 13 (100.0%) |
| Information | 6 (100.0%) | 0 (0.0%) |
| Finance & Insurance | 58 (26.5%) | 161 (73.5%) |
| Real Estate, Rental & Leasing | 20 (100.0%) | 0 (0.0%) |
| Professional & Scientific | 71 (47.3%) | 79 (52.7%) |
| Enterprise Management | 0 (0.0%) | 0 (0.0%) |
| Administrative & Support | 83 (34.3%) | 159 (65.7%) |
| Educational Services | 29 (30.2%) | 67 (69.8%) |
| Health Care & Social Assistance | 62 (17.3%) | 297 (82.7%) |
| Arts, Entertainment & Recreation | 35 (100.0%) | 0 (0.0%) |
| Accommodation & Food Services | 118 (27.6%) | 309 (72.4%) |
| Public Administration | 217 (52.9%) | 193 (47.1%) |
| Total | 2,859 (55.8%) | 2,263 (44.2%) |
Education in Trousdale County
School Enrollment in Trousdale County
The most common levels of schooling among the 2,035 students in Trousdale County are elementary school (559 | 27.5%), high school (536 | 26.3%), and college / undergraduate (404 | 19.9%).
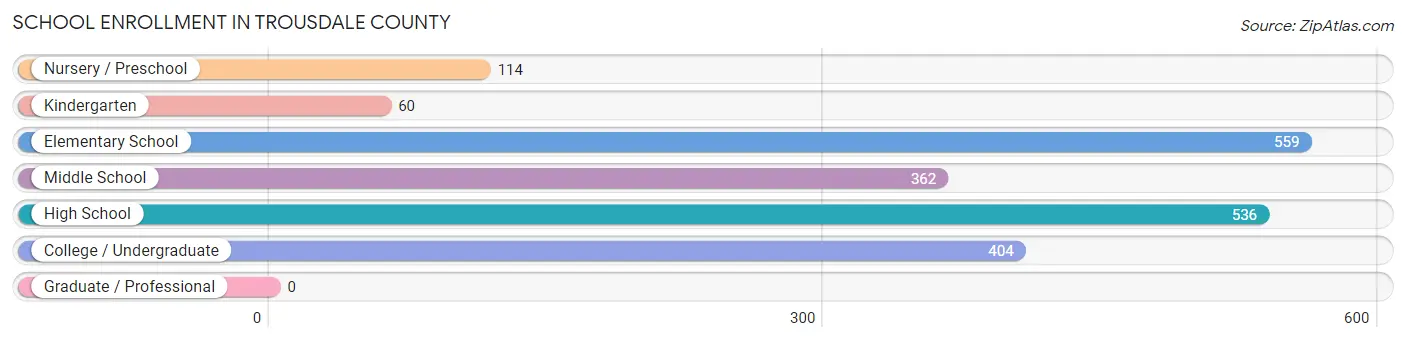
| School Level | # Students | % Students |
| Nursery / Preschool | 114 | 5.6% |
| Kindergarten | 60 | 2.9% |
| Elementary School | 559 | 27.5% |
| Middle School | 362 | 17.8% |
| High School | 536 | 26.3% |
| College / Undergraduate | 404 | 19.9% |
| Graduate / Professional | 0 | 0.0% |
| Total | 2,035 | 100.0% |
School Enrollment by Age by Funding Source in Trousdale County
Out of a total of 2,035 students who are enrolled in schools in Trousdale County, 309 (15.2%) attend a private institution, while the remaining 1,726 (84.8%) are enrolled in public schools. The age group of 25 to 34 year olds has the highest likelihood of being enrolled in private schools, with 10 (29.4% in the age bracket) enrolled. Conversely, the age group of 3 to 4 year olds has the lowest likelihood of being enrolled in a private school, with 114 (100.0% in the age bracket) attending a public institution.
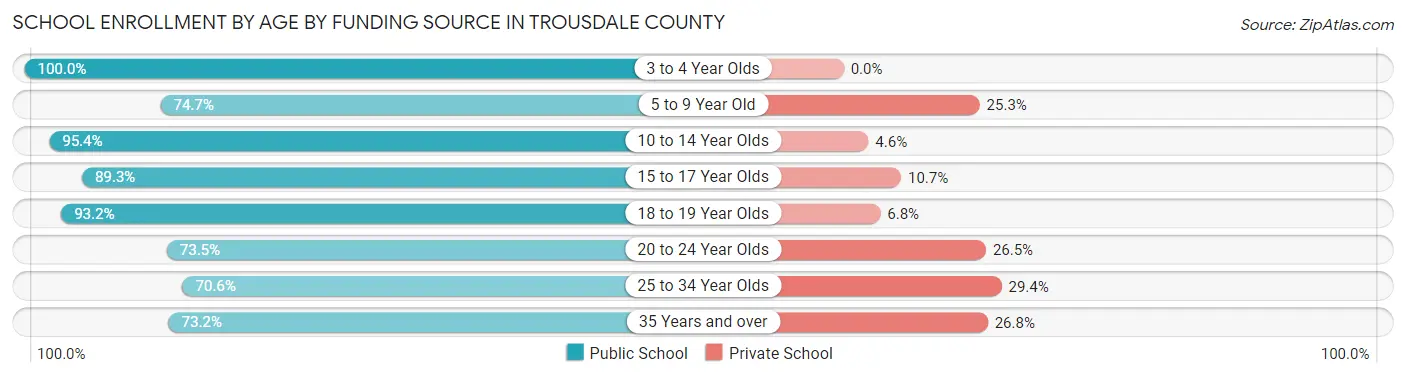
| Age Bracket | Public School | Private School |
| 3 to 4 Year Olds | 114 (100.0%) | 0 (0.0%) |
| 5 to 9 Year Old | 398 (74.7%) | 135 (25.3%) |
| 10 to 14 Year Olds | 414 (95.4%) | 20 (4.6%) |
| 15 to 17 Year Olds | 234 (89.3%) | 28 (10.7%) |
| 18 to 19 Year Olds | 273 (93.2%) | 20 (6.8%) |
| 20 to 24 Year Olds | 208 (73.5%) | 75 (26.5%) |
| 25 to 34 Year Olds | 24 (70.6%) | 10 (29.4%) |
| 35 Years and over | 60 (73.2%) | 22 (26.8%) |
| Total | 1,726 (84.8%) | 309 (15.2%) |
Educational Attainment by Field of Study in Trousdale County
Business (135 | 14.5%), science & technology (126 | 13.6%), education (117 | 12.6%), liberal arts & history (102 | 11.0%), and computers & mathematics (99 | 10.7%) are the most common fields of study among 929 individuals in Trousdale County who have obtained a bachelor's degree or higher.
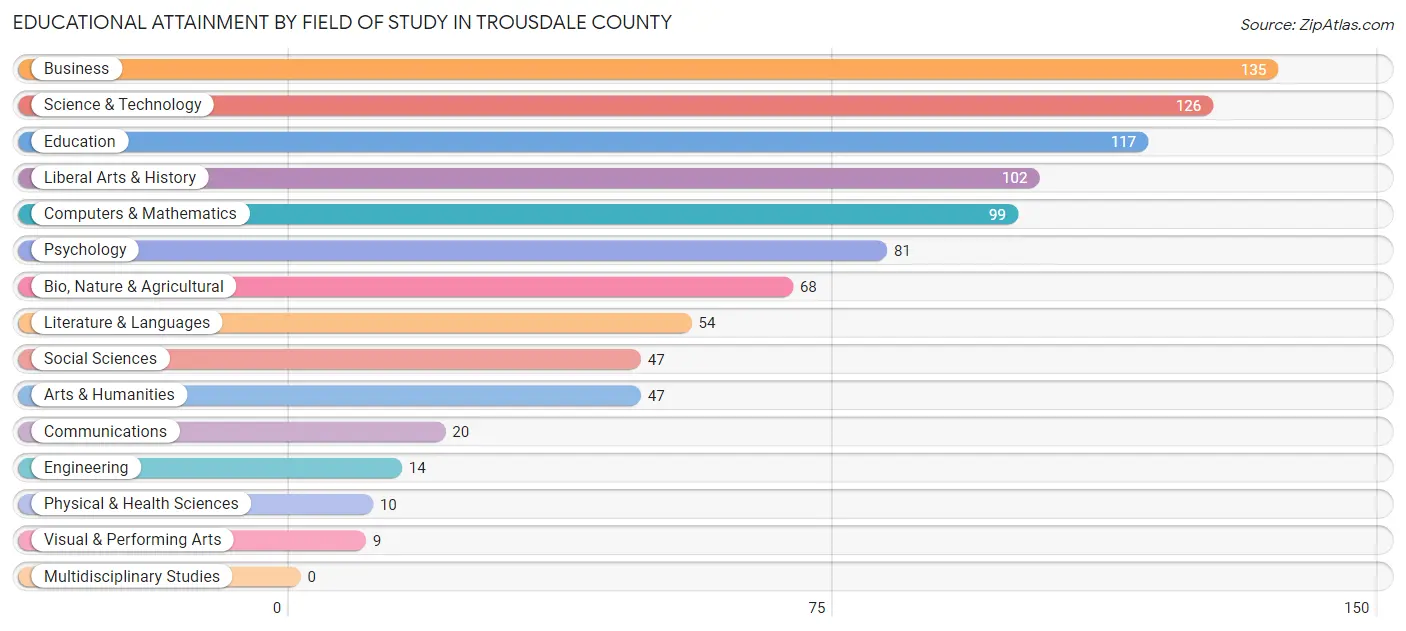
| Field of Study | # Graduates | % Graduates |
| Computers & Mathematics | 99 | 10.7% |
| Bio, Nature & Agricultural | 68 | 7.3% |
| Physical & Health Sciences | 10 | 1.1% |
| Psychology | 81 | 8.7% |
| Social Sciences | 47 | 5.1% |
| Engineering | 14 | 1.5% |
| Multidisciplinary Studies | 0 | 0.0% |
| Science & Technology | 126 | 13.6% |
| Business | 135 | 14.5% |
| Education | 117 | 12.6% |
| Literature & Languages | 54 | 5.8% |
| Liberal Arts & History | 102 | 11.0% |
| Visual & Performing Arts | 9 | 1.0% |
| Communications | 20 | 2.1% |
| Arts & Humanities | 47 | 5.1% |
| Total | 929 | 100.0% |
Transportation & Commute in Trousdale County
Vehicle Availability by Sex in Trousdale County
The most prevalent vehicle ownership categories in Trousdale County are males with 2 vehicles (1,001, accounting for 37.1%) and females with 2 vehicles (700, making up 45.9%).
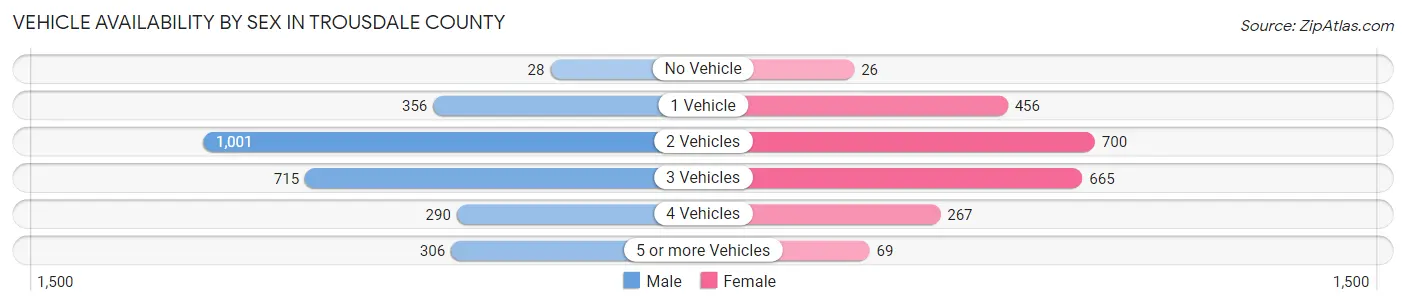
| Vehicles Available | Male | Female |
| No Vehicle | 28 (1.0%) | 26 (1.2%) |
| 1 Vehicle | 356 (13.2%) | 456 (20.9%) |
| 2 Vehicles | 1,001 (37.1%) | 700 (32.1%) |
| 3 Vehicles | 715 (26.5%) | 665 (30.5%) |
| 4 Vehicles | 290 (10.8%) | 267 (12.2%) |
| 5 or more Vehicles | 306 (11.4%) | 69 (3.2%) |
| Total | 2,696 (100.0%) | 2,183 (100.0%) |
Commute Time in Trousdale County
The most frequently occuring commute durations in Trousdale County are 45 to 59 minutes (1,346 commuters, 29.0%), 60 to 89 minutes (727 commuters, 15.7%), and 30 to 34 minutes (442 commuters, 9.5%).
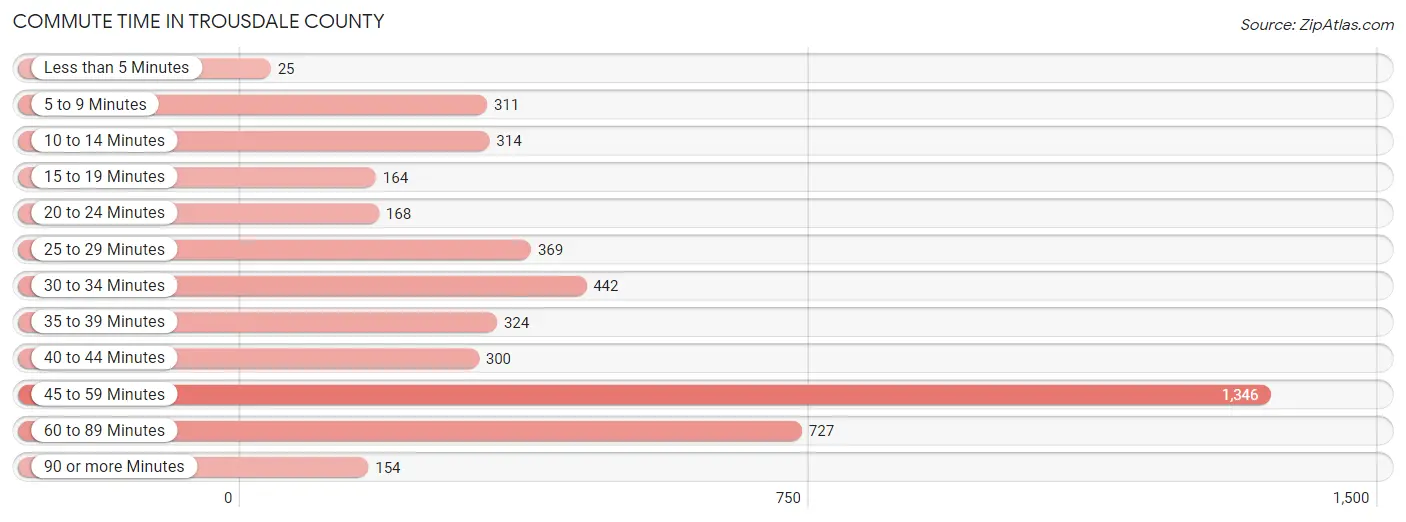
| Commute Time | # Commuters | % Commuters |
| Less than 5 Minutes | 25 | 0.5% |
| 5 to 9 Minutes | 311 | 6.7% |
| 10 to 14 Minutes | 314 | 6.8% |
| 15 to 19 Minutes | 164 | 3.5% |
| 20 to 24 Minutes | 168 | 3.6% |
| 25 to 29 Minutes | 369 | 8.0% |
| 30 to 34 Minutes | 442 | 9.5% |
| 35 to 39 Minutes | 324 | 7.0% |
| 40 to 44 Minutes | 300 | 6.5% |
| 45 to 59 Minutes | 1,346 | 29.0% |
| 60 to 89 Minutes | 727 | 15.7% |
| 90 or more Minutes | 154 | 3.3% |
Commute Time by Sex in Trousdale County
The most common commute times in Trousdale County are 45 to 59 minutes (817 commuters, 30.4%) for males and 45 to 59 minutes (529 commuters, 27.0%) for females.
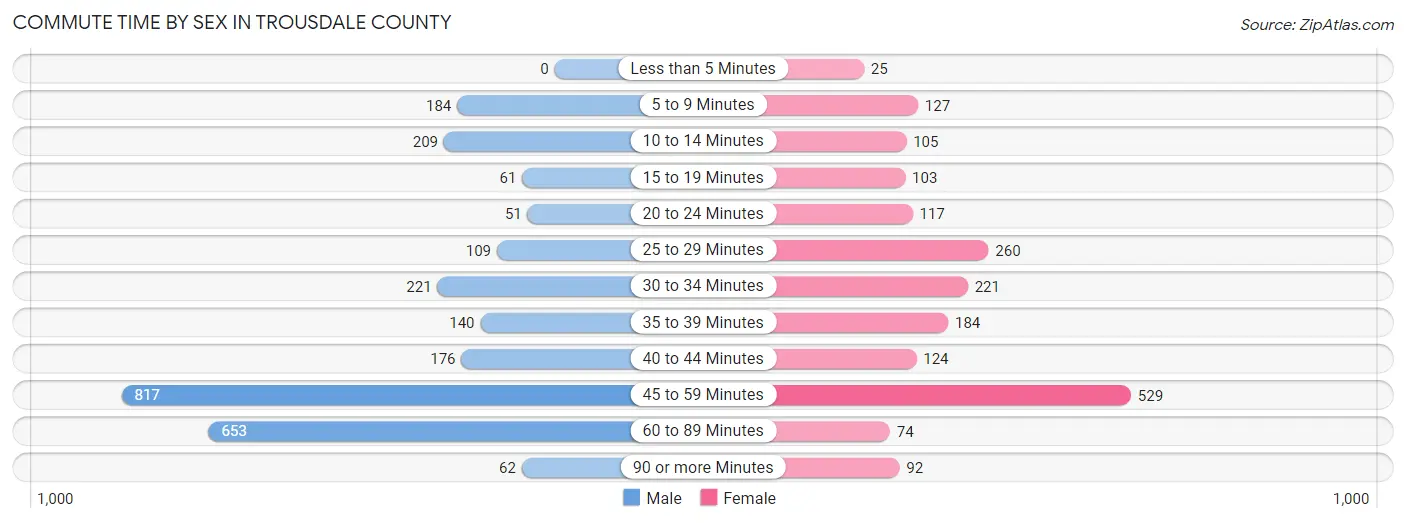
| Commute Time | Male | Female |
| Less than 5 Minutes | 0 (0.0%) | 25 (1.3%) |
| 5 to 9 Minutes | 184 (6.9%) | 127 (6.5%) |
| 10 to 14 Minutes | 209 (7.8%) | 105 (5.3%) |
| 15 to 19 Minutes | 61 (2.3%) | 103 (5.2%) |
| 20 to 24 Minutes | 51 (1.9%) | 117 (6.0%) |
| 25 to 29 Minutes | 109 (4.1%) | 260 (13.3%) |
| 30 to 34 Minutes | 221 (8.2%) | 221 (11.3%) |
| 35 to 39 Minutes | 140 (5.2%) | 184 (9.4%) |
| 40 to 44 Minutes | 176 (6.6%) | 124 (6.3%) |
| 45 to 59 Minutes | 817 (30.4%) | 529 (27.0%) |
| 60 to 89 Minutes | 653 (24.3%) | 74 (3.8%) |
| 90 or more Minutes | 62 (2.3%) | 92 (4.7%) |
Time of Departure to Work by Sex in Trousdale County
The most frequent times of departure to work in Trousdale County are 4:00 PM to 11:59 PM (473, 17.6%) for males and 7:00 AM to 7:29 AM (461, 23.5%) for females.
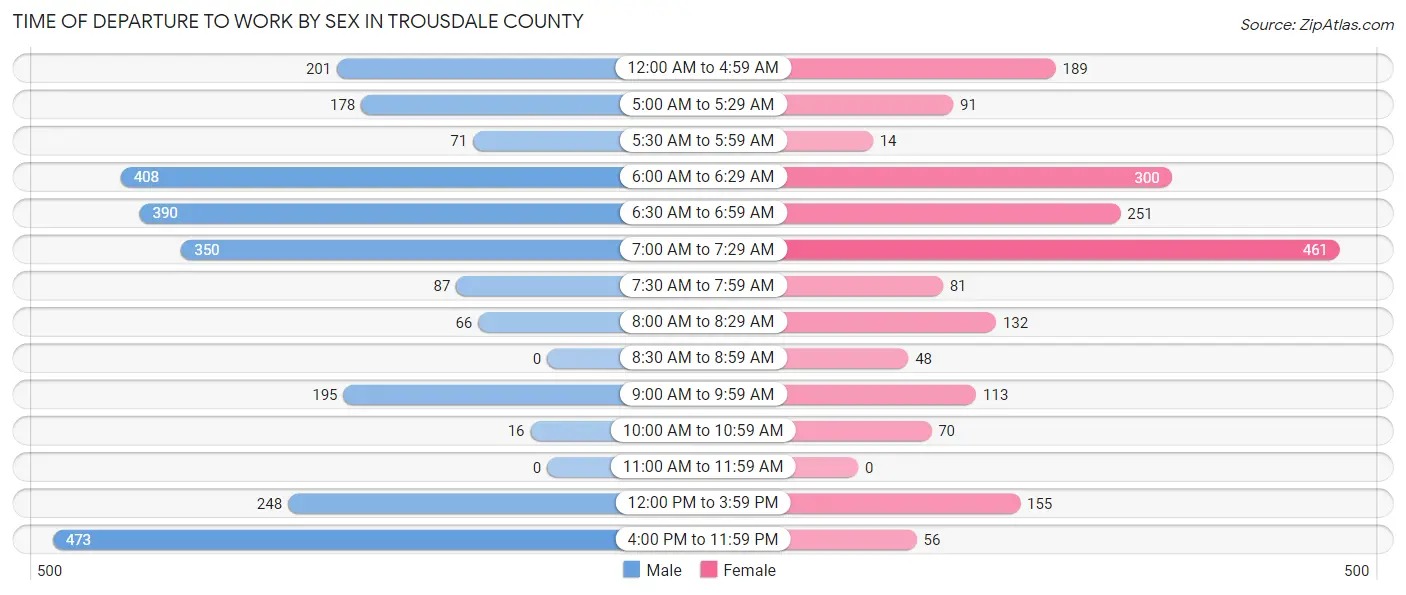
| Time of Departure | Male | Female |
| 12:00 AM to 4:59 AM | 201 (7.5%) | 189 (9.6%) |
| 5:00 AM to 5:29 AM | 178 (6.6%) | 91 (4.6%) |
| 5:30 AM to 5:59 AM | 71 (2.6%) | 14 (0.7%) |
| 6:00 AM to 6:29 AM | 408 (15.2%) | 300 (15.3%) |
| 6:30 AM to 6:59 AM | 390 (14.5%) | 251 (12.8%) |
| 7:00 AM to 7:29 AM | 350 (13.1%) | 461 (23.5%) |
| 7:30 AM to 7:59 AM | 87 (3.2%) | 81 (4.1%) |
| 8:00 AM to 8:29 AM | 66 (2.5%) | 132 (6.7%) |
| 8:30 AM to 8:59 AM | 0 (0.0%) | 48 (2.5%) |
| 9:00 AM to 9:59 AM | 195 (7.3%) | 113 (5.8%) |
| 10:00 AM to 10:59 AM | 16 (0.6%) | 70 (3.6%) |
| 11:00 AM to 11:59 AM | 0 (0.0%) | 0 (0.0%) |
| 12:00 PM to 3:59 PM | 248 (9.2%) | 155 (7.9%) |
| 4:00 PM to 11:59 PM | 473 (17.6%) | 56 (2.9%) |
| Total | 2,683 (100.0%) | 1,961 (100.0%) |
Housing Occupancy in Trousdale County
Occupancy by Ownership in Trousdale County
Of the total 3,552 dwellings in Trousdale County, owner-occupied units account for 2,723 (76.7%), while renter-occupied units make up 829 (23.3%).
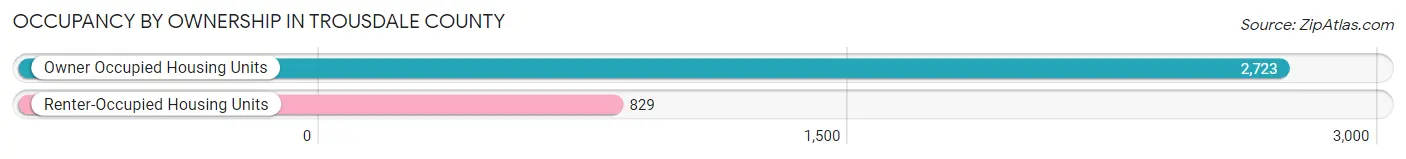
| Occupancy | # Housing Units | % Housing Units |
| Owner Occupied Housing Units | 2,723 | 76.7% |
| Renter-Occupied Housing Units | 829 | 23.3% |
| Total Occupied Housing Units | 3,552 | 100.0% |
Occupancy by Household Size in Trousdale County
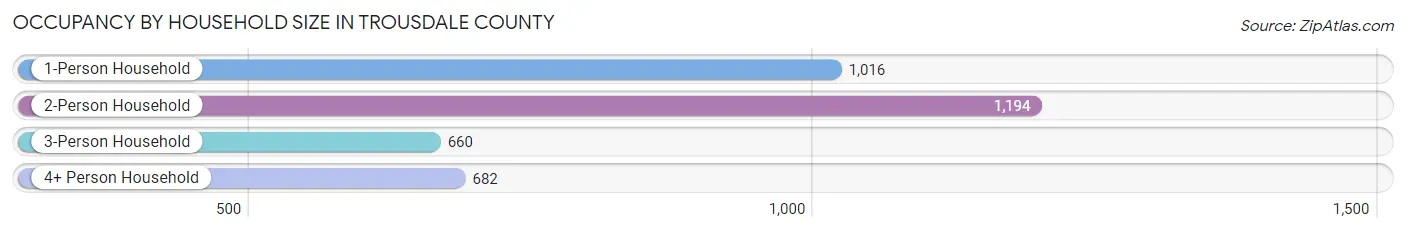
| Household Size | # Housing Units | % Housing Units |
| 1-Person Household | 1,016 | 28.6% |
| 2-Person Household | 1,194 | 33.6% |
| 3-Person Household | 660 | 18.6% |
| 4+ Person Household | 682 | 19.2% |
| Total Housing Units | 3,552 | 100.0% |
Occupancy by Ownership by Household Size in Trousdale County
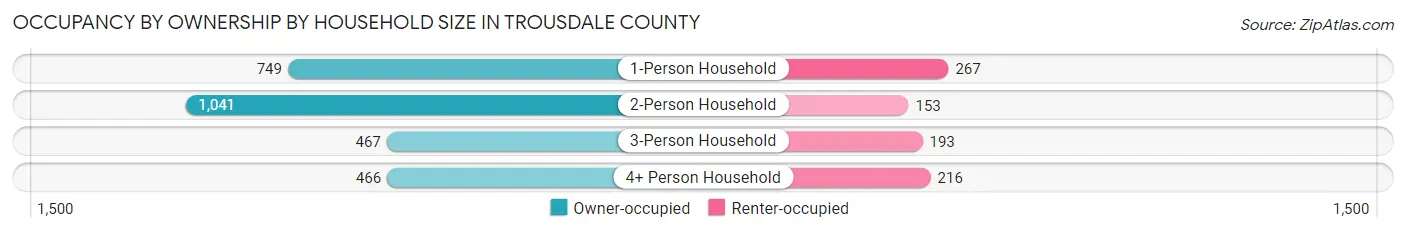
| Household Size | Owner-occupied | Renter-occupied |
| 1-Person Household | 749 (73.7%) | 267 (26.3%) |
| 2-Person Household | 1,041 (87.2%) | 153 (12.8%) |
| 3-Person Household | 467 (70.8%) | 193 (29.2%) |
| 4+ Person Household | 466 (68.3%) | 216 (31.7%) |
| Total Housing Units | 2,723 (76.7%) | 829 (23.3%) |
Occupancy by Educational Attainment in Trousdale County
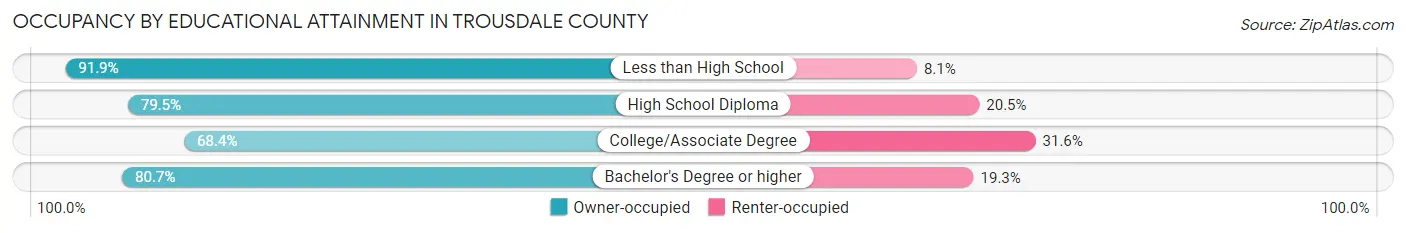
| Household Size | Owner-occupied | Renter-occupied |
| Less than High School | 341 (91.9%) | 30 (8.1%) |
| High School Diploma | 1,061 (79.5%) | 273 (20.5%) |
| College/Associate Degree | 941 (68.4%) | 435 (31.6%) |
| Bachelor's Degree or higher | 380 (80.7%) | 91 (19.3%) |
Occupancy by Age of Householder in Trousdale County
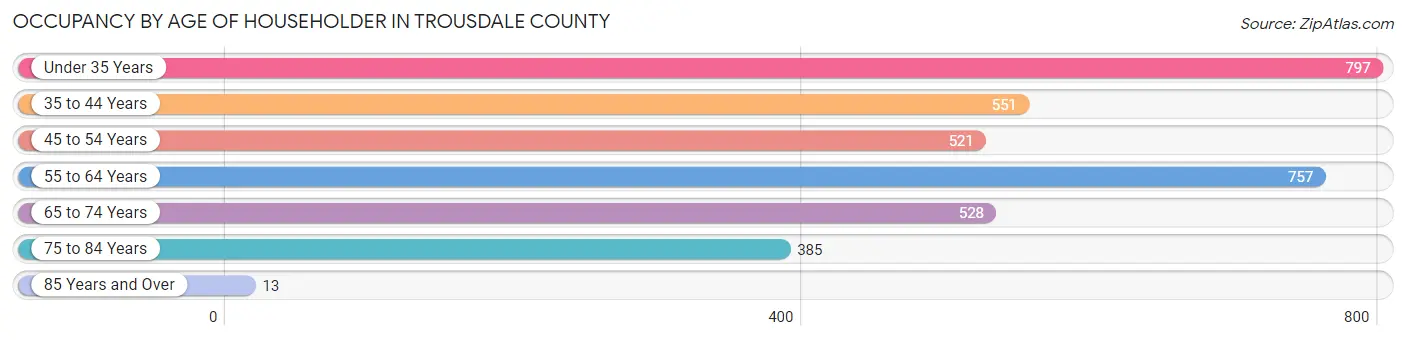
| Age Bracket | # Households | % Households |
| Under 35 Years | 797 | 22.4% |
| 35 to 44 Years | 551 | 15.5% |
| 45 to 54 Years | 521 | 14.7% |
| 55 to 64 Years | 757 | 21.3% |
| 65 to 74 Years | 528 | 14.9% |
| 75 to 84 Years | 385 | 10.8% |
| 85 Years and Over | 13 | 0.4% |
| Total | 3,552 | 100.0% |
Housing Finances in Trousdale County
Median Income by Occupancy in Trousdale County
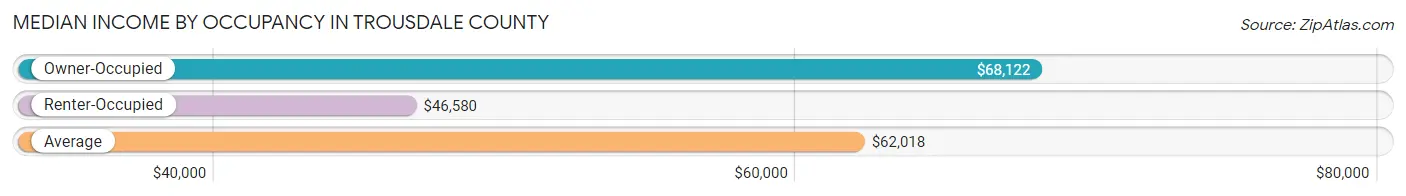
| Occupancy Type | # Households | Median Income |
| Owner-Occupied | 2,723 (76.7%) | $68,122 |
| Renter-Occupied | 829 (23.3%) | $46,580 |
| Average | 3,552 (100.0%) | $62,018 |
Occupancy by Householder Income Bracket in Trousdale County
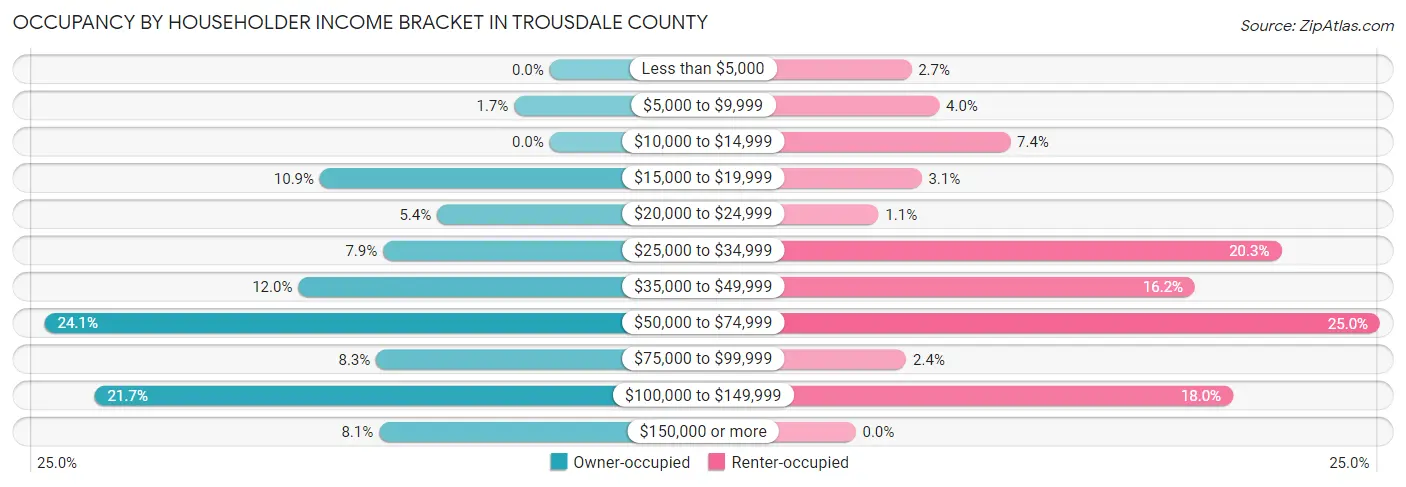
| Income Bracket | Owner-occupied | Renter-occupied |
| Less than $5,000 | 0 (0.0%) | 22 (2.6%) |
| $5,000 to $9,999 | 46 (1.7%) | 33 (4.0%) |
| $10,000 to $14,999 | 0 (0.0%) | 61 (7.4%) |
| $15,000 to $19,999 | 298 (10.9%) | 26 (3.1%) |
| $20,000 to $24,999 | 146 (5.4%) | 9 (1.1%) |
| $25,000 to $34,999 | 216 (7.9%) | 168 (20.3%) |
| $35,000 to $49,999 | 326 (12.0%) | 134 (16.2%) |
| $50,000 to $74,999 | 655 (24.0%) | 207 (25.0%) |
| $75,000 to $99,999 | 225 (8.3%) | 20 (2.4%) |
| $100,000 to $149,999 | 590 (21.7%) | 149 (18.0%) |
| $150,000 or more | 221 (8.1%) | 0 (0.0%) |
| Total | 2,723 (100.0%) | 829 (100.0%) |
Monthly Housing Cost Tiers in Trousdale County
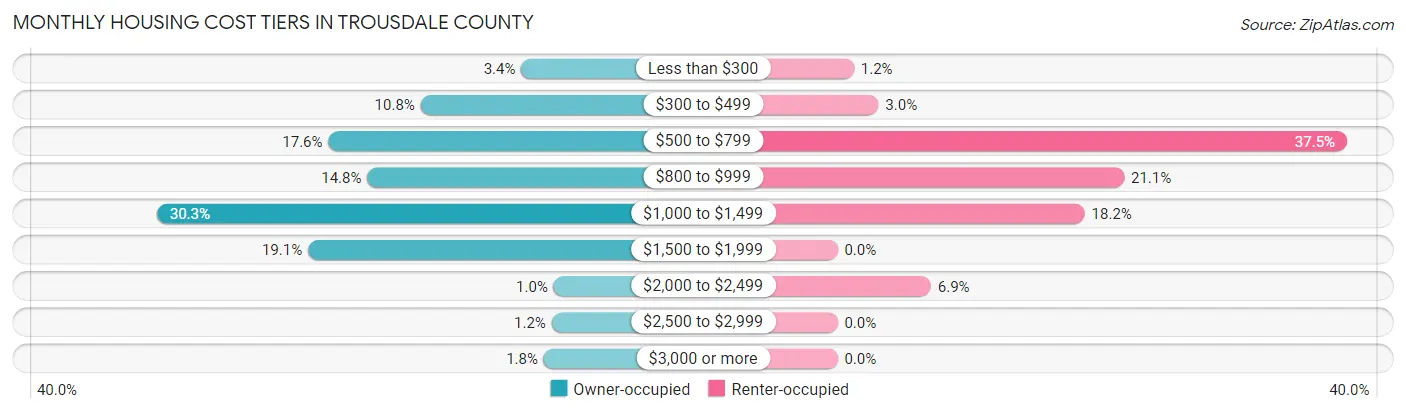
| Monthly Cost | Owner-occupied | Renter-occupied |
| Less than $300 | 93 (3.4%) | 10 (1.2%) |
| $300 to $499 | 295 (10.8%) | 25 (3.0%) |
| $500 to $799 | 480 (17.6%) | 311 (37.5%) |
| $800 to $999 | 402 (14.8%) | 175 (21.1%) |
| $1,000 to $1,499 | 824 (30.3%) | 151 (18.2%) |
| $1,500 to $1,999 | 521 (19.1%) | 0 (0.0%) |
| $2,000 to $2,499 | 28 (1.0%) | 57 (6.9%) |
| $2,500 to $2,999 | 32 (1.2%) | 0 (0.0%) |
| $3,000 or more | 48 (1.8%) | 0 (0.0%) |
| Total | 2,723 (100.0%) | 829 (100.0%) |
Physical Housing Characteristics in Trousdale County
Housing Structures in Trousdale County
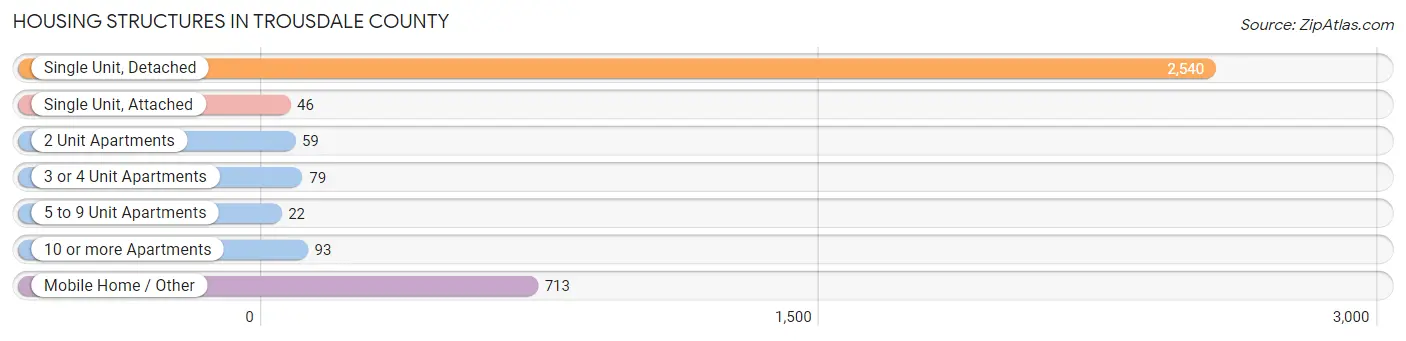
| Structure Type | # Housing Units | % Housing Units |
| Single Unit, Detached | 2,540 | 71.5% |
| Single Unit, Attached | 46 | 1.3% |
| 2 Unit Apartments | 59 | 1.7% |
| 3 or 4 Unit Apartments | 79 | 2.2% |
| 5 to 9 Unit Apartments | 22 | 0.6% |
| 10 or more Apartments | 93 | 2.6% |
| Mobile Home / Other | 713 | 20.1% |
| Total | 3,552 | 100.0% |
Housing Structures by Occupancy in Trousdale County
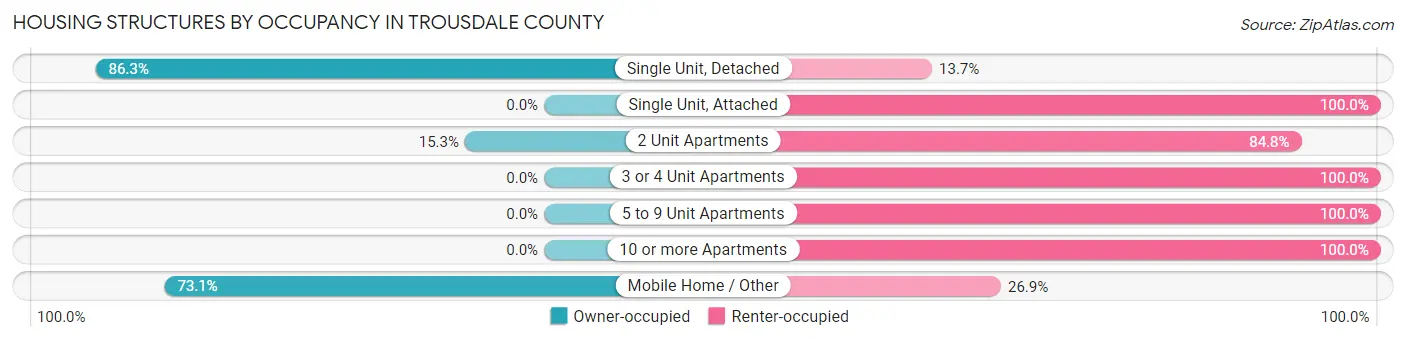
| Structure Type | Owner-occupied | Renter-occupied |
| Single Unit, Detached | 2,193 (86.3%) | 347 (13.7%) |
| Single Unit, Attached | 0 (0.0%) | 46 (100.0%) |
| 2 Unit Apartments | 9 (15.2%) | 50 (84.8%) |
| 3 or 4 Unit Apartments | 0 (0.0%) | 79 (100.0%) |
| 5 to 9 Unit Apartments | 0 (0.0%) | 22 (100.0%) |
| 10 or more Apartments | 0 (0.0%) | 93 (100.0%) |
| Mobile Home / Other | 521 (73.1%) | 192 (26.9%) |
| Total | 2,723 (76.7%) | 829 (23.3%) |
Housing Structures by Number of Rooms in Trousdale County
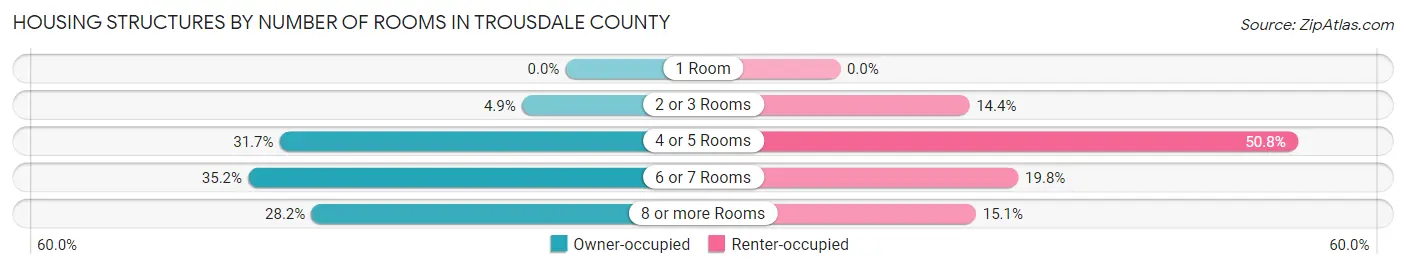
| Number of Rooms | Owner-occupied | Renter-occupied |
| 1 Room | 0 (0.0%) | 0 (0.0%) |
| 2 or 3 Rooms | 132 (4.9%) | 119 (14.3%) |
| 4 or 5 Rooms | 864 (31.7%) | 421 (50.8%) |
| 6 or 7 Rooms | 959 (35.2%) | 164 (19.8%) |
| 8 or more Rooms | 768 (28.2%) | 125 (15.1%) |
| Total | 2,723 (100.0%) | 829 (100.0%) |
Housing Structure by Heating Type in Trousdale County
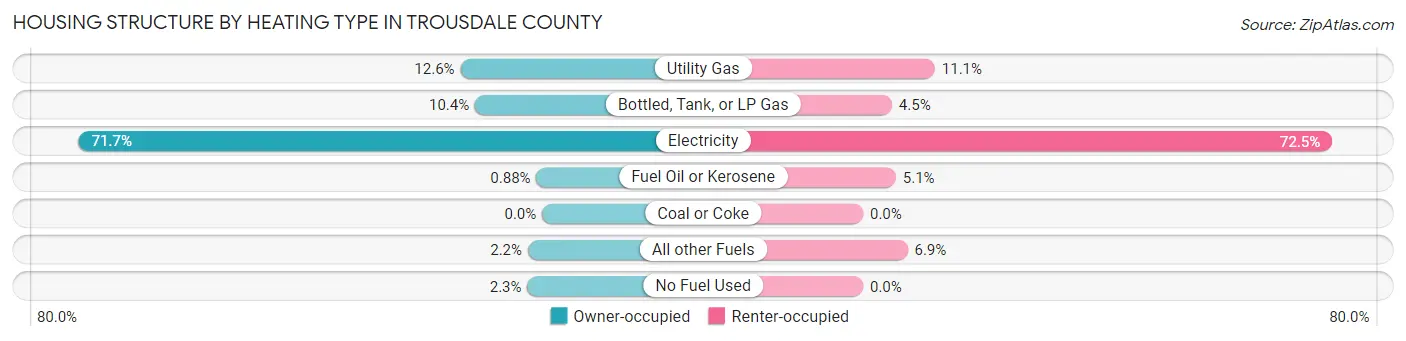
| Heating Type | Owner-occupied | Renter-occupied |
| Utility Gas | 344 (12.6%) | 92 (11.1%) |
| Bottled, Tank, or LP Gas | 282 (10.4%) | 37 (4.5%) |
| Electricity | 1,951 (71.7%) | 601 (72.5%) |
| Fuel Oil or Kerosene | 24 (0.9%) | 42 (5.1%) |
| Coal or Coke | 0 (0.0%) | 0 (0.0%) |
| All other Fuels | 60 (2.2%) | 57 (6.9%) |
| No Fuel Used | 62 (2.3%) | 0 (0.0%) |
| Total | 2,723 (100.0%) | 829 (100.0%) |
Household Vehicle Usage in Trousdale County
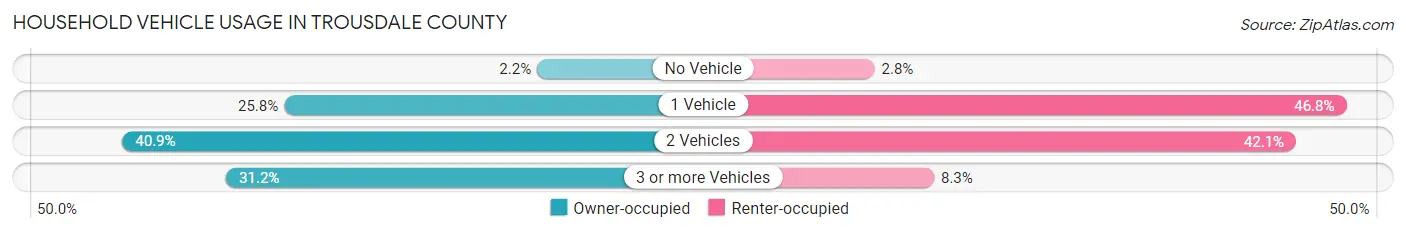
| Vehicles per Household | Owner-occupied | Renter-occupied |
| No Vehicle | 59 (2.2%) | 23 (2.8%) |
| 1 Vehicle | 702 (25.8%) | 388 (46.8%) |
| 2 Vehicles | 1,113 (40.9%) | 349 (42.1%) |
| 3 or more Vehicles | 849 (31.2%) | 69 (8.3%) |
| Total | 2,723 (100.0%) | 829 (100.0%) |
Real Estate & Mortgages in Trousdale County
Real Estate and Mortgage Overview in Trousdale County
| Characteristic | Without Mortgage | With Mortgage |
| Housing Units | 961 | 1,762 |
| Median Property Value | $163,900 | $234,200 |
| Median Household Income | $64,760 | $157 |
| Monthly Housing Costs | $585 | $48 |
| Real Estate Taxes | $1,320 | $0 |
Property Value by Mortgage Status in Trousdale County
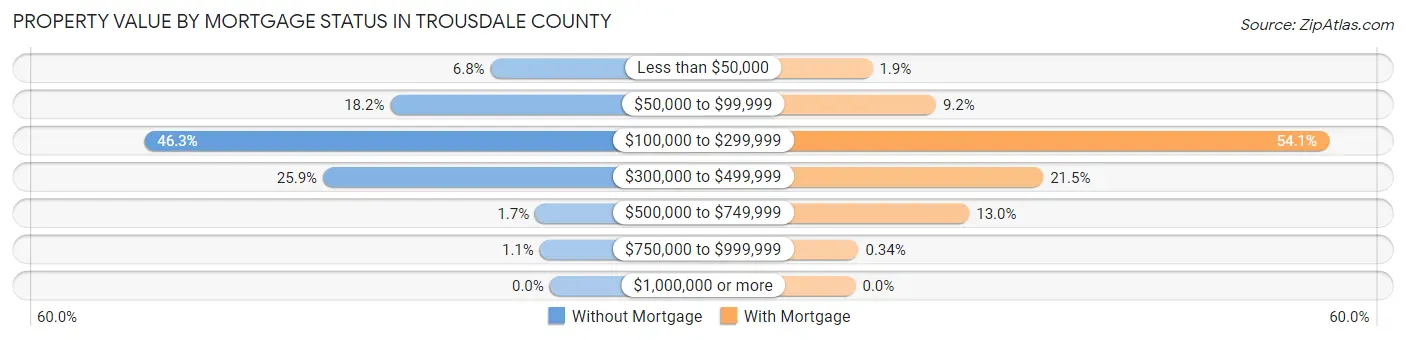
| Property Value | Without Mortgage | With Mortgage |
| Less than $50,000 | 65 (6.8%) | 34 (1.9%) |
| $50,000 to $99,999 | 175 (18.2%) | 162 (9.2%) |
| $100,000 to $299,999 | 445 (46.3%) | 953 (54.1%) |
| $300,000 to $499,999 | 249 (25.9%) | 378 (21.4%) |
| $500,000 to $749,999 | 16 (1.7%) | 229 (13.0%) |
| $750,000 to $999,999 | 11 (1.1%) | 6 (0.3%) |
| $1,000,000 or more | 0 (0.0%) | 0 (0.0%) |
| Total | 961 (100.0%) | 1,762 (100.0%) |
Household Income by Mortgage Status in Trousdale County
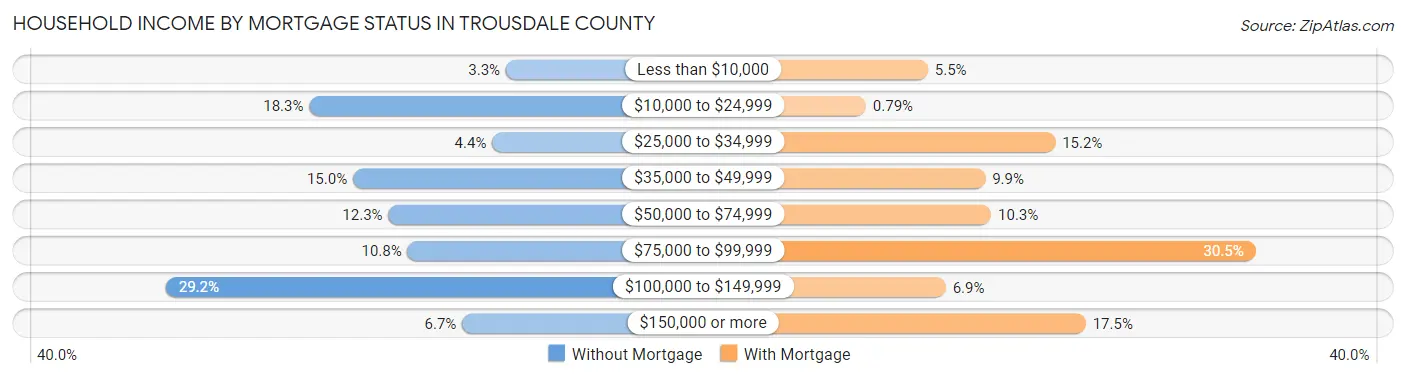
| Household Income | Without Mortgage | With Mortgage |
| Less than $10,000 | 32 (3.3%) | 97 (5.5%) |
| $10,000 to $24,999 | 176 (18.3%) | 14 (0.8%) |
| $25,000 to $34,999 | 42 (4.4%) | 268 (15.2%) |
| $35,000 to $49,999 | 144 (15.0%) | 174 (9.9%) |
| $50,000 to $74,999 | 118 (12.3%) | 182 (10.3%) |
| $75,000 to $99,999 | 104 (10.8%) | 537 (30.5%) |
| $100,000 to $149,999 | 281 (29.2%) | 121 (6.9%) |
| $150,000 or more | 64 (6.7%) | 309 (17.5%) |
| Total | 961 (100.0%) | 1,762 (100.0%) |
Property Value to Household Income Ratio in Trousdale County
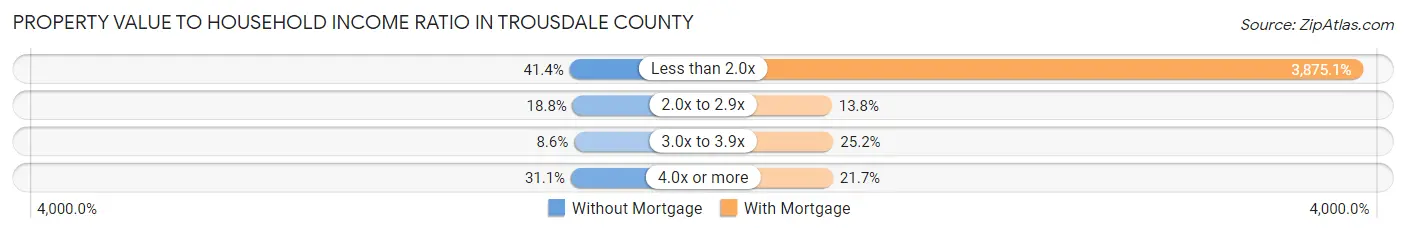
| Value-to-Income Ratio | Without Mortgage | With Mortgage |
| Less than 2.0x | 398 (41.4%) | 68,279 (3,875.1%) |
| 2.0x to 2.9x | 181 (18.8%) | 243 (13.8%) |
| 3.0x to 3.9x | 83 (8.6%) | 444 (25.2%) |
| 4.0x or more | 299 (31.1%) | 383 (21.7%) |
| Total | 961 (100.0%) | 1,762 (100.0%) |
Real Estate Taxes by Mortgage Status in Trousdale County
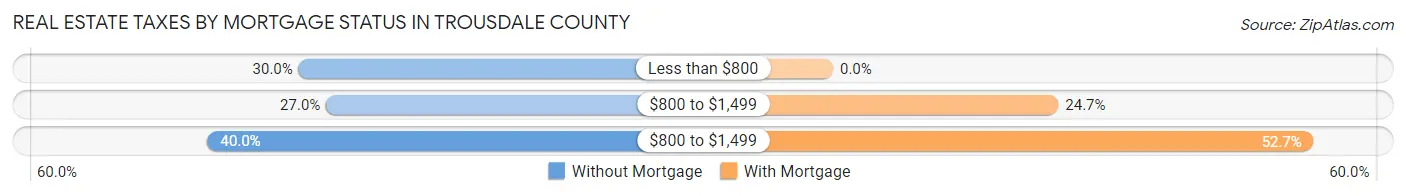
| Property Taxes | Without Mortgage | With Mortgage |
| Less than $800 | 288 (30.0%) | 0 (0.0%) |
| $800 to $1,499 | 259 (27.0%) | 435 (24.7%) |
| $800 to $1,499 | 384 (40.0%) | 928 (52.7%) |
| Total | 961 (100.0%) | 1,762 (100.0%) |
Health & Disability in Trousdale County
Health Insurance Coverage by Age in Trousdale County
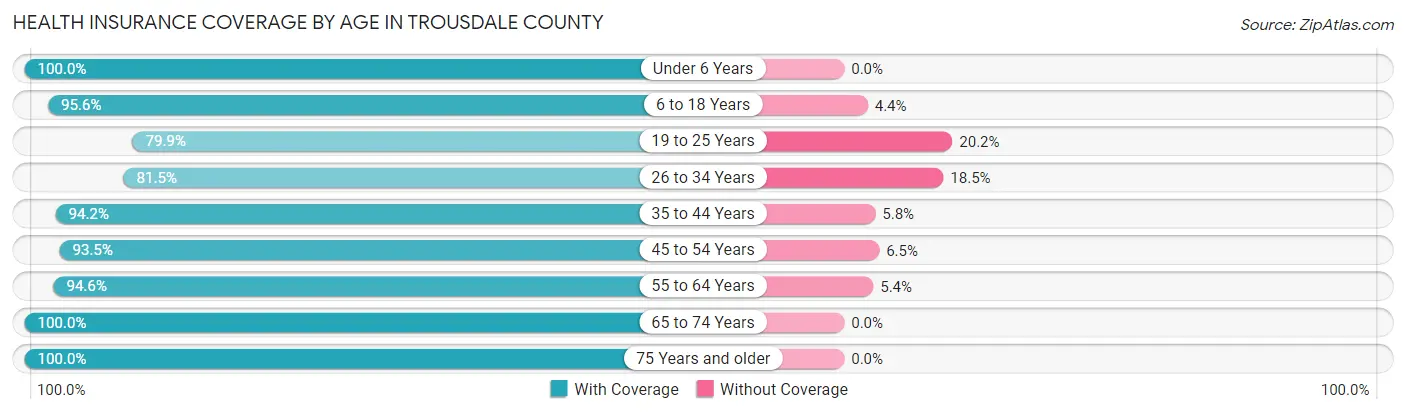
| Age Bracket | With Coverage | Without Coverage |
| Under 6 Years | 652 (100.0%) | 0 (0.0%) |
| 6 to 18 Years | 1,375 (95.6%) | 63 (4.4%) |
| 19 to 25 Years | 1,046 (79.8%) | 264 (20.2%) |
| 26 to 34 Years | 1,354 (81.5%) | 307 (18.5%) |
| 35 to 44 Years | 797 (94.2%) | 49 (5.8%) |
| 45 to 54 Years | 819 (93.5%) | 57 (6.5%) |
| 55 to 64 Years | 1,032 (94.6%) | 59 (5.4%) |
| 65 to 74 Years | 831 (100.0%) | 0 (0.0%) |
| 75 Years and older | 503 (100.0%) | 0 (0.0%) |
| Total | 8,409 (91.3%) | 799 (8.7%) |
Health Insurance Coverage by Citizenship Status in Trousdale County
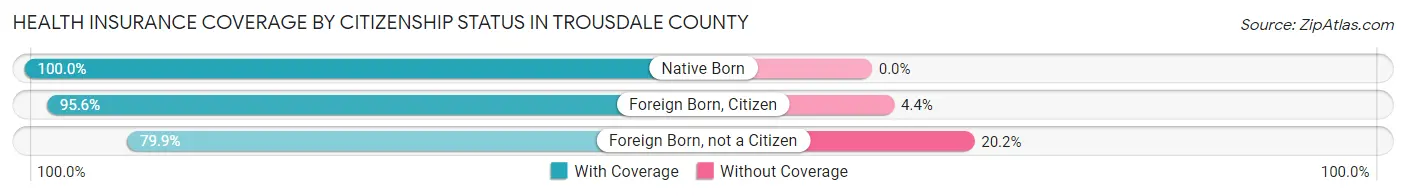
| Citizenship Status | With Coverage | Without Coverage |
| Native Born | 652 (100.0%) | 0 (0.0%) |
| Foreign Born, Citizen | 1,375 (95.6%) | 63 (4.4%) |
| Foreign Born, not a Citizen | 1,046 (79.8%) | 264 (20.2%) |
Health Insurance Coverage by Household Income in Trousdale County
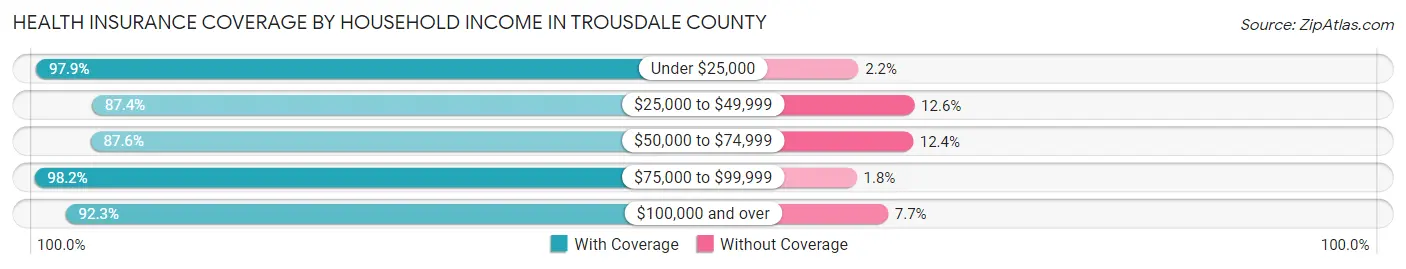
| Household Income | With Coverage | Without Coverage |
| Under $25,000 | 955 (97.9%) | 21 (2.1%) |
| $25,000 to $49,999 | 1,329 (87.4%) | 192 (12.6%) |
| $50,000 to $74,999 | 1,884 (87.6%) | 266 (12.4%) |
| $75,000 to $99,999 | 481 (98.2%) | 9 (1.8%) |
| $100,000 and over | 3,732 (92.3%) | 311 (7.7%) |
Public vs Private Health Insurance Coverage by Age in Trousdale County
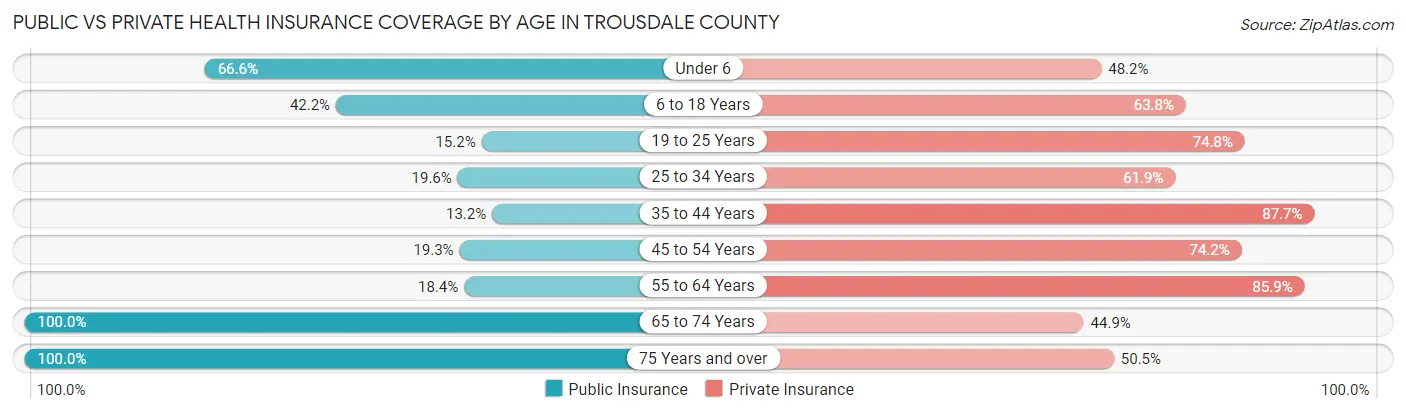
| Age Bracket | Public Insurance | Private Insurance |
| Under 6 | 434 (66.6%) | 314 (48.2%) |
| 6 to 18 Years | 607 (42.2%) | 918 (63.8%) |
| 19 to 25 Years | 199 (15.2%) | 980 (74.8%) |
| 25 to 34 Years | 326 (19.6%) | 1,028 (61.9%) |
| 35 to 44 Years | 112 (13.2%) | 742 (87.7%) |
| 45 to 54 Years | 169 (19.3%) | 650 (74.2%) |
| 55 to 64 Years | 201 (18.4%) | 937 (85.9%) |
| 65 to 74 Years | 831 (100.0%) | 373 (44.9%) |
| 75 Years and over | 503 (100.0%) | 254 (50.5%) |
| Total | 3,382 (36.7%) | 6,196 (67.3%) |
Disability Status by Sex by Age in Trousdale County
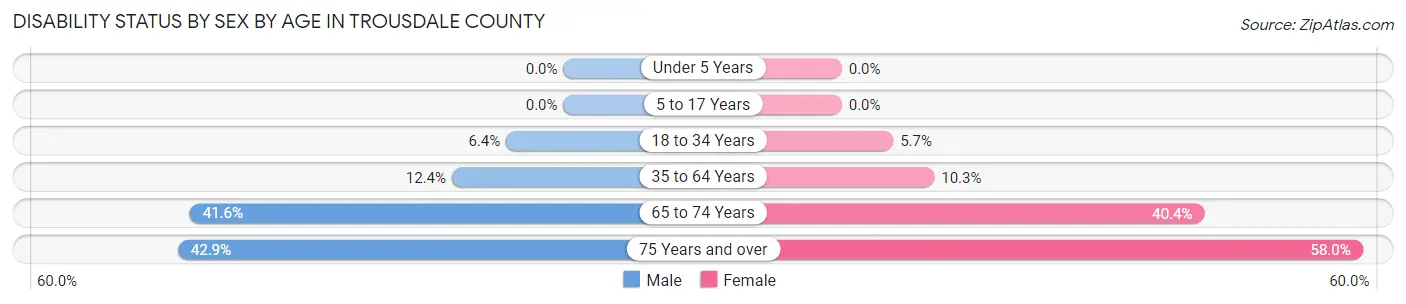
| Age Bracket | Male | Female |
| Under 5 Years | 0 (0.0%) | 0 (0.0%) |
| 5 to 17 Years | 0 (0.0%) | 0 (0.0%) |
| 18 to 34 Years | 133 (6.4%) | 61 (5.7%) |
| 35 to 64 Years | 136 (12.4%) | 177 (10.3%) |
| 65 to 74 Years | 151 (41.6%) | 189 (40.4%) |
| 75 Years and over | 79 (42.9%) | 185 (58.0%) |
Disability Class by Sex by Age in Trousdale County
Disability Class: Hearing Difficulty
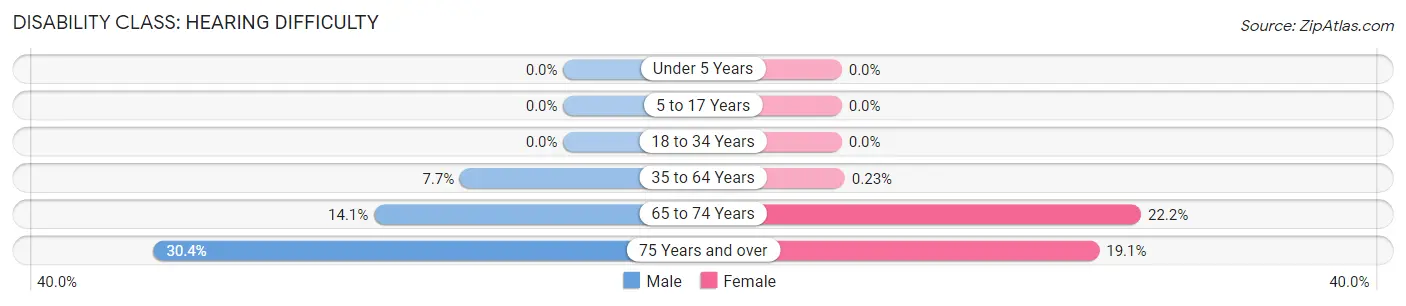
| Age Bracket | Male | Female |
| Under 5 Years | 0 (0.0%) | 0 (0.0%) |
| 5 to 17 Years | 0 (0.0%) | 0 (0.0%) |
| 18 to 34 Years | 0 (0.0%) | 0 (0.0%) |
| 35 to 64 Years | 84 (7.7%) | 4 (0.2%) |
| 65 to 74 Years | 51 (14.1%) | 104 (22.2%) |
| 75 Years and over | 56 (30.4%) | 61 (19.1%) |
Disability Class: Vision Difficulty
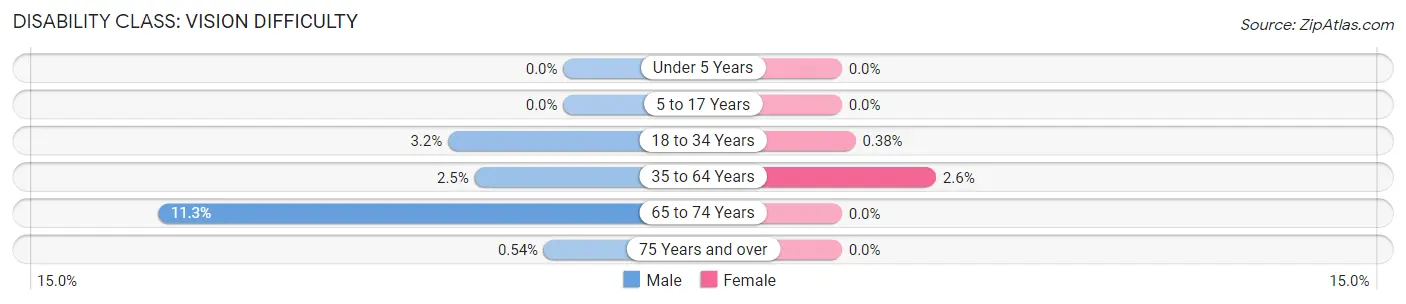
| Age Bracket | Male | Female |
| Under 5 Years | 0 (0.0%) | 0 (0.0%) |
| 5 to 17 Years | 0 (0.0%) | 0 (0.0%) |
| 18 to 34 Years | 67 (3.2%) | 4 (0.4%) |
| 35 to 64 Years | 27 (2.5%) | 45 (2.6%) |
| 65 to 74 Years | 41 (11.3%) | 0 (0.0%) |
| 75 Years and over | 1 (0.5%) | 0 (0.0%) |
Disability Class: Cognitive Difficulty
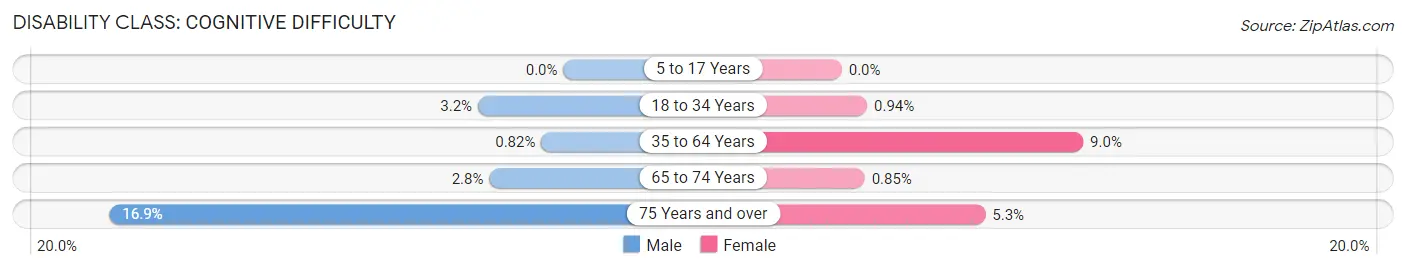
| Age Bracket | Male | Female |
| 5 to 17 Years | 0 (0.0%) | 0 (0.0%) |
| 18 to 34 Years | 66 (3.2%) | 10 (0.9%) |
| 35 to 64 Years | 9 (0.8%) | 154 (9.0%) |
| 65 to 74 Years | 10 (2.8%) | 4 (0.9%) |
| 75 Years and over | 31 (16.9%) | 17 (5.3%) |
Disability Class: Ambulatory Difficulty
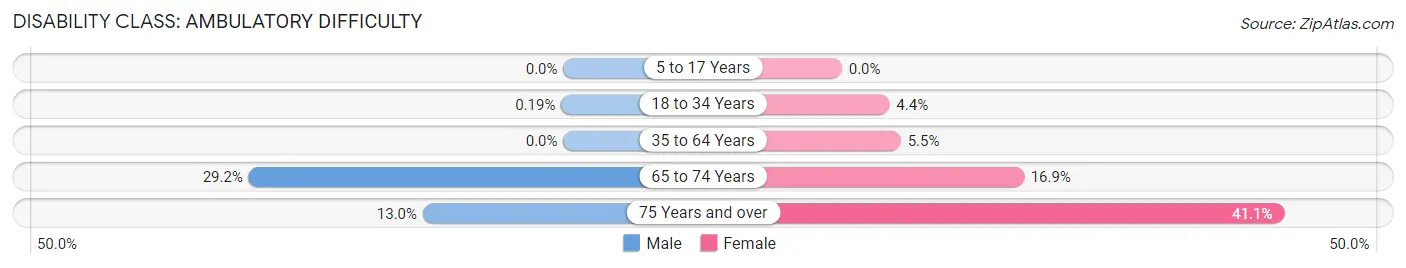
| Age Bracket | Male | Female |
| 5 to 17 Years | 0 (0.0%) | 0 (0.0%) |
| 18 to 34 Years | 4 (0.2%) | 47 (4.4%) |
| 35 to 64 Years | 0 (0.0%) | 94 (5.5%) |
| 65 to 74 Years | 106 (29.2%) | 79 (16.9%) |
| 75 Years and over | 24 (13.0%) | 131 (41.1%) |
Disability Class: Self-Care Difficulty
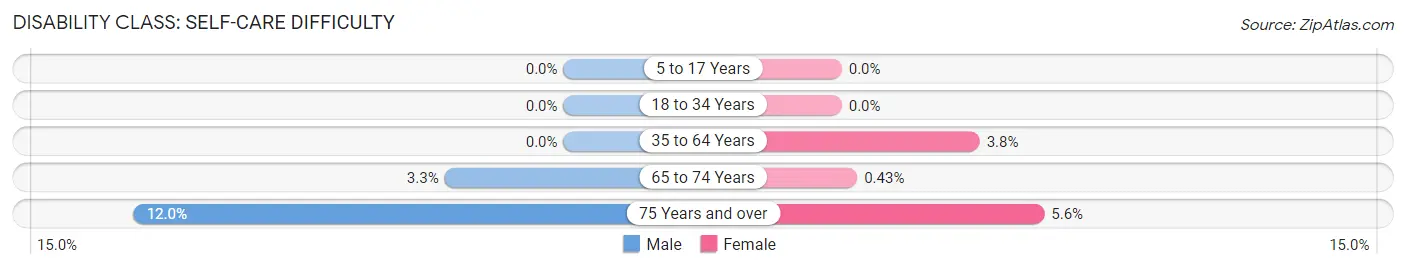
| Age Bracket | Male | Female |
| 5 to 17 Years | 0 (0.0%) | 0 (0.0%) |
| 18 to 34 Years | 0 (0.0%) | 0 (0.0%) |
| 35 to 64 Years | 0 (0.0%) | 66 (3.8%) |
| 65 to 74 Years | 12 (3.3%) | 2 (0.4%) |
| 75 Years and over | 22 (12.0%) | 18 (5.6%) |
Technology Access in Trousdale County
Computing Device Access in Trousdale County
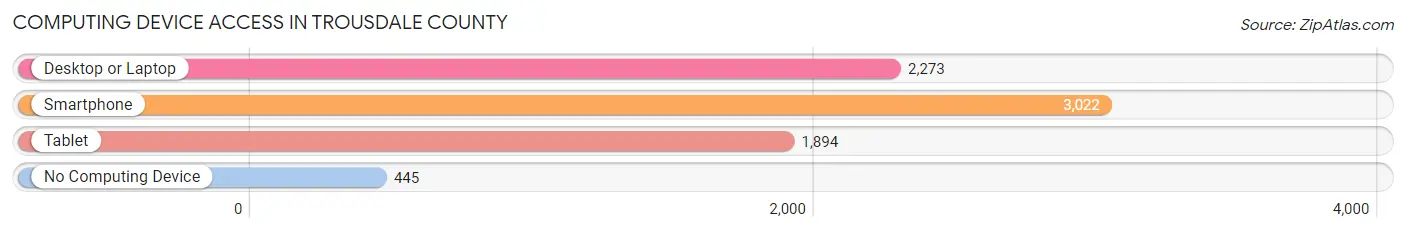
| Device Type | # Households | % Households |
| Desktop or Laptop | 2,273 | 64.0% |
| Smartphone | 3,022 | 85.1% |
| Tablet | 1,894 | 53.3% |
| No Computing Device | 445 | 12.5% |
| Total | 3,552 | 100.0% |
Internet Access in Trousdale County
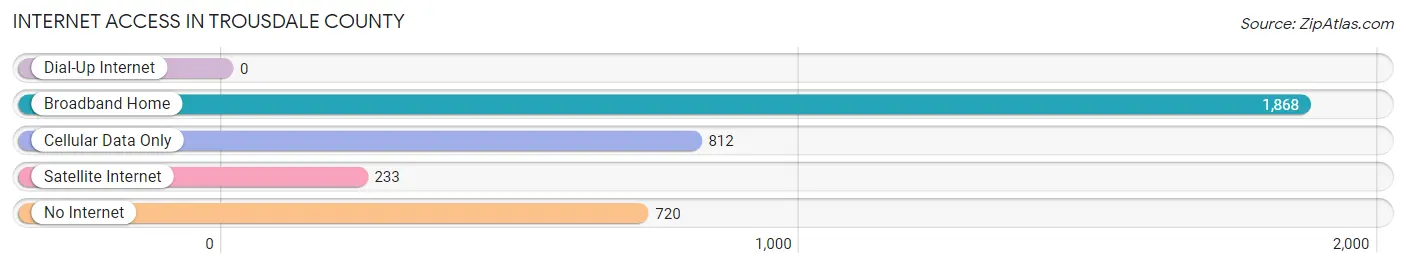
| Internet Type | # Households | % Households |
| Dial-Up Internet | 0 | 0.0% |
| Broadband Home | 1,868 | 52.6% |
| Cellular Data Only | 812 | 22.9% |
| Satellite Internet | 233 | 6.6% |
| No Internet | 720 | 20.3% |
| Total | 3,552 | 100.0% |
Trousdale County Summary
Trousdale County is a county located in the U.S. state of Tennessee. As of the 2010 census, the population was 7,870, making it the second-least populous county in Tennessee. Its county seat is Hartsville. The county was created in 1870 and named for William Trousdale, a Brigadier General in the Mexican–American War and Governor of Tennessee from 1849 to 1851.
History
Trousdale County was formed in 1870 from parts of Sumner and Smith Counties. It was named for William Trousdale, a Brigadier General in the Mexican–American War and Governor of Tennessee from 1849 to 1851. The county seat, Hartsville, was established in 1871.
The county was largely rural and agricultural until the 1950s, when the Tennessee Valley Authority (TVA) began to build dams and reservoirs in the area. This led to an influx of people and businesses, and the county's population began to grow.
Geography
Trousdale County is located in the northern part of Middle Tennessee, about 50 miles northeast of Nashville. It is bordered by Sumner County to the north, Smith County to the east, Macon County to the south, and Wilson County to the west.
The county is mostly flat, with some rolling hills in the northern part. The Cumberland River forms the western border of the county, and the Stones River forms the eastern border. The county is drained by several creeks, including the Harpeth River, which flows through the county seat of Hartsville.
The county has a total area of 183 square miles, of which 181 square miles is land and 2 square miles (1.1%) is water.
Economy
Trousdale County's economy is largely based on agriculture and manufacturing. The county is home to several large farms, which produce corn, soybeans, wheat, and other crops. The county also has several manufacturing plants, including a paper mill, a furniture factory, and a plastics plant.
The county is also home to several tourist attractions, including the Trousdale County Museum, the Trousdale County Historical Society, and the Trousdale County Fair.
Demographics
As of the 2010 census, there were 7,870 people, 2,945 households, and 2,092 families living in the county. The population density was 43.3 people per square mile (16.7/km2). There were 3,323 housing units at an average density of 18.3 per square mile (7.1/km2). The racial makeup of the county was 87.2% White, 9.3% Black or African American, 0.3% Native American, 0.2% Asian, 0.1% Pacific Islander, 1.7% from other races, and 1.4% from two or more races. 2.7% of the population were Hispanic or Latino of any race.
There were 2,945 households, out of which 32.2% had children under the age of 18 living with them, 54.2% were married couples living together, 12.7% had a female householder with no husband present, and 28.2% were non-families. 24.3% of all households were made up of individuals, and 10.2% had someone living alone who was 65 years of age or older. The average household size was 2.56 and the average family size was 3.03.
In the county, the population was spread out, with 24.7% under the age of 18, 8.2% from 18 to 24, 28.2% from 25 to 44, 25.2% from 45 to 64, and 13.7% who were 65 years of age or older. The median age was 37 years. For every 100 females, there were 97.2 males. For every 100 females age 18 and over, there were 94.2 males.
The median income for a household in the county was $32,917, and the median income for a family was $39,945. Males had a median income of $30,917 versus $21,917 for females. The per capita income for the county was $15,945. About 11.2% of families and 14.2% of the population were below the poverty line, including 17.2% of those under age 18 and 17.2% of those age 65 or over.
Common Questions
What is Per Capita Income in Trousdale County?
Per Capita income in Trousdale County is $26,522.
What is the Median Family Income in Trousdale County?
Median Family Income in Trousdale County is $65,857.
What is the Median Household income in Trousdale County?
Median Household Income in Trousdale County is $62,018.
What is Income or Wage Gap in Trousdale County?
Income or Wage Gap in Trousdale County is 12.8%.
Women in Trousdale County earn 87.2 cents for every dollar earned by a man.
What is Inequality or Gini Index in Trousdale County?
Inequality or Gini Index in Trousdale County is 0.39.
What is the Total Population of Trousdale County?
Total Population of Trousdale County is 11,596.
What is the Total Male Population of Trousdale County?
Total Male Population of Trousdale County is 7,204.
What is the Total Female Population of Trousdale County?
Total Female Population of Trousdale County is 4,392.
What is the Ratio of Males per 100 Females in Trousdale County?
There are 164.03 Males per 100 Females in Trousdale County.
What is the Ratio of Females per 100 Males in Trousdale County?
There are 60.97 Females per 100 Males in Trousdale County.
What is the Median Population Age in Trousdale County?
Median Population Age in Trousdale County is 34.6 Years.
What is the Average Family Size in Trousdale County
Average Family Size in Trousdale County is 3.2 People.
What is the Average Household Size in Trousdale County
Average Household Size in Trousdale County is 2.6 People.
How Large is the Labor Force in Trousdale County?
There are 5,164 People in the Labor Forcein in Trousdale County.
What is the Percentage of People in the Labor Force in Trousdale County?
52.2% of People are in the Labor Force in Trousdale County.
What is the Unemployment Rate in Trousdale County?
Unemployment Rate in Trousdale County is 0.8%.