Maury County, TN Map & Demographics
Maury County Overview
$35,733
PER CAPITA INCOME
$83,154
AVG FAMILY INCOME
$71,500
AVG HOUSEHOLD INCOME
26.0%
WAGE / INCOME GAP [ % ]
74.0¢/ $1
WAGE / INCOME GAP [ $ ]
$8,929
FAMILY INCOME DEFICIT
0.42
INEQUALITY / GINI INDEX
102,002
TOTAL POPULATION
49,972
MALE POPULATION
52,030
FEMALE POPULATION
96.04
MALES / 100 FEMALES
104.12
FEMALES / 100 MALES
39.4
MEDIAN AGE
3.0
AVG FAMILY SIZE
2.5
AVG HOUSEHOLD SIZE
52,031
LABOR FORCE [ PEOPLE ]
64.0%
PERCENT IN LABOR FORCE
2.5%
UNEMPLOYMENT RATE
Income in Maury County
Income Overview in Maury County
Per Capita Income in Maury County is $35,733, while median incomes of families and households are $83,154 and $71,500 respectively.
| Characteristic | Number | Measure |
| Per Capita Income | 102,002 | $35,733 |
| Median Family Income | 27,648 | $83,154 |
| Mean Family Income | 27,648 | $102,621 |
| Median Household Income | 39,591 | $71,500 |
| Mean Household Income | 39,591 | $89,976 |
| Income Deficit | 27,648 | $8,929 |
| Wage / Income Gap (%) | 102,002 | 26.01% |
| Wage / Income Gap ($) | 102,002 | 73.99¢ per $1 |
| Gini / Inequality Index | 102,002 | 0.42 |
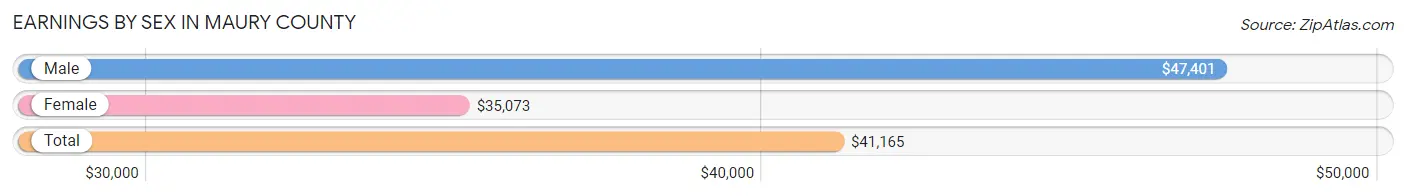
Earnings by Sex in Maury County
Average Earnings in Maury County are $41,165, $47,401 for men and $35,073 for women, a difference of 26.0%.
| Sex | Number | Average Earnings |
| Male | 28,781 (53.4%) | $47,401 |
| Female | 25,084 (46.6%) | $35,073 |
| Total | 53,865 (100.0%) | $41,165 |
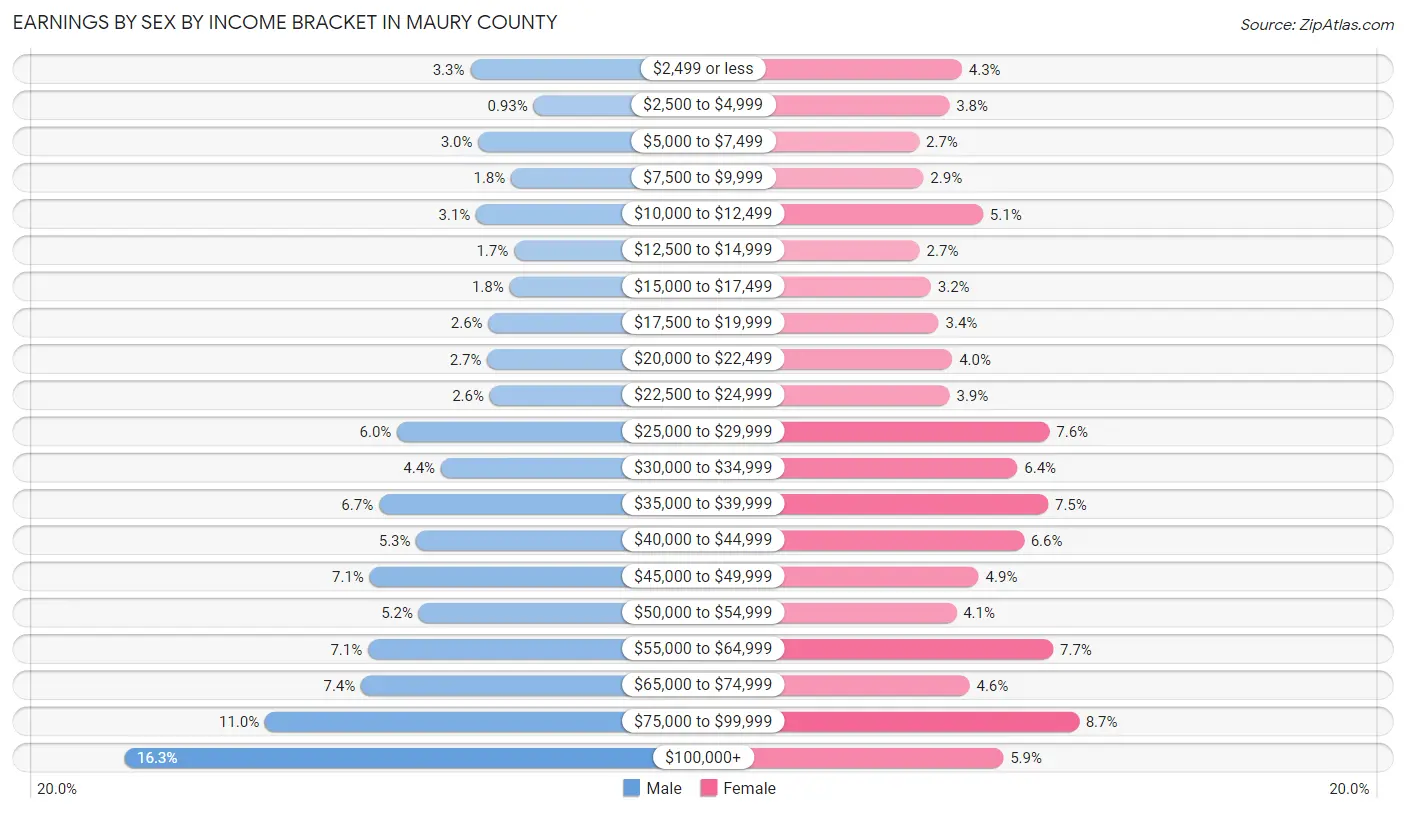
Earnings by Sex by Income Bracket in Maury County
The most common earnings brackets in Maury County are $100,000+ for men (4,682 | 16.3%) and $75,000 to $99,999 for women (2,180 | 8.7%).
| Income | Male | Female |
| $2,499 or less | 949 (3.3%) | 1,080 (4.3%) |
| $2,500 to $4,999 | 269 (0.9%) | 963 (3.8%) |
| $5,000 to $7,499 | 864 (3.0%) | 681 (2.7%) |
| $7,500 to $9,999 | 508 (1.8%) | 719 (2.9%) |
| $10,000 to $12,499 | 887 (3.1%) | 1,280 (5.1%) |
| $12,500 to $14,999 | 478 (1.7%) | 684 (2.7%) |
| $15,000 to $17,499 | 527 (1.8%) | 790 (3.2%) |
| $17,500 to $19,999 | 754 (2.6%) | 862 (3.4%) |
| $20,000 to $22,499 | 767 (2.7%) | 990 (4.0%) |
| $22,500 to $24,999 | 740 (2.6%) | 966 (3.8%) |
| $25,000 to $29,999 | 1,739 (6.0%) | 1,904 (7.6%) |
| $30,000 to $34,999 | 1,265 (4.4%) | 1,602 (6.4%) |
| $35,000 to $39,999 | 1,934 (6.7%) | 1,891 (7.5%) |
| $40,000 to $44,999 | 1,532 (5.3%) | 1,664 (6.6%) |
| $45,000 to $49,999 | 2,035 (7.1%) | 1,240 (4.9%) |
| $50,000 to $54,999 | 1,506 (5.2%) | 1,028 (4.1%) |
| $55,000 to $64,999 | 2,053 (7.1%) | 1,938 (7.7%) |
| $65,000 to $74,999 | 2,128 (7.4%) | 1,153 (4.6%) |
| $75,000 to $99,999 | 3,164 (11.0%) | 2,180 (8.7%) |
| $100,000+ | 4,682 (16.3%) | 1,469 (5.9%) |
| Total | 28,781 (100.0%) | 25,084 (100.0%) |
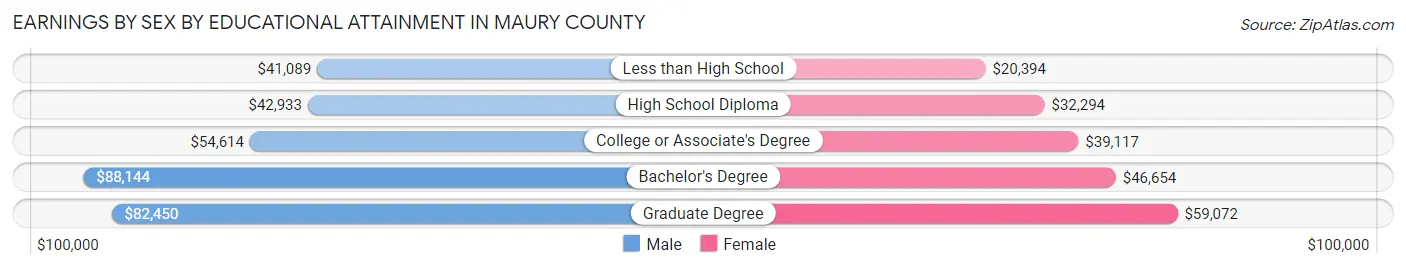
Earnings by Sex by Educational Attainment in Maury County
Average earnings in Maury County are $51,765 for men and $39,171 for women, a difference of 24.3%. Men with an educational attainment of bachelor's degree enjoy the highest average annual earnings of $88,144, while those with less than high school education earn the least with $41,089. Women with an educational attainment of graduate degree earn the most with the average annual earnings of $59,072, while those with less than high school education have the smallest earnings of $20,394.
| Educational Attainment | Male Income | Female Income |
| Less than High School | $41,089 | $20,394 |
| High School Diploma | $42,933 | $32,294 |
| College or Associate's Degree | $54,614 | $39,117 |
| Bachelor's Degree | $88,144 | $46,654 |
| Graduate Degree | $82,450 | $59,072 |
| Total | $51,765 | $39,171 |
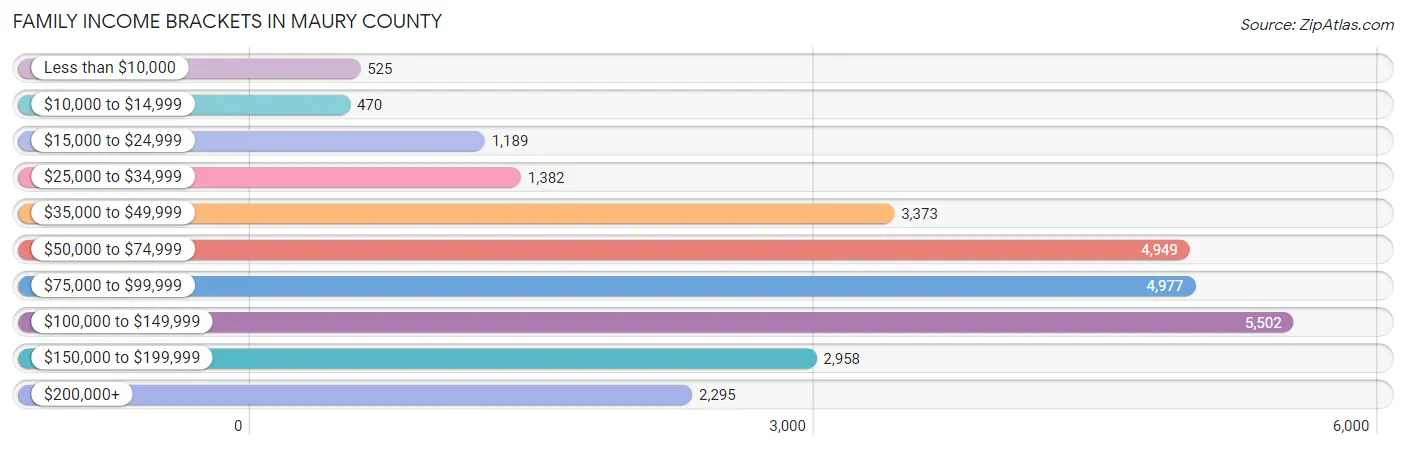
Family Income in Maury County
Family Income Brackets in Maury County
According to the Maury County family income data, there are 5,502 families falling into the $100,000 to $149,999 income range, which is the most common income bracket and makes up 19.9% of all families. Conversely, the $10,000 to $14,999 income bracket is the least frequent group with only 470 families (1.7%) belonging to this category.
| Income Bracket | # Families | % Families |
| Less than $10,000 | 525 | 1.9% |
| $10,000 to $14,999 | 470 | 1.7% |
| $15,000 to $24,999 | 1,189 | 4.3% |
| $25,000 to $34,999 | 1,382 | 5.0% |
| $35,000 to $49,999 | 3,373 | 12.2% |
| $50,000 to $74,999 | 4,949 | 17.9% |
| $75,000 to $99,999 | 4,977 | 18.0% |
| $100,000 to $149,999 | 5,502 | 19.9% |
| $150,000 to $199,999 | 2,958 | 10.7% |
| $200,000+ | 2,295 | 8.3% |
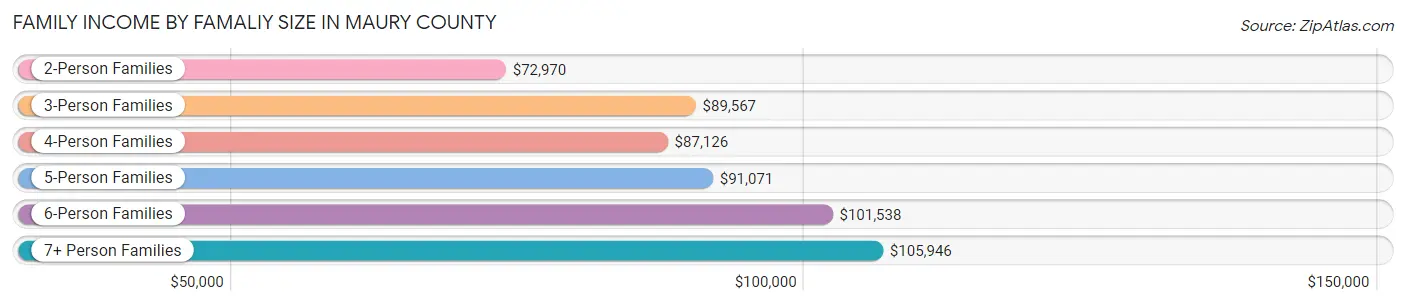
Family Income by Famaliy Size in Maury County
7+ person families (252 | 0.9%) account for the highest median family income in Maury County with $105,946 per family, while 2-person families (13,342 | 48.3%) have the highest median income of $36,485 per family member.
| Income Bracket | # Families | Median Income |
| 2-Person Families | 13,342 (48.3%) | $72,970 |
| 3-Person Families | 6,327 (22.9%) | $89,567 |
| 4-Person Families | 4,941 (17.9%) | $87,126 |
| 5-Person Families | 2,140 (7.7%) | $91,071 |
| 6-Person Families | 646 (2.3%) | $101,538 |
| 7+ Person Families | 252 (0.9%) | $105,946 |
| Total | 27,648 (100.0%) | $83,154 |
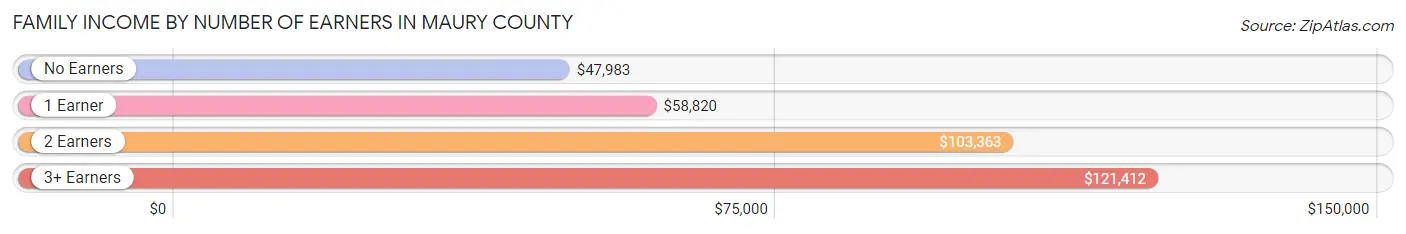
Family Income by Number of Earners in Maury County
The median family income in Maury County is $83,154, with families comprising 3+ earners (3,081) having the highest median family income of $121,412, while families with no earners (3,863) have the lowest median family income of $47,983, accounting for 11.1% and 14.0% of families, respectively.
| Number of Earners | # Families | Median Income |
| No Earners | 3,863 (14.0%) | $47,983 |
| 1 Earner | 9,616 (34.8%) | $58,820 |
| 2 Earners | 11,088 (40.1%) | $103,363 |
| 3+ Earners | 3,081 (11.1%) | $121,412 |
| Total | 27,648 (100.0%) | $83,154 |
Household Income in Maury County
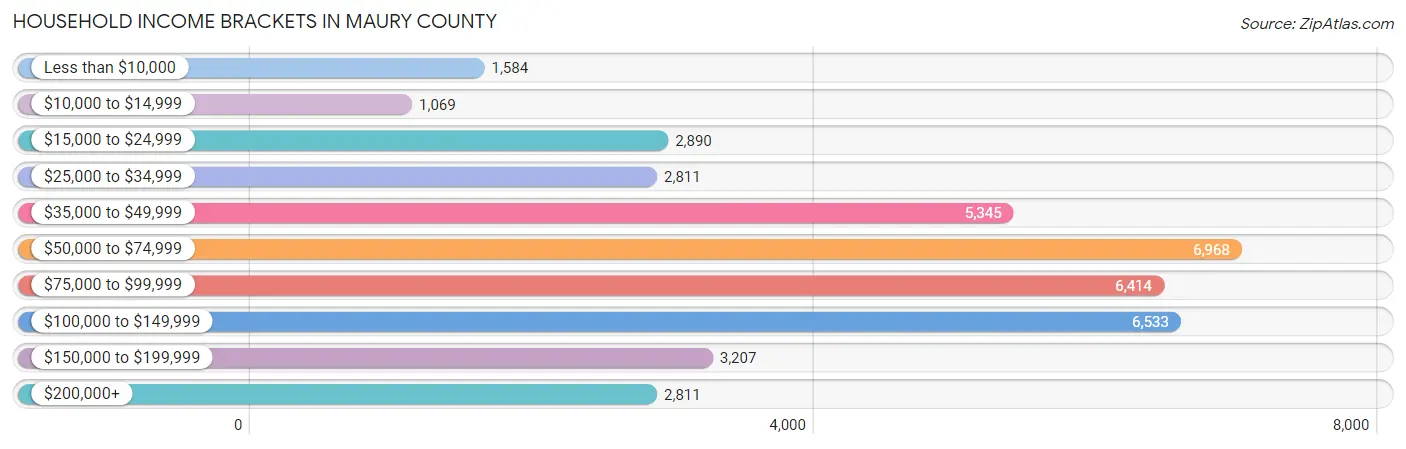
Household Income Brackets in Maury County
With 6,968 households falling in the category, the $50,000 to $74,999 income range is the most frequent in Maury County, accounting for 17.6% of all households. In contrast, only 1,069 households (2.7%) fall into the $10,000 to $14,999 income bracket, making it the least populous group.
| Income Bracket | # Households | % Households |
| Less than $10,000 | 1,584 | 4.0% |
| $10,000 to $14,999 | 1,069 | 2.7% |
| $15,000 to $24,999 | 2,890 | 7.3% |
| $25,000 to $34,999 | 2,811 | 7.1% |
| $35,000 to $49,999 | 5,345 | 13.5% |
| $50,000 to $74,999 | 6,968 | 17.6% |
| $75,000 to $99,999 | 6,414 | 16.2% |
| $100,000 to $149,999 | 6,533 | 16.5% |
| $150,000 to $199,999 | 3,207 | 8.1% |
| $200,000+ | 2,811 | 7.1% |
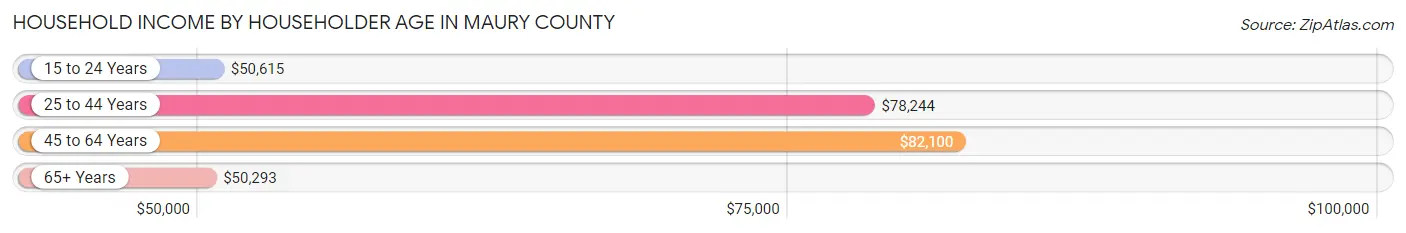
Household Income by Householder Age in Maury County
The median household income in Maury County is $71,500, with the highest median household income of $82,100 found in the 45 to 64 years age bracket for the primary householder. A total of 14,752 households (37.3%) fall into this category. Meanwhile, the 65+ years age bracket for the primary householder has the lowest median household income of $50,293, with 10,400 households (26.3%) in this group.
| Income Bracket | # Households | Median Income |
| 15 to 24 Years | 1,353 (3.4%) | $50,615 |
| 25 to 44 Years | 13,086 (33.1%) | $78,244 |
| 45 to 64 Years | 14,752 (37.3%) | $82,100 |
| 65+ Years | 10,400 (26.3%) | $50,293 |
| Total | 39,591 (100.0%) | $71,500 |
Poverty in Maury County
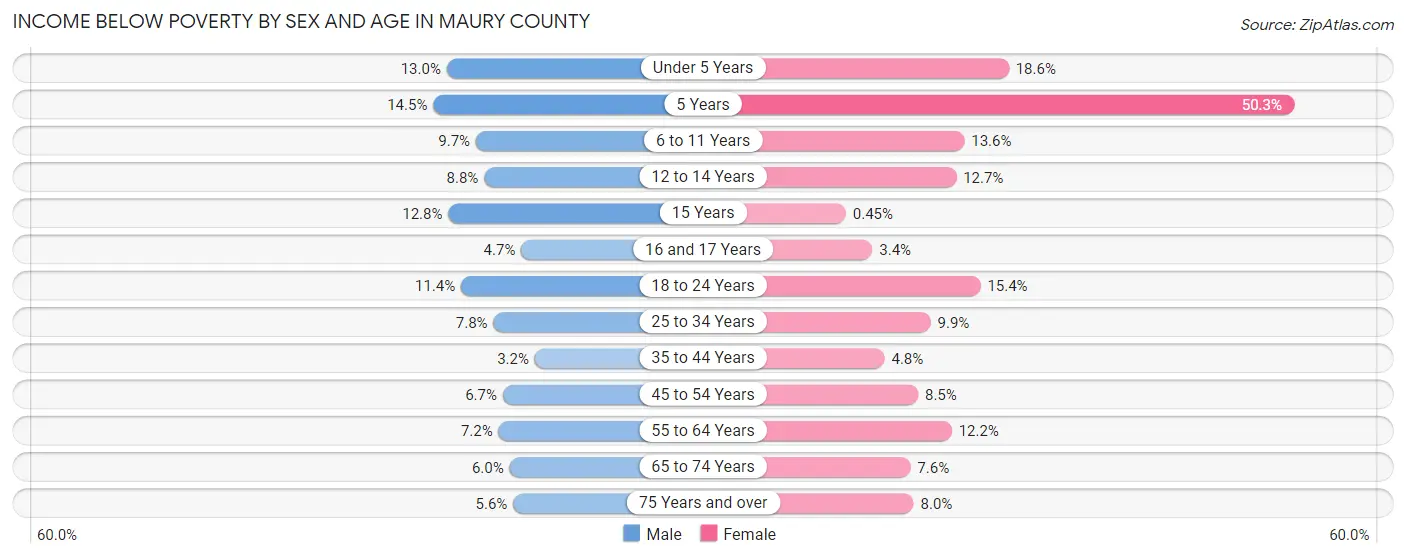
Income Below Poverty by Sex and Age in Maury County
With 7.5% poverty level for males and 10.2% for females among the residents of Maury County, 5 year old males and 5 year old females are the most vulnerable to poverty, with 92 males (14.5%) and 75 females (50.3%) in their respective age groups living below the poverty level.
| Age Bracket | Male | Female |
| Under 5 Years | 430 (13.0%) | 572 (18.6%) |
| 5 Years | 92 (14.5%) | 75 (50.3%) |
| 6 to 11 Years | 389 (9.7%) | 484 (13.6%) |
| 12 to 14 Years | 167 (8.8%) | 321 (12.7%) |
| 15 Years | 77 (12.8%) | 3 (0.4%) |
| 16 and 17 Years | 76 (4.7%) | 37 (3.4%) |
| 18 to 24 Years | 436 (11.4%) | 568 (15.4%) |
| 25 to 34 Years | 534 (7.8%) | 716 (9.9%) |
| 35 to 44 Years | 219 (3.2%) | 323 (4.8%) |
| 45 to 54 Years | 396 (6.7%) | 532 (8.5%) |
| 55 to 64 Years | 467 (7.2%) | 888 (12.2%) |
| 65 to 74 Years | 291 (6.0%) | 425 (7.6%) |
| 75 Years and over | 143 (5.6%) | 277 (8.0%) |
| Total | 3,717 (7.5%) | 5,221 (10.2%) |
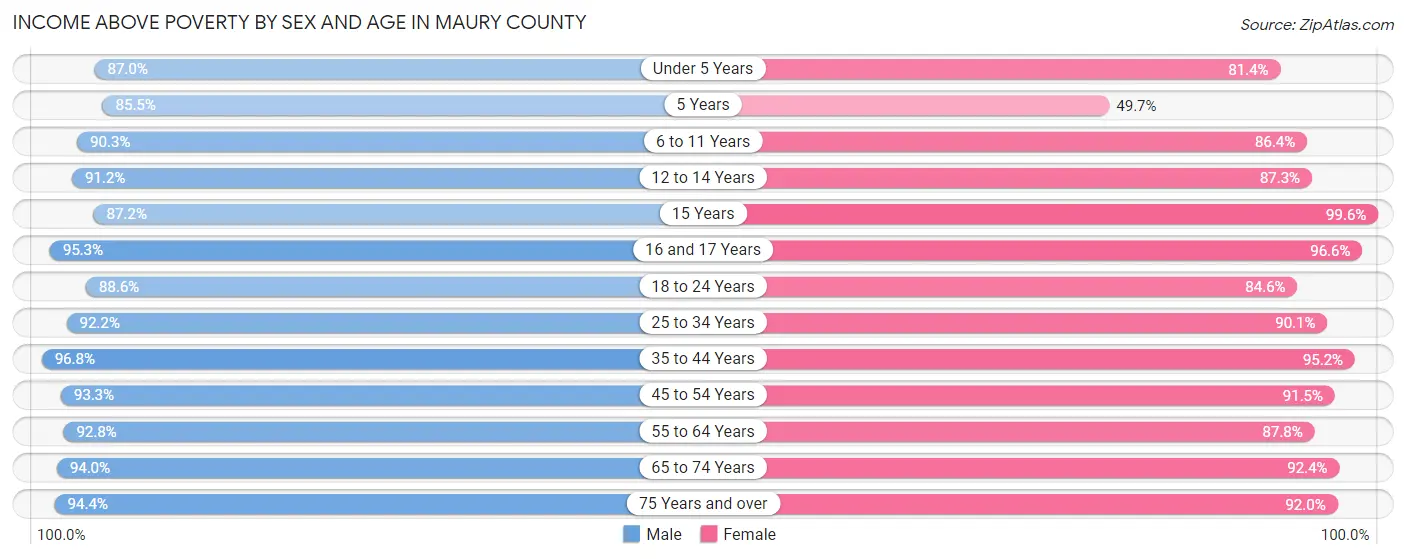
Income Above Poverty by Sex and Age in Maury County
According to the poverty statistics in Maury County, males aged 35 to 44 years and females aged 15 years are the age groups that are most secure financially, with 96.8% of males and 99.6% of females in these age groups living above the poverty line.
| Age Bracket | Male | Female |
| Under 5 Years | 2,879 (87.0%) | 2,505 (81.4%) |
| 5 Years | 543 (85.5%) | 74 (49.7%) |
| 6 to 11 Years | 3,603 (90.3%) | 3,064 (86.4%) |
| 12 to 14 Years | 1,727 (91.2%) | 2,199 (87.3%) |
| 15 Years | 524 (87.2%) | 664 (99.6%) |
| 16 and 17 Years | 1,546 (95.3%) | 1,051 (96.6%) |
| 18 to 24 Years | 3,391 (88.6%) | 3,111 (84.6%) |
| 25 to 34 Years | 6,323 (92.2%) | 6,524 (90.1%) |
| 35 to 44 Years | 6,664 (96.8%) | 6,464 (95.2%) |
| 45 to 54 Years | 5,480 (93.3%) | 5,737 (91.5%) |
| 55 to 64 Years | 6,003 (92.8%) | 6,369 (87.8%) |
| 65 to 74 Years | 4,571 (94.0%) | 5,136 (92.4%) |
| 75 Years and over | 2,417 (94.4%) | 3,184 (92.0%) |
| Total | 45,671 (92.5%) | 46,082 (89.8%) |
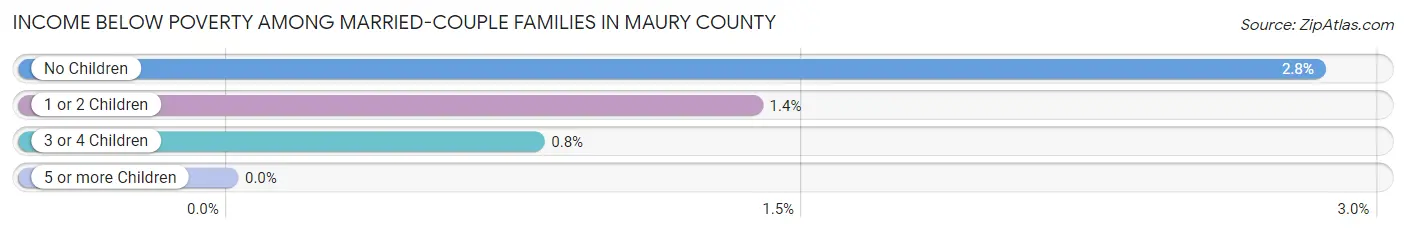
Income Below Poverty Among Married-Couple Families in Maury County
The poverty statistics for married-couple families in Maury County show that 2.2% or 456 of the total 20,595 families live below the poverty line. Families with no children have the highest poverty rate of 2.8%, comprising of 357 families. On the other hand, families with 5 or more children have the lowest poverty rate of 0.0%, which includes 0 families.
| Children | Above Poverty | Below Poverty |
| No Children | 12,194 (97.2%) | 357 (2.8%) |
| 1 or 2 Children | 6,104 (98.6%) | 85 (1.4%) |
| 3 or 4 Children | 1,736 (99.2%) | 14 (0.8%) |
| 5 or more Children | 105 (100.0%) | 0 (0.0%) |
| Total | 20,139 (97.8%) | 456 (2.2%) |
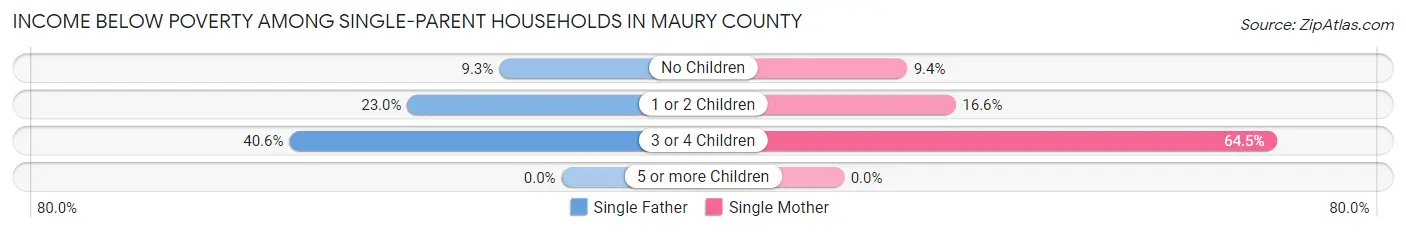
Income Below Poverty Among Single-Parent Households in Maury County
According to the poverty data in Maury County, 17.1% or 357 single-father households and 19.8% or 983 single-mother households are living below the poverty line. Among single-father households, those with 3 or 4 children have the highest poverty rate, with 58 households (40.6%) experiencing poverty. Likewise, among single-mother households, those with 3 or 4 children have the highest poverty rate, with 381 households (64.5%) falling below the poverty line.
| Children | Single Father | Single Mother |
| No Children | 101 (9.3%) | 162 (9.4%) |
| 1 or 2 Children | 198 (23.0%) | 440 (16.6%) |
| 3 or 4 Children | 58 (40.6%) | 381 (64.5%) |
| 5 or more Children | 0 (0.0%) | 0 (0.0%) |
| Total | 357 (17.1%) | 983 (19.8%) |
Income Below Poverty Among Married-Couple vs Single-Parent Households in Maury County
The poverty data for Maury County shows that 456 of the married-couple family households (2.2%) and 1,340 of the single-parent households (19.0%) are living below the poverty level. Within the married-couple family households, those with no children have the highest poverty rate, with 357 households (2.8%) falling below the poverty line. Among the single-parent households, those with 3 or 4 children have the highest poverty rate, with 439 household (59.8%) living below poverty.
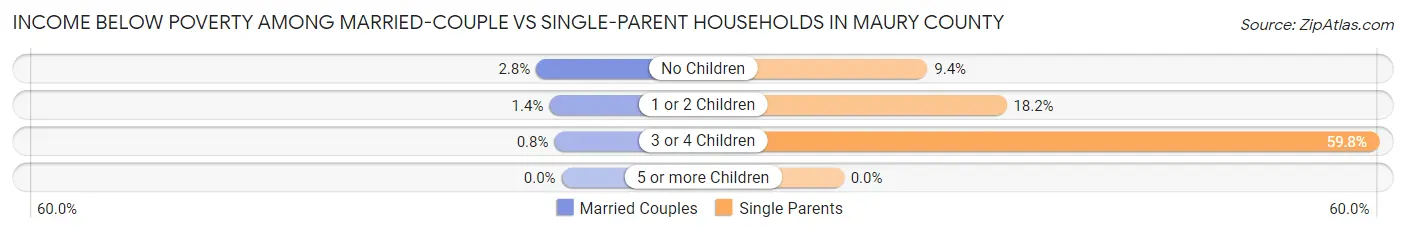
| Children | Married-Couple Families | Single-Parent Households |
| No Children | 357 (2.8%) | 263 (9.3%) |
| 1 or 2 Children | 85 (1.4%) | 638 (18.2%) |
| 3 or 4 Children | 14 (0.8%) | 439 (59.8%) |
| 5 or more Children | 0 (0.0%) | 0 (0.0%) |
| Total | 456 (2.2%) | 1,340 (19.0%) |
Race in Maury County
The most populous races in Maury County are White / Caucasian (82,838 | 81.2%), Black / African American (11,082 | 10.9%), and Hispanic or Latino (6,747 | 6.6%).
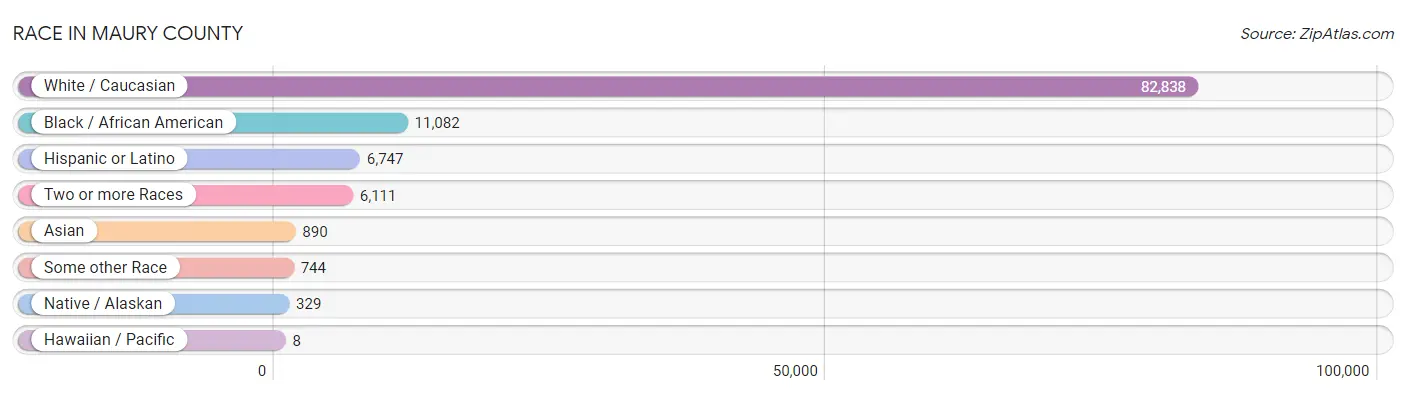
| Race | # Population | % Population |
| Asian | 890 | 0.9% |
| Black / African American | 11,082 | 10.9% |
| Hawaiian / Pacific | 8 | 0.0% |
| Hispanic or Latino | 6,747 | 6.6% |
| Native / Alaskan | 329 | 0.3% |
| White / Caucasian | 82,838 | 81.2% |
| Two or more Races | 6,111 | 6.0% |
| Some other Race | 744 | 0.7% |
| Total | 102,002 | 100.0% |
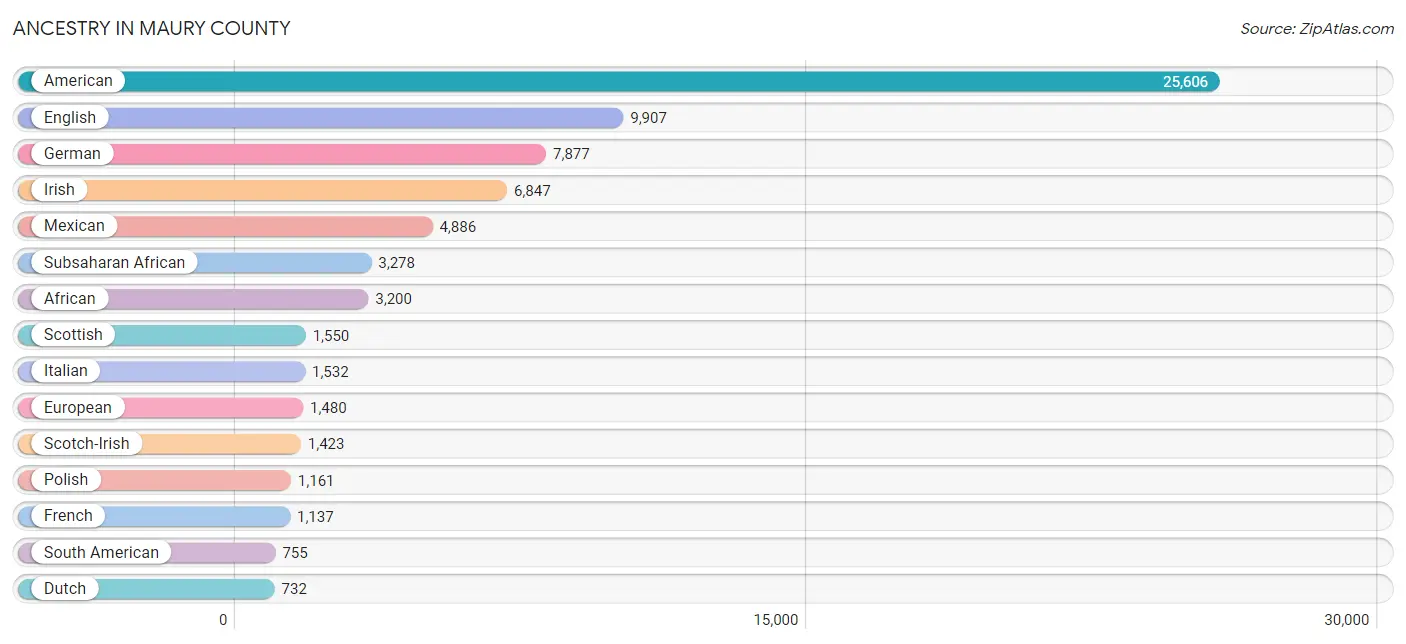
Ancestry in Maury County
The most populous ancestries reported in Maury County are American (25,606 | 25.1%), English (9,907 | 9.7%), German (7,877 | 7.7%), Irish (6,847 | 6.7%), and Mexican (4,886 | 4.8%), together accounting for 54.0% of all Maury County residents.
| Ancestry | # Population | % Population |
| African | 3,200 | 3.1% |
| Aleut | 38 | 0.0% |
| American | 25,606 | 25.1% |
| Arab | 142 | 0.1% |
| Austrian | 74 | 0.1% |
| Belgian | 50 | 0.1% |
| Bhutanese | 127 | 0.1% |
| Blackfeet | 126 | 0.1% |
| Bolivian | 22 | 0.0% |
| Brazilian | 11 | 0.0% |
| British | 564 | 0.5% |
| British West Indian | 8 | 0.0% |
| Bulgarian | 15 | 0.0% |
| Burmese | 98 | 0.1% |
| Canadian | 136 | 0.1% |
| Central American | 50 | 0.1% |
| Central American Indian | 15 | 0.0% |
| Cherokee | 689 | 0.7% |
| Chickasaw | 13 | 0.0% |
| Choctaw | 30 | 0.0% |
| Colombian | 524 | 0.5% |
| Comanche | 49 | 0.1% |
| Croatian | 19 | 0.0% |
| Cuban | 256 | 0.3% |
| Czech | 204 | 0.2% |
| Czechoslovakian | 53 | 0.1% |
| Danish | 150 | 0.2% |
| Delaware | 11 | 0.0% |
| Dominican | 63 | 0.1% |
| Dutch | 732 | 0.7% |
| Eastern European | 99 | 0.1% |
| Egyptian | 35 | 0.0% |
| English | 9,907 | 9.7% |
| European | 1,480 | 1.5% |
| Filipino | 16 | 0.0% |
| Finnish | 28 | 0.0% |
| French | 1,137 | 1.1% |
| French American Indian | 46 | 0.1% |
| French Canadian | 400 | 0.4% |
| German | 7,877 | 7.7% |
| Greek | 54 | 0.1% |
| Hungarian | 323 | 0.3% |
| Indian (Asian) | 132 | 0.1% |
| Irish | 6,847 | 6.7% |
| Italian | 1,532 | 1.5% |
| Jamaican | 43 | 0.0% |
| Korean | 465 | 0.5% |
| Latvian | 7 | 0.0% |
| Lebanese | 61 | 0.1% |
| Lithuanian | 58 | 0.1% |
| Mexican | 4,886 | 4.8% |
| Mexican American Indian | 42 | 0.0% |
| Moroccan | 20 | 0.0% |
| Nicaraguan | 13 | 0.0% |
| Nigerian | 43 | 0.0% |
| Northern European | 32 | 0.0% |
| Norwegian | 509 | 0.5% |
| Osage | 37 | 0.0% |
| Pennsylvania German | 15 | 0.0% |
| Polish | 1,161 | 1.1% |
| Portuguese | 151 | 0.2% |
| Puerto Rican | 617 | 0.6% |
| Romanian | 23 | 0.0% |
| Russian | 170 | 0.2% |
| Salvadoran | 37 | 0.0% |
| Scandinavian | 284 | 0.3% |
| Scotch-Irish | 1,423 | 1.4% |
| Scottish | 1,550 | 1.5% |
| Slavic | 56 | 0.1% |
| Slovak | 21 | 0.0% |
| Slovene | 54 | 0.1% |
| South American | 755 | 0.7% |
| South American Indian | 37 | 0.0% |
| Spaniard | 44 | 0.0% |
| Spanish | 47 | 0.1% |
| Sri Lankan | 141 | 0.1% |
| Subsaharan African | 3,278 | 3.2% |
| Swedish | 345 | 0.3% |
| Swiss | 10 | 0.0% |
| Thai | 203 | 0.2% |
| Ukrainian | 55 | 0.1% |
| Uruguayan | 37 | 0.0% |
| Venezuelan | 172 | 0.2% |
| Welsh | 201 | 0.2% | View All 84 Rows |
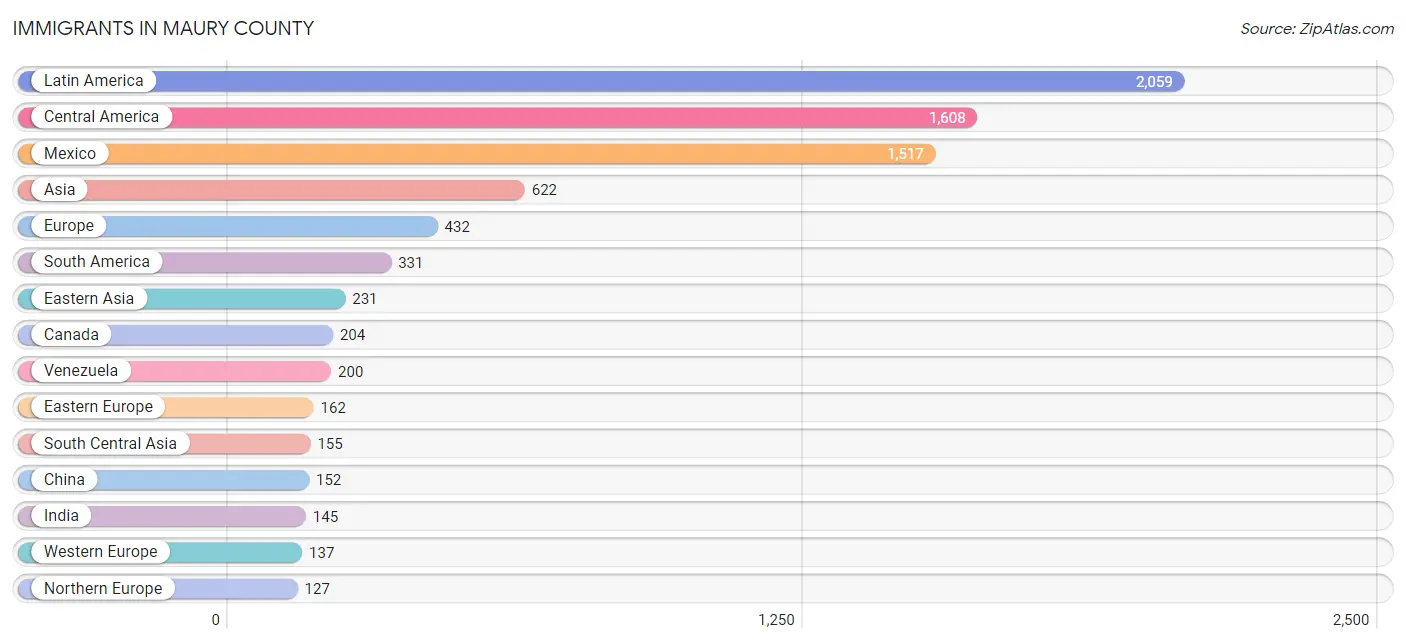
Immigrants in Maury County
The most numerous immigrant groups reported in Maury County came from Latin America (2,059 | 2.0%), Central America (1,608 | 1.6%), Mexico (1,517 | 1.5%), Asia (622 | 0.6%), and Europe (432 | 0.4%), together accounting for 6.1% of all Maury County residents.
| Immigration Origin | # Population | % Population |
| Africa | 25 | 0.0% |
| Asia | 622 | 0.6% |
| Australia | 18 | 0.0% |
| Belgium | 1 | 0.0% |
| Brazil | 11 | 0.0% |
| Canada | 204 | 0.2% |
| Caribbean | 120 | 0.1% |
| Central America | 1,608 | 1.6% |
| China | 152 | 0.2% |
| Colombia | 115 | 0.1% |
| Cuba | 26 | 0.0% |
| Dominican Republic | 34 | 0.0% |
| Eastern Asia | 231 | 0.2% |
| Eastern Europe | 162 | 0.2% |
| Egypt | 25 | 0.0% |
| El Salvador | 6 | 0.0% |
| England | 14 | 0.0% |
| Europe | 432 | 0.4% |
| Germany | 103 | 0.1% |
| Hungary | 36 | 0.0% |
| India | 145 | 0.1% |
| Iraq | 10 | 0.0% |
| Israel | 45 | 0.0% |
| Italy | 6 | 0.0% |
| Jamaica | 52 | 0.1% |
| Japan | 25 | 0.0% |
| Korea | 54 | 0.1% |
| Latin America | 2,059 | 2.0% |
| Mexico | 1,517 | 1.5% |
| Netherlands | 33 | 0.0% |
| Nicaragua | 13 | 0.0% |
| Northern Africa | 25 | 0.0% |
| Northern Europe | 127 | 0.1% |
| Oceania | 26 | 0.0% |
| Pakistan | 10 | 0.0% |
| Panama | 72 | 0.1% |
| Philippines | 73 | 0.1% |
| Poland | 19 | 0.0% |
| Romania | 16 | 0.0% |
| Russia | 18 | 0.0% |
| Scotland | 36 | 0.0% |
| Serbia | 17 | 0.0% |
| South America | 331 | 0.3% |
| South Central Asia | 155 | 0.2% |
| South Eastern Asia | 127 | 0.1% |
| Southern Europe | 6 | 0.0% |
| St. Vincent and the Grenadines | 8 | 0.0% |
| Taiwan | 16 | 0.0% |
| Thailand | 1 | 0.0% |
| Ukraine | 29 | 0.0% |
| Uruguay | 5 | 0.0% |
| Venezuela | 200 | 0.2% |
| Vietnam | 53 | 0.1% |
| Western Asia | 55 | 0.1% |
| Western Europe | 137 | 0.1% | View All 55 Rows |
Sex and Age in Maury County
Sex and Age in Maury County
The most populous age groups in Maury County are 40 to 44 Years (3,987 | 8.0%) for men and 60 to 64 Years (3,779 | 7.3%) for women.
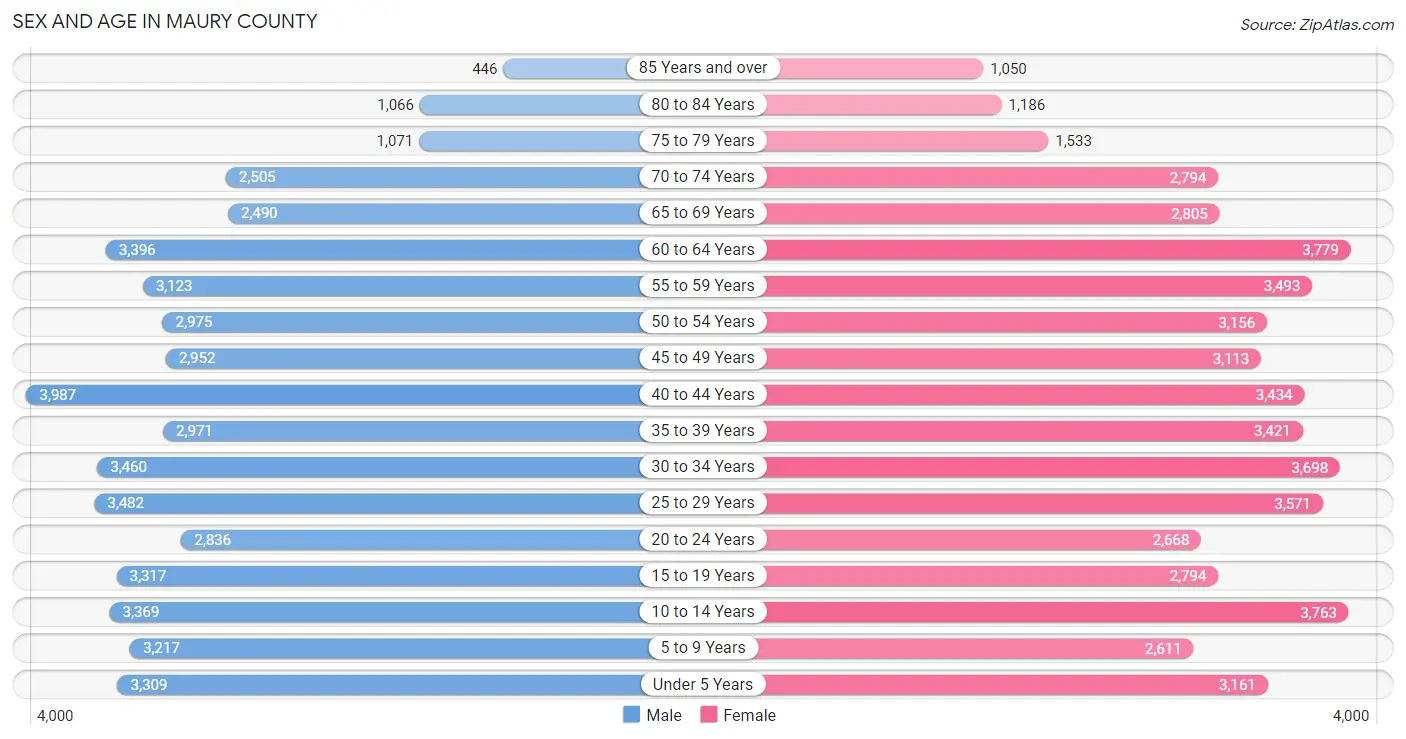
| Age Bracket | Male | Female |
| Under 5 Years | 3,309 (6.6%) | 3,161 (6.1%) |
| 5 to 9 Years | 3,217 (6.4%) | 2,611 (5.0%) |
| 10 to 14 Years | 3,369 (6.7%) | 3,763 (7.2%) |
| 15 to 19 Years | 3,317 (6.6%) | 2,794 (5.4%) |
| 20 to 24 Years | 2,836 (5.7%) | 2,668 (5.1%) |
| 25 to 29 Years | 3,482 (7.0%) | 3,571 (6.9%) |
| 30 to 34 Years | 3,460 (6.9%) | 3,698 (7.1%) |
| 35 to 39 Years | 2,971 (5.9%) | 3,421 (6.6%) |
| 40 to 44 Years | 3,987 (8.0%) | 3,434 (6.6%) |
| 45 to 49 Years | 2,952 (5.9%) | 3,113 (6.0%) |
| 50 to 54 Years | 2,975 (5.9%) | 3,156 (6.1%) |
| 55 to 59 Years | 3,123 (6.2%) | 3,493 (6.7%) |
| 60 to 64 Years | 3,396 (6.8%) | 3,779 (7.3%) |
| 65 to 69 Years | 2,490 (5.0%) | 2,805 (5.4%) |
| 70 to 74 Years | 2,505 (5.0%) | 2,794 (5.4%) |
| 75 to 79 Years | 1,071 (2.1%) | 1,533 (2.9%) |
| 80 to 84 Years | 1,066 (2.1%) | 1,186 (2.3%) |
| 85 Years and over | 446 (0.9%) | 1,050 (2.0%) |
| Total | 49,972 (100.0%) | 52,030 (100.0%) |
Families and Households in Maury County
Median Family Size in Maury County
The median family size in Maury County is 3.04 persons per family, with married-couple families (20,595 | 74.5%) accounting for the largest median family size of 3.08 persons per family. On the other hand, single male/father families (2,092 | 7.6%) represent the smallest median family size with 2.71 persons per family.
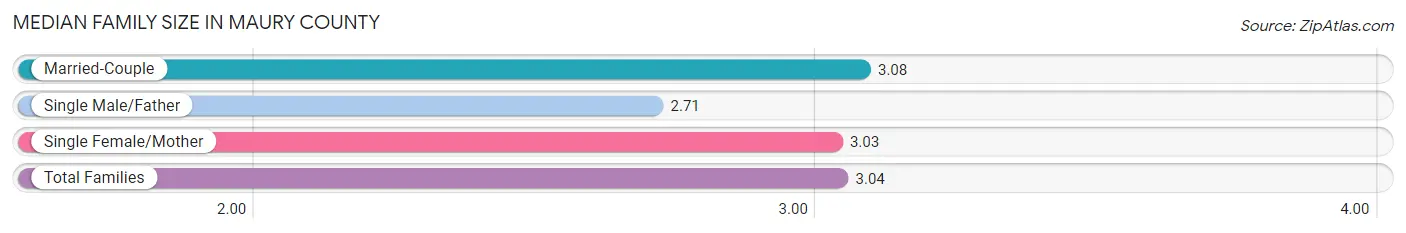
| Family Type | # Families | Family Size |
| Married-Couple | 20,595 (74.5%) | 3.08 |
| Single Male/Father | 2,092 (7.6%) | 2.71 |
| Single Female/Mother | 4,961 (17.9%) | 3.03 |
| Total Families | 27,648 (100.0%) | 3.04 |
Median Household Size in Maury County
The median household size in Maury County is 2.55 persons per household, with single male/father households (2,092 | 5.3%) accounting for the largest median household size of 3.17 persons per household. non-family households (11,943 | 30.2%) represent the smallest median household size with 1.23 persons per household.
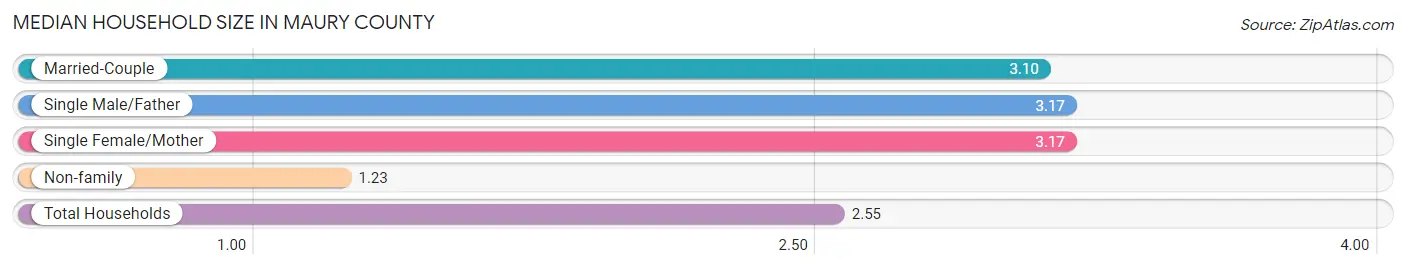
| Household Type | # Households | Household Size |
| Married-Couple | 20,595 (52.0%) | 3.10 |
| Single Male/Father | 2,092 (5.3%) | 3.17 |
| Single Female/Mother | 4,961 (12.5%) | 3.17 |
| Non-family | 11,943 (30.2%) | 1.23 |
| Total Households | 39,591 (100.0%) | 2.55 |
Household Size by Marriage Status in Maury County
Out of a total of 39,591 households in Maury County, 27,648 (69.8%) are family households, while 11,943 (30.2%) are nonfamily households. The most numerous type of family households are 2-person households, comprising 12,335, and the most common type of nonfamily households are 1-person households, comprising 9,884.
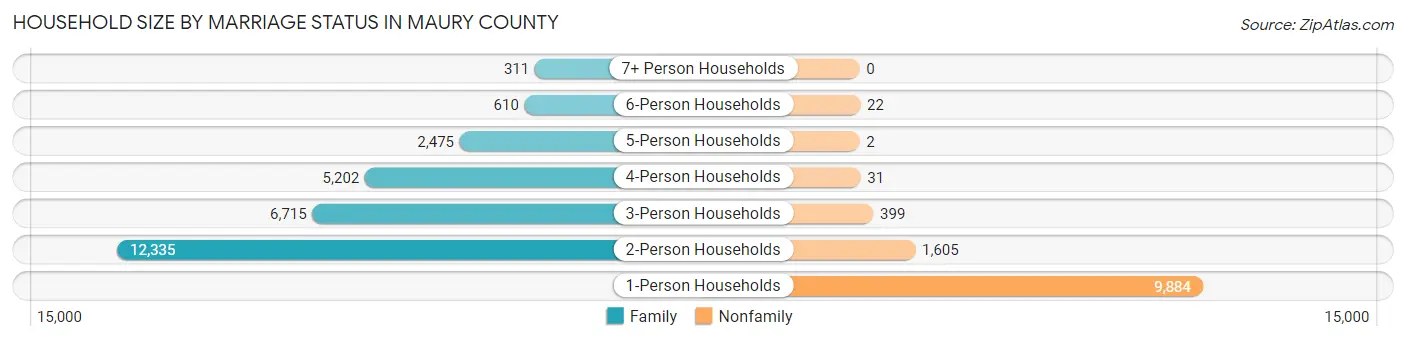
| Household Size | Family Households | Nonfamily Households |
| 1-Person Households | - | 9,884 (25.0%) |
| 2-Person Households | 12,335 (31.2%) | 1,605 (4.1%) |
| 3-Person Households | 6,715 (17.0%) | 399 (1.0%) |
| 4-Person Households | 5,202 (13.1%) | 31 (0.1%) |
| 5-Person Households | 2,475 (6.2%) | 2 (0.0%) |
| 6-Person Households | 610 (1.5%) | 22 (0.1%) |
| 7+ Person Households | 311 (0.8%) | 0 (0.0%) |
| Total | 27,648 (69.8%) | 11,943 (30.2%) |
Female Fertility in Maury County
Fertility by Age in Maury County
Average fertility rate in Maury County is 50.0 births per 1,000 women. Women in the age bracket of 20 to 34 years have the highest fertility rate with 105.0 births per 1,000 women. Women in the age bracket of 20 to 34 years acount for 89.6% of all women with births.
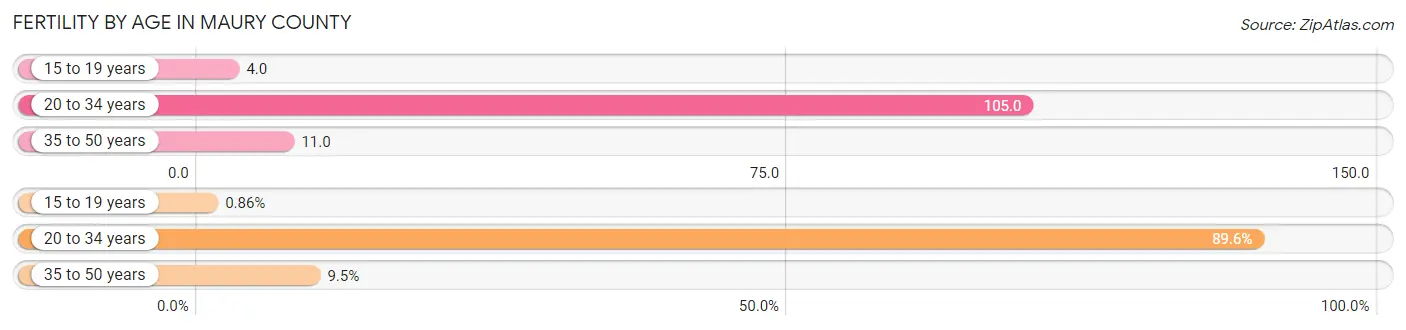
| Age Bracket | Women with Births | Births / 1,000 Women |
| 15 to 19 years | 10 (0.9%) | 4.0 |
| 20 to 34 years | 1,043 (89.6%) | 105.0 |
| 35 to 50 years | 111 (9.5%) | 11.0 |
| Total | 1,164 (100.0%) | 50.0 |
Fertility by Age by Marriage Status in Maury County
85.4% of women with births (1,164) in Maury County are married. The highest percentage of unmarried women with births falls into 15 to 19 years age bracket with 100.0% of them unmarried at the time of birth, while the lowest percentage of unmarried women with births belong to 20 to 34 years age bracket with 11.8% of them unmarried.
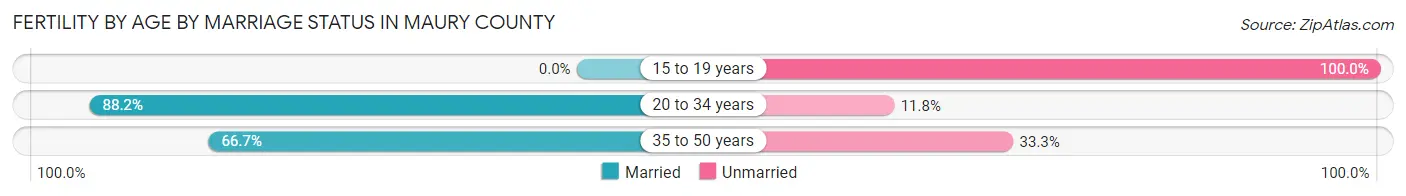
| Age Bracket | Married | Unmarried |
| 15 to 19 years | 0 (0.0%) | 10 (100.0%) |
| 20 to 34 years | 920 (88.2%) | 123 (11.8%) |
| 35 to 50 years | 74 (66.7%) | 37 (33.3%) |
| Total | 994 (85.4%) | 170 (14.6%) |
Fertility by Education in Maury County
Average fertility rate in Maury County is 50.0 births per 1,000 women. Women with the education attainment of bachelor's degree have the highest fertility rate of 89.0 births per 1,000 women, while women with the education attainment of less than high school have the lowest fertility at 19.0 births per 1,000 women. Women with the education attainment of bachelor's degree represent 33.2% of all women with births.
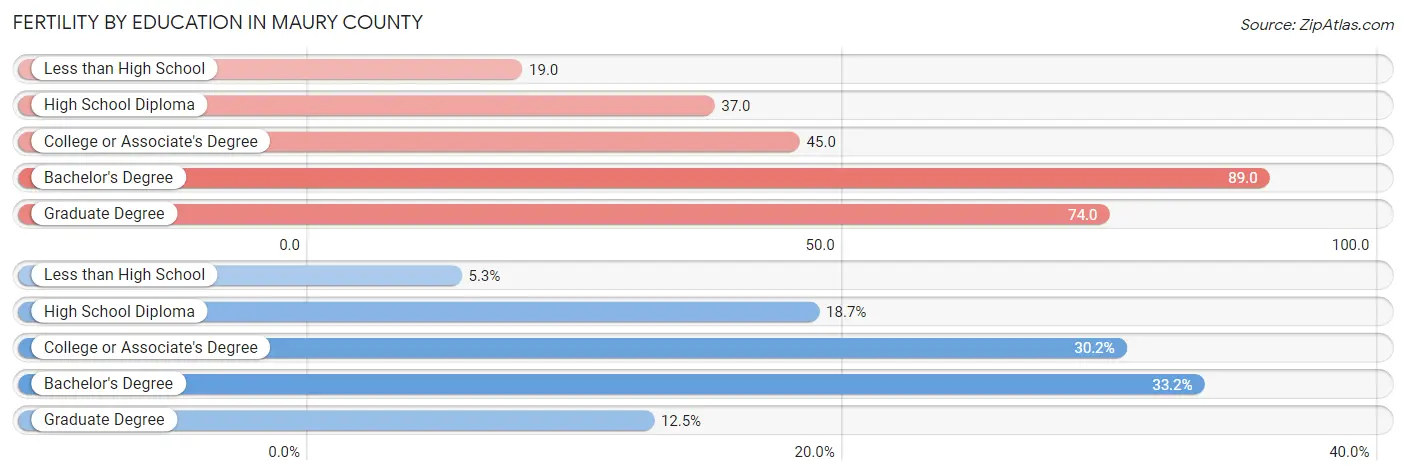
| Educational Attainment | Women with Births | Births / 1,000 Women |
| Less than High School | 62 (5.3%) | 19.0 |
| High School Diploma | 218 (18.7%) | 37.0 |
| College or Associate's Degree | 352 (30.2%) | 45.0 |
| Bachelor's Degree | 386 (33.2%) | 89.0 |
| Graduate Degree | 146 (12.5%) | 74.0 |
| Total | 1,164 (100.0%) | 50.0 |
Fertility by Education by Marriage Status in Maury County
14.6% of women with births in Maury County are unmarried. Women with the educational attainment of graduate degree are most likely to be married with 100.0% of them married at childbirth, while women with the educational attainment of less than high school are least likely to be married with 96.8% of them unmarried at childbirth.
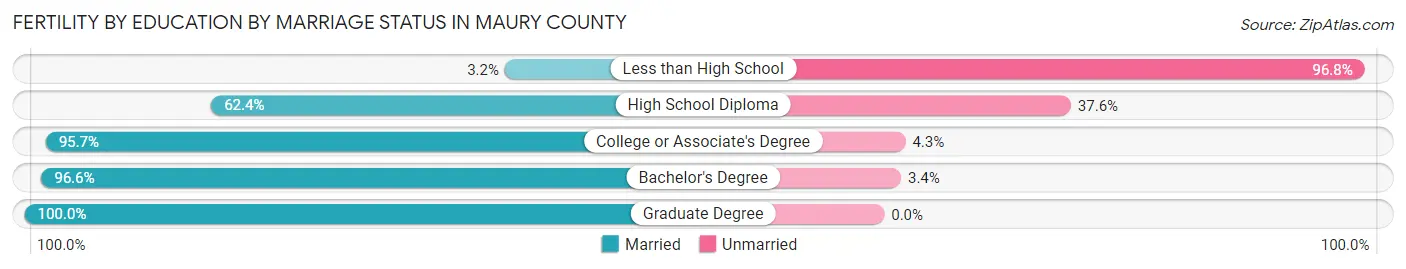
| Educational Attainment | Married | Unmarried |
| Less than High School | 2 (3.2%) | 60 (96.8%) |
| High School Diploma | 136 (62.4%) | 82 (37.6%) |
| College or Associate's Degree | 337 (95.7%) | 15 (4.3%) |
| Bachelor's Degree | 373 (96.6%) | 13 (3.4%) |
| Graduate Degree | 146 (100.0%) | 0 (0.0%) |
| Total | 994 (85.4%) | 170 (14.6%) |
Employment Characteristics in Maury County
Employment by Class of Employer in Maury County
Among the 49,963 employed individuals in Maury County, private company employees (35,928 | 71.9%), not-for-profit organizations (3,996 | 8.0%), and local government employees (3,881 | 7.8%) make up the most common classes of employment.
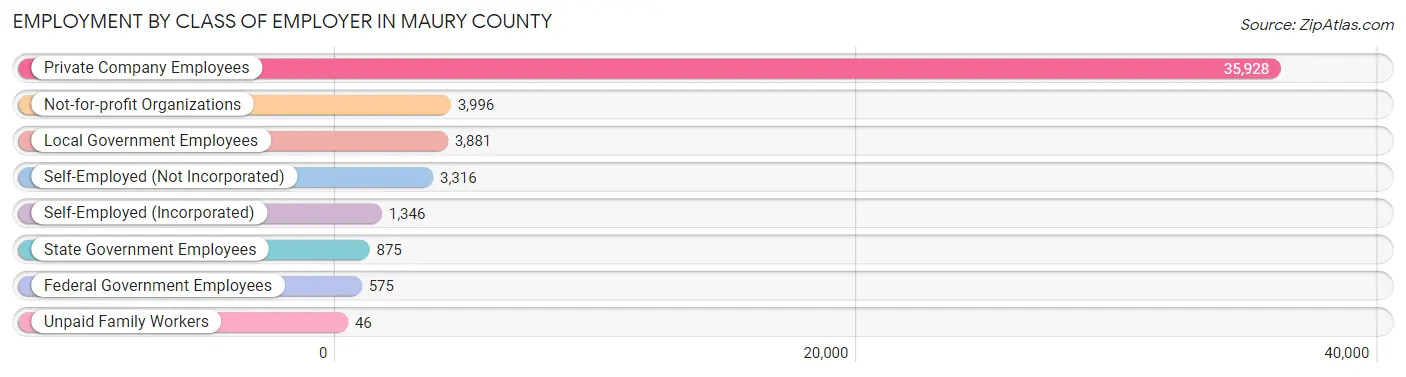
| Employer Class | # Employees | % Employees |
| Private Company Employees | 35,928 | 71.9% |
| Self-Employed (Incorporated) | 1,346 | 2.7% |
| Self-Employed (Not Incorporated) | 3,316 | 6.6% |
| Not-for-profit Organizations | 3,996 | 8.0% |
| Local Government Employees | 3,881 | 7.8% |
| State Government Employees | 875 | 1.8% |
| Federal Government Employees | 575 | 1.1% |
| Unpaid Family Workers | 46 | 0.1% |
| Total | 49,963 | 100.0% |
Employment Status by Age in Maury County
According to the labor force statistics for Maury County, out of the total population over 16 years of age (81,299), 64.0% or 52,031 individuals are in the labor force, with 2.5% or 1,301 of them unemployed. The age group with the highest labor force participation rate is 30 to 34 years, with 89.0% or 6,371 individuals in the labor force. Within the labor force, the 75 years and over age range has the highest percentage of unemployed individuals, with 7.4% or 40 of them being unemployed.
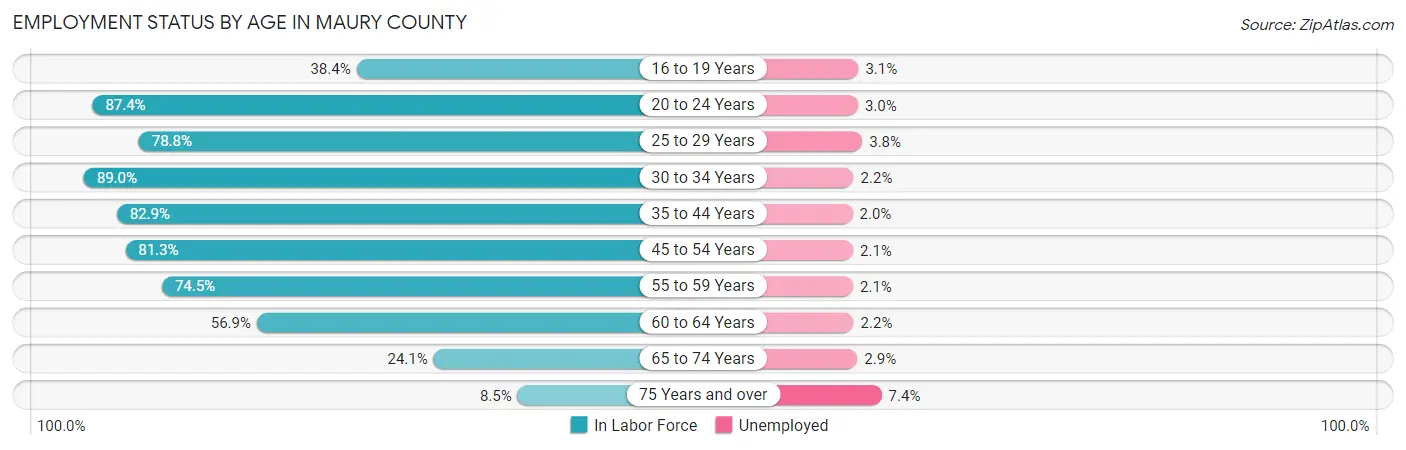
| Age Bracket | In Labor Force | Unemployed |
| 16 to 19 Years | 1,858 (38.4%) | 58 (3.1%) |
| 20 to 24 Years | 4,810 (87.4%) | 144 (3.0%) |
| 25 to 29 Years | 5,558 (78.8%) | 211 (3.8%) |
| 30 to 34 Years | 6,371 (89.0%) | 140 (2.2%) |
| 35 to 44 Years | 11,451 (82.9%) | 229 (2.0%) |
| 45 to 54 Years | 9,915 (81.3%) | 208 (2.1%) |
| 55 to 59 Years | 4,929 (74.5%) | 104 (2.1%) |
| 60 to 64 Years | 4,083 (56.9%) | 90 (2.2%) |
| 65 to 74 Years | 2,553 (24.1%) | 74 (2.9%) |
| 75 Years and over | 540 (8.5%) | 40 (7.4%) |
| Total | 52,031 (64.0%) | 1,301 (2.5%) |
Employment Status by Educational Attainment in Maury County
According to labor force statistics for Maury County, 78.3% of individuals (42,291) out of the total population between 25 and 64 years of age (54,011) are in the labor force, with 2.3% or 973 of them being unemployed. The group with the highest labor force participation rate are those with the educational attainment of bachelor's degree or higher, with 85.1% or 12,571 individuals in the labor force. Within the labor force, individuals with less than high school education have the highest percentage of unemployment, with 6.2% or 152 of them being unemployed.
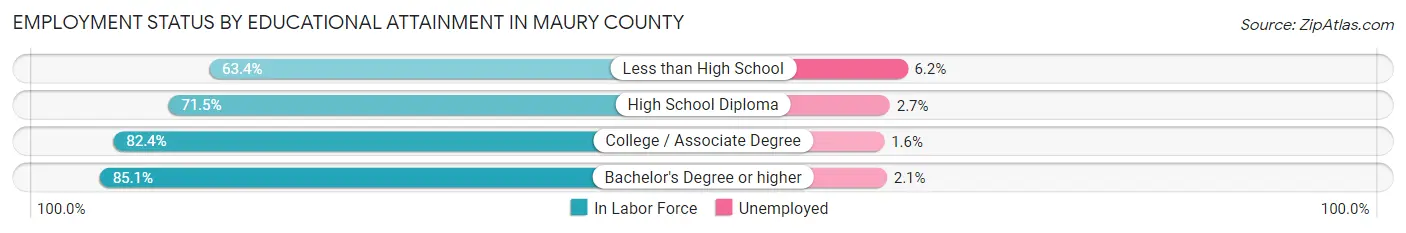
| Educational Attainment | In Labor Force | Unemployed |
| Less than High School | 2,450 (63.4%) | 240 (6.2%) |
| High School Diploma | 12,347 (71.5%) | 466 (2.7%) |
| College / Associate Degree | 14,919 (82.4%) | 290 (1.6%) |
| Bachelor's Degree or higher | 12,571 (85.1%) | 310 (2.1%) |
| Total | 42,291 (78.3%) | 1,242 (2.3%) |
Employment Occupations by Sex in Maury County
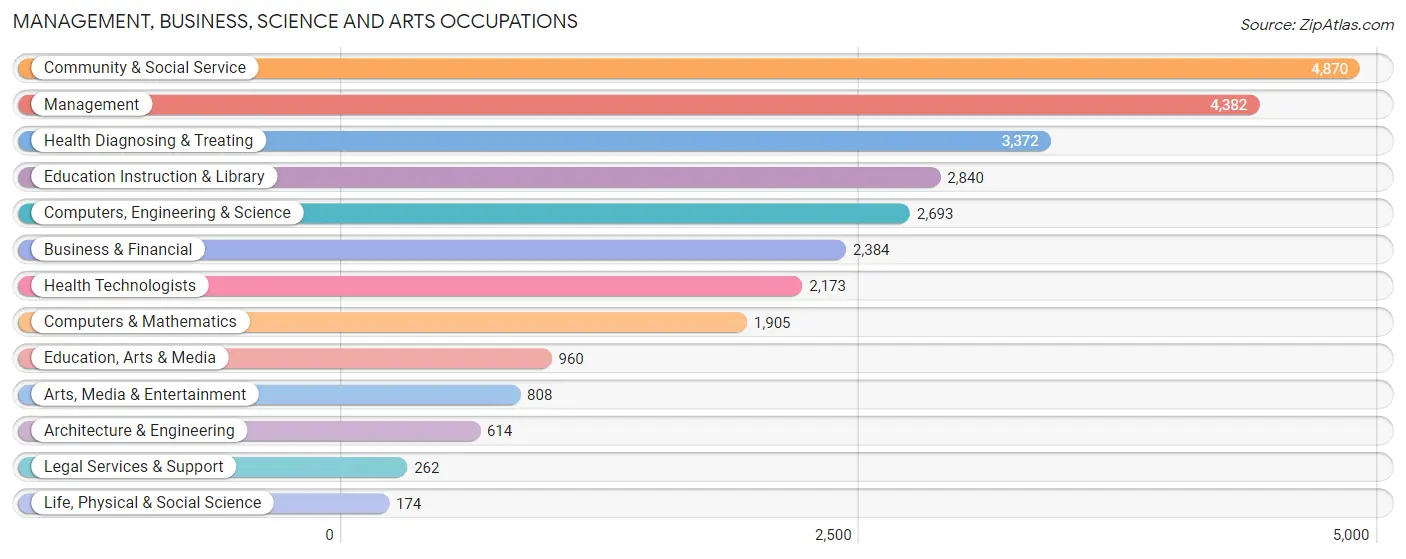
Management, Business, Science and Arts Occupations
The most common Management, Business, Science and Arts occupations in Maury County are Community & Social Service (4,870 | 9.6%), Management (4,382 | 8.6%), Health Diagnosing & Treating (3,372 | 6.6%), Education Instruction & Library (2,840 | 5.6%), and Computers, Engineering & Science (2,693 | 5.3%).
Management, Business, Science and Arts Occupations by Sex
Within the Management, Business, Science and Arts occupations in Maury County, the most male-oriented occupations are Architecture & Engineering (89.7%), Computers, Engineering & Science (79.6%), and Computers & Mathematics (78.9%), while the most female-oriented occupations are Education Instruction & Library (79.4%), Health Diagnosing & Treating (75.0%), and Health Technologists (72.1%).
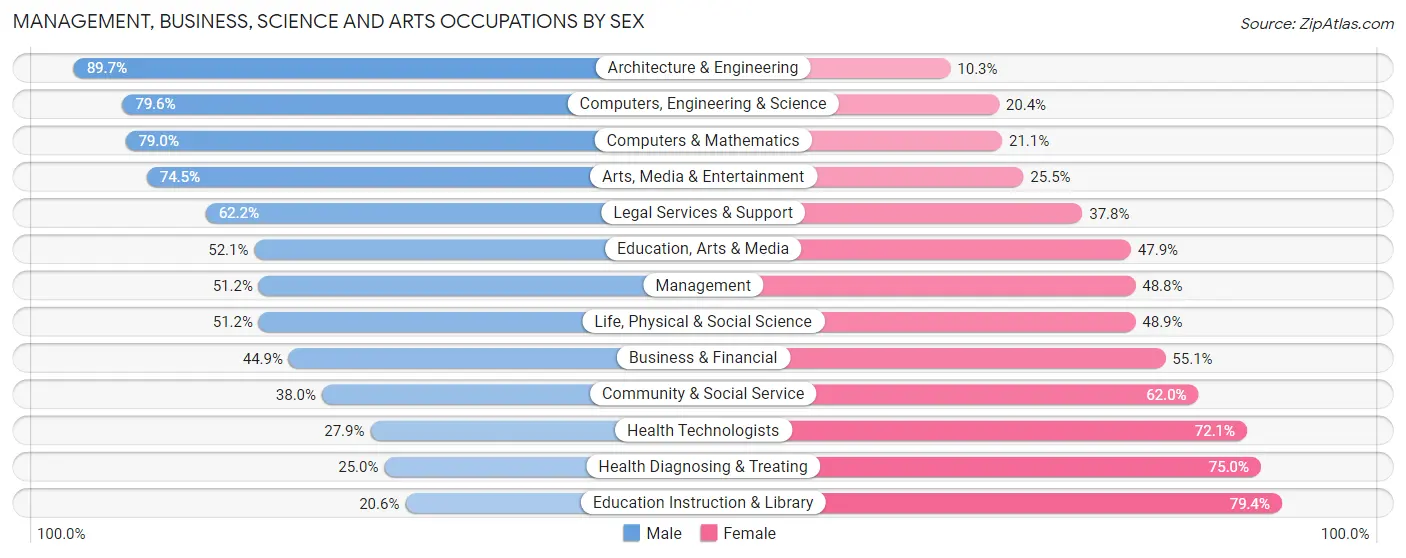
| Occupation | Male | Female |
| Management | 2,242 (51.2%) | 2,140 (48.8%) |
| Business & Financial | 1,070 (44.9%) | 1,314 (55.1%) |
| Computers, Engineering & Science | 2,144 (79.6%) | 549 (20.4%) |
| Computers & Mathematics | 1,504 (78.9%) | 401 (21.0%) |
| Architecture & Engineering | 551 (89.7%) | 63 (10.3%) |
| Life, Physical & Social Science | 89 (51.1%) | 85 (48.8%) |
| Community & Social Service | 1,850 (38.0%) | 3,020 (62.0%) |
| Education, Arts & Media | 500 (52.1%) | 460 (47.9%) |
| Legal Services & Support | 163 (62.2%) | 99 (37.8%) |
| Education Instruction & Library | 585 (20.6%) | 2,255 (79.4%) |
| Arts, Media & Entertainment | 602 (74.5%) | 206 (25.5%) |
| Health Diagnosing & Treating | 842 (25.0%) | 2,530 (75.0%) |
| Health Technologists | 606 (27.9%) | 1,567 (72.1%) |
| Total (Category) | 8,148 (46.0%) | 9,553 (54.0%) |
| Total (Overall) | 27,294 (53.8%) | 23,464 (46.2%) |
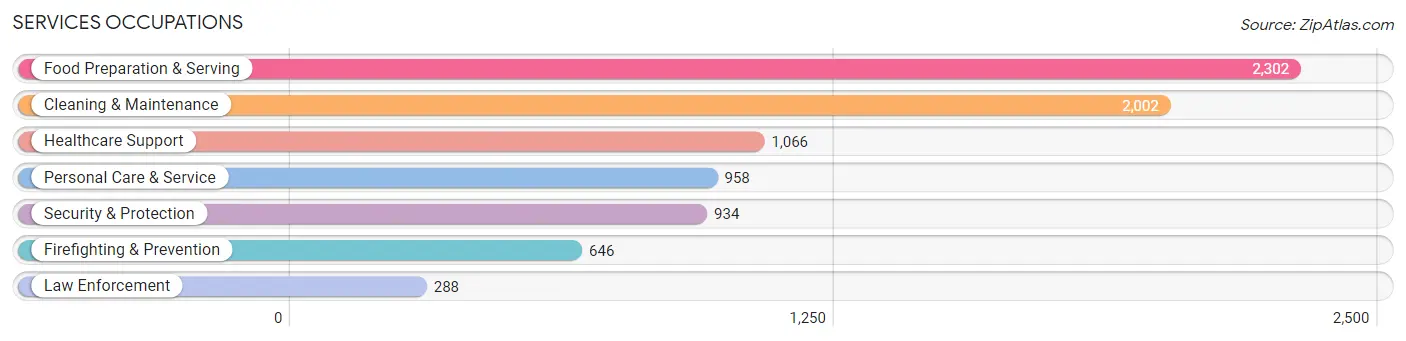
Services Occupations
The most common Services occupations in Maury County are Food Preparation & Serving (2,302 | 4.5%), Cleaning & Maintenance (2,002 | 3.9%), Healthcare Support (1,066 | 2.1%), Personal Care & Service (958 | 1.9%), and Security & Protection (934 | 1.8%).
Services Occupations by Sex
Within the Services occupations in Maury County, the most male-oriented occupations are Firefighting & Prevention (92.7%), Security & Protection (91.2%), and Law Enforcement (87.8%), while the most female-oriented occupations are Personal Care & Service (87.0%), Healthcare Support (82.0%), and Food Preparation & Serving (55.7%).
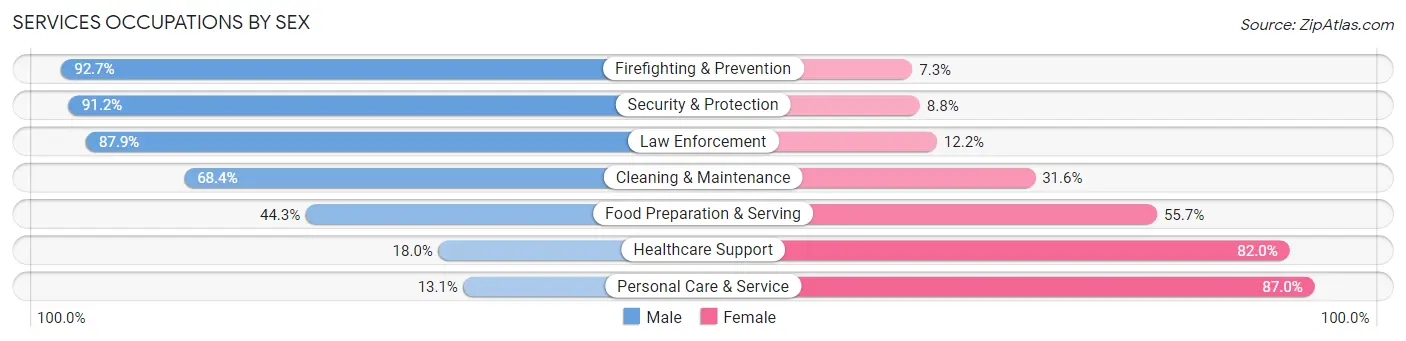
| Occupation | Male | Female |
| Healthcare Support | 192 (18.0%) | 874 (82.0%) |
| Security & Protection | 852 (91.2%) | 82 (8.8%) |
| Firefighting & Prevention | 599 (92.7%) | 47 (7.3%) |
| Law Enforcement | 253 (87.8%) | 35 (12.1%) |
| Food Preparation & Serving | 1,019 (44.3%) | 1,283 (55.7%) |
| Cleaning & Maintenance | 1,369 (68.4%) | 633 (31.6%) |
| Personal Care & Service | 125 (13.1%) | 833 (87.0%) |
| Total (Category) | 3,557 (49.0%) | 3,705 (51.0%) |
| Total (Overall) | 27,294 (53.8%) | 23,464 (46.2%) |
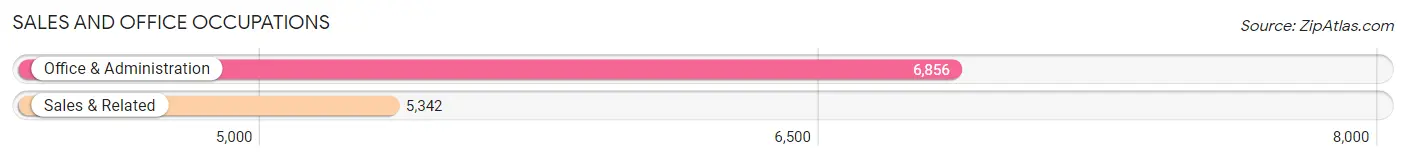
Sales and Office Occupations
The most common Sales and Office occupations in Maury County are Office & Administration (6,856 | 13.5%), and Sales & Related (5,342 | 10.5%).
Sales and Office Occupations by Sex
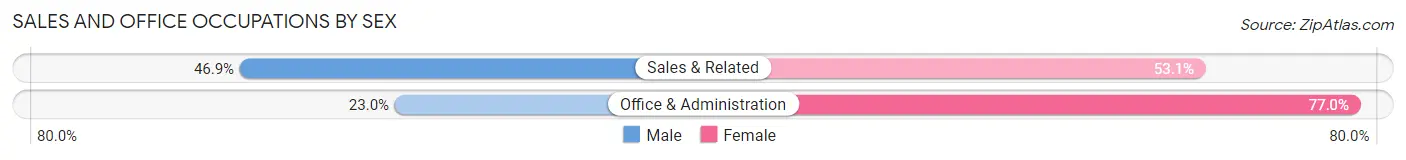
| Occupation | Male | Female |
| Sales & Related | 2,504 (46.9%) | 2,838 (53.1%) |
| Office & Administration | 1,579 (23.0%) | 5,277 (77.0%) |
| Total (Category) | 4,083 (33.5%) | 8,115 (66.5%) |
| Total (Overall) | 27,294 (53.8%) | 23,464 (46.2%) |
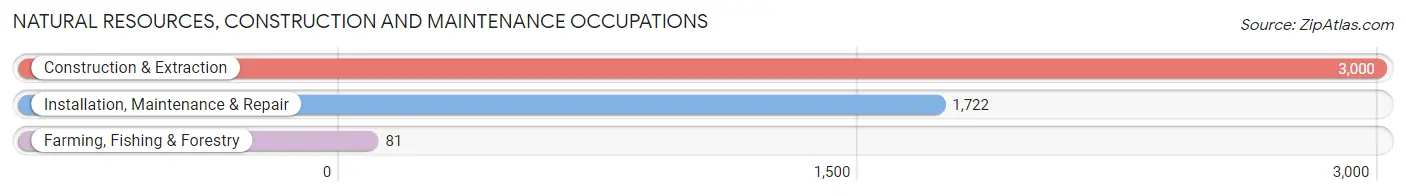
Natural Resources, Construction and Maintenance Occupations
The most common Natural Resources, Construction and Maintenance occupations in Maury County are Construction & Extraction (3,000 | 5.9%), Installation, Maintenance & Repair (1,722 | 3.4%), and Farming, Fishing & Forestry (81 | 0.2%).
Natural Resources, Construction and Maintenance Occupations by Sex
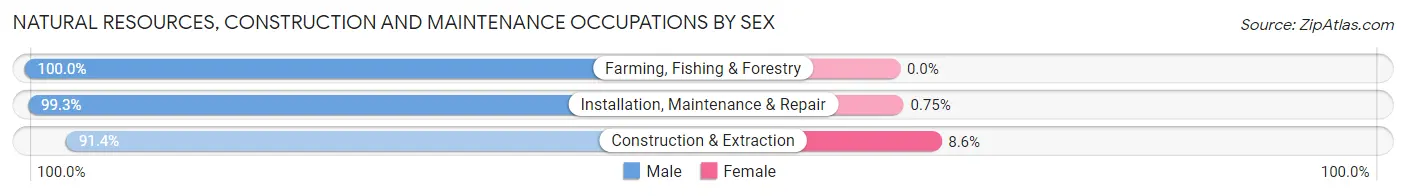
| Occupation | Male | Female |
| Farming, Fishing & Forestry | 81 (100.0%) | 0 (0.0%) |
| Construction & Extraction | 2,742 (91.4%) | 258 (8.6%) |
| Installation, Maintenance & Repair | 1,709 (99.3%) | 13 (0.7%) |
| Total (Category) | 4,532 (94.4%) | 271 (5.6%) |
| Total (Overall) | 27,294 (53.8%) | 23,464 (46.2%) |
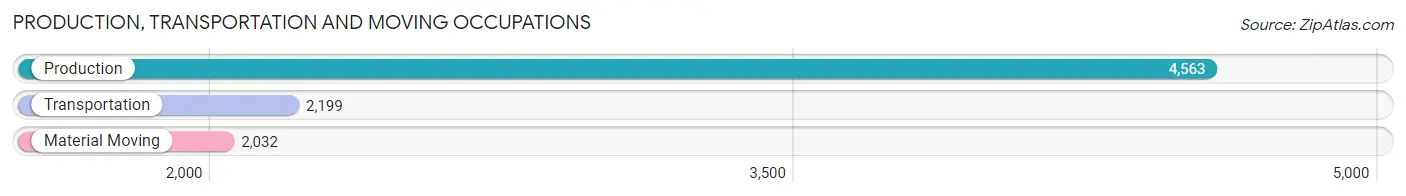
Production, Transportation and Moving Occupations
The most common Production, Transportation and Moving occupations in Maury County are Production (4,563 | 9.0%), Transportation (2,199 | 4.3%), and Material Moving (2,032 | 4.0%).
Production, Transportation and Moving Occupations by Sex
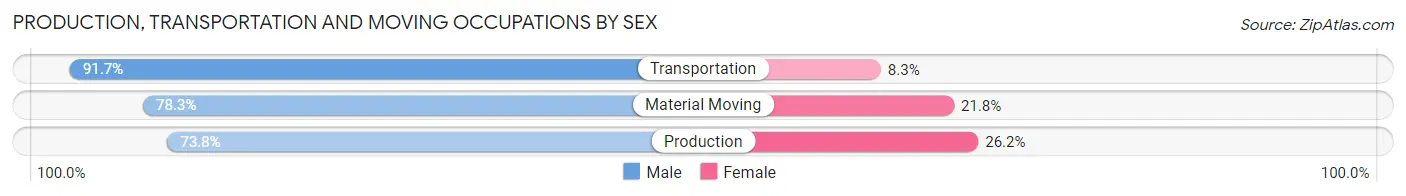
| Occupation | Male | Female |
| Production | 3,368 (73.8%) | 1,195 (26.2%) |
| Transportation | 2,016 (91.7%) | 183 (8.3%) |
| Material Moving | 1,590 (78.2%) | 442 (21.7%) |
| Total (Category) | 6,974 (79.3%) | 1,820 (20.7%) |
| Total (Overall) | 27,294 (53.8%) | 23,464 (46.2%) |
Employment Industries by Sex in Maury County
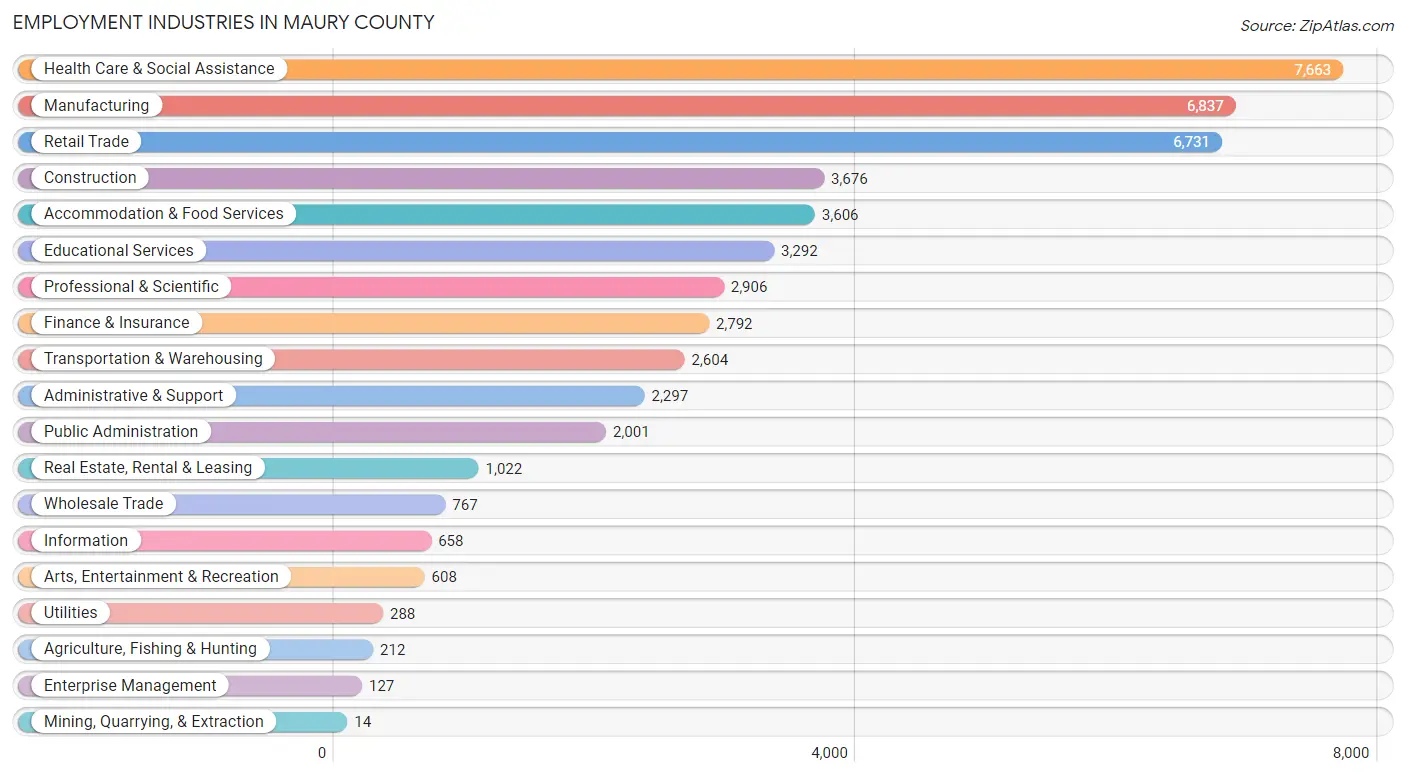
Employment Industries in Maury County
The major employment industries in Maury County include Health Care & Social Assistance (7,663 | 15.1%), Manufacturing (6,837 | 13.5%), Retail Trade (6,731 | 13.3%), Construction (3,676 | 7.2%), and Accommodation & Food Services (3,606 | 7.1%).
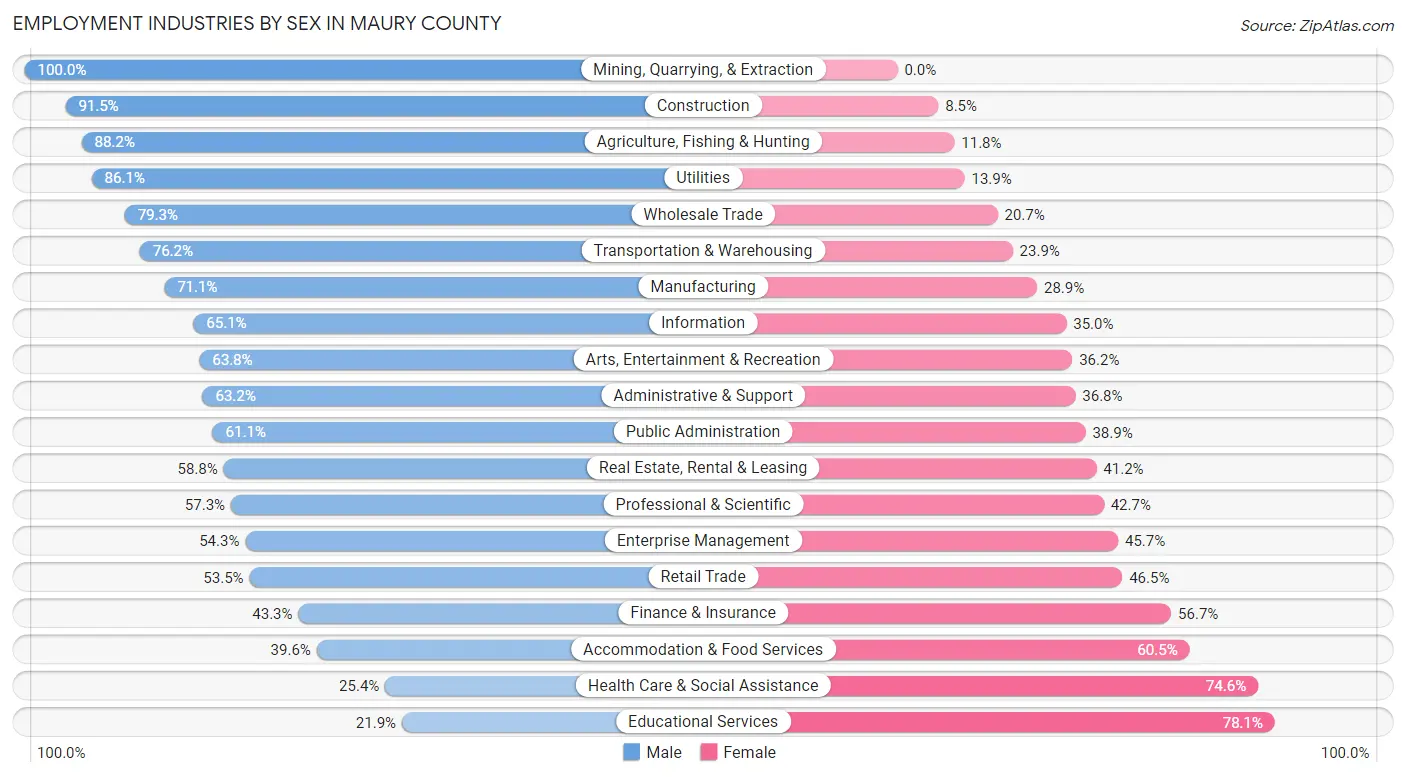
Employment Industries by Sex in Maury County
The Maury County industries that see more men than women are Mining, Quarrying, & Extraction (100.0%), Construction (91.5%), and Agriculture, Fishing & Hunting (88.2%), whereas the industries that tend to have a higher number of women are Educational Services (78.1%), Health Care & Social Assistance (74.6%), and Accommodation & Food Services (60.5%).
| Industry | Male | Female |
| Agriculture, Fishing & Hunting | 187 (88.2%) | 25 (11.8%) |
| Mining, Quarrying, & Extraction | 14 (100.0%) | 0 (0.0%) |
| Construction | 3,365 (91.5%) | 311 (8.5%) |
| Manufacturing | 4,861 (71.1%) | 1,976 (28.9%) |
| Wholesale Trade | 608 (79.3%) | 159 (20.7%) |
| Retail Trade | 3,599 (53.5%) | 3,132 (46.5%) |
| Transportation & Warehousing | 1,983 (76.1%) | 621 (23.8%) |
| Utilities | 248 (86.1%) | 40 (13.9%) |
| Information | 428 (65.0%) | 230 (34.9%) |
| Finance & Insurance | 1,210 (43.3%) | 1,582 (56.7%) |
| Real Estate, Rental & Leasing | 601 (58.8%) | 421 (41.2%) |
| Professional & Scientific | 1,665 (57.3%) | 1,241 (42.7%) |
| Enterprise Management | 69 (54.3%) | 58 (45.7%) |
| Administrative & Support | 1,451 (63.2%) | 846 (36.8%) |
| Educational Services | 721 (21.9%) | 2,571 (78.1%) |
| Health Care & Social Assistance | 1,944 (25.4%) | 5,719 (74.6%) |
| Arts, Entertainment & Recreation | 388 (63.8%) | 220 (36.2%) |
| Accommodation & Food Services | 1,426 (39.6%) | 2,180 (60.5%) |
| Public Administration | 1,222 (61.1%) | 779 (38.9%) |
| Total | 27,294 (53.8%) | 23,464 (46.2%) |
Education in Maury County
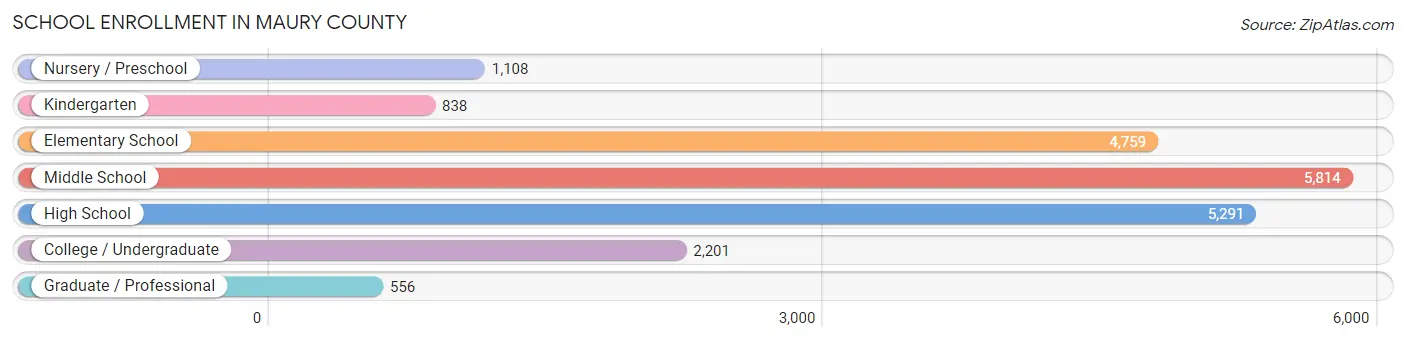
School Enrollment in Maury County
The most common levels of schooling among the 20,567 students in Maury County are middle school (5,814 | 28.3%), high school (5,291 | 25.7%), and elementary school (4,759 | 23.1%).
| School Level | # Students | % Students |
| Nursery / Preschool | 1,108 | 5.4% |
| Kindergarten | 838 | 4.1% |
| Elementary School | 4,759 | 23.1% |
| Middle School | 5,814 | 28.3% |
| High School | 5,291 | 25.7% |
| College / Undergraduate | 2,201 | 10.7% |
| Graduate / Professional | 556 | 2.7% |
| Total | 20,567 | 100.0% |
School Enrollment by Age by Funding Source in Maury County
Out of a total of 20,567 students who are enrolled in schools in Maury County, 3,558 (17.3%) attend a private institution, while the remaining 17,009 (82.7%) are enrolled in public schools. The age group of 35 years and over has the highest likelihood of being enrolled in private schools, with 311 (32.2% in the age bracket) enrolled. Conversely, the age group of 15 to 17 year olds has the lowest likelihood of being enrolled in a private school, with 3,500 (88.2% in the age bracket) attending a public institution.
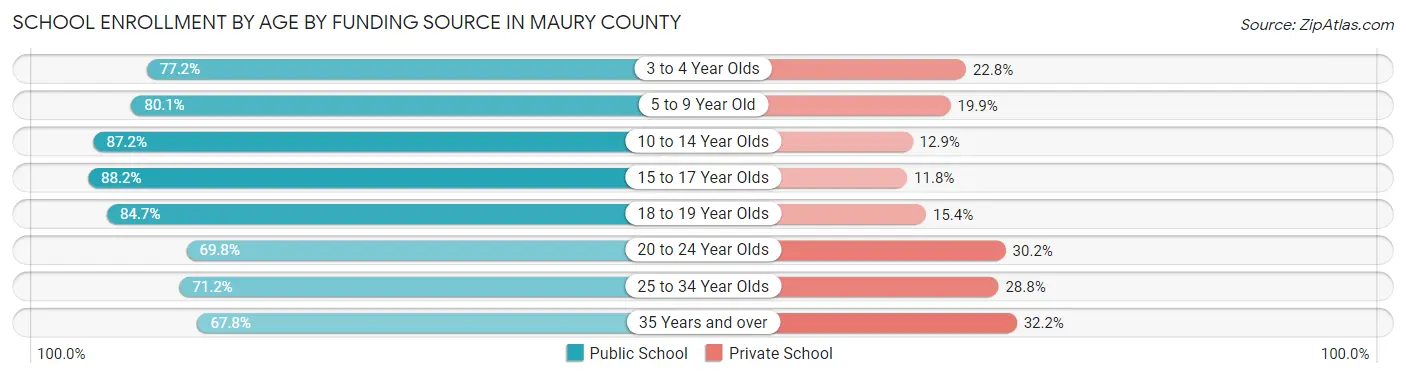
| Age Bracket | Public School | Private School |
| 3 to 4 Year Olds | 834 (77.2%) | 246 (22.8%) |
| 5 to 9 Year Old | 4,142 (80.1%) | 1,029 (19.9%) |
| 10 to 14 Year Olds | 5,921 (87.2%) | 873 (12.9%) |
| 15 to 17 Year Olds | 3,500 (88.2%) | 469 (11.8%) |
| 18 to 19 Year Olds | 871 (84.7%) | 158 (15.3%) |
| 20 to 24 Year Olds | 757 (69.8%) | 327 (30.2%) |
| 25 to 34 Year Olds | 338 (71.2%) | 137 (28.8%) |
| 35 Years and over | 654 (67.8%) | 311 (32.2%) |
| Total | 17,009 (82.7%) | 3,558 (17.3%) |
Educational Attainment by Field of Study in Maury County
Business (4,554 | 23.3%), education (2,509 | 12.8%), science & technology (2,138 | 10.9%), arts & humanities (1,570 | 8.0%), and liberal arts & history (1,011 | 5.2%) are the most common fields of study among 19,553 individuals in Maury County who have obtained a bachelor's degree or higher.
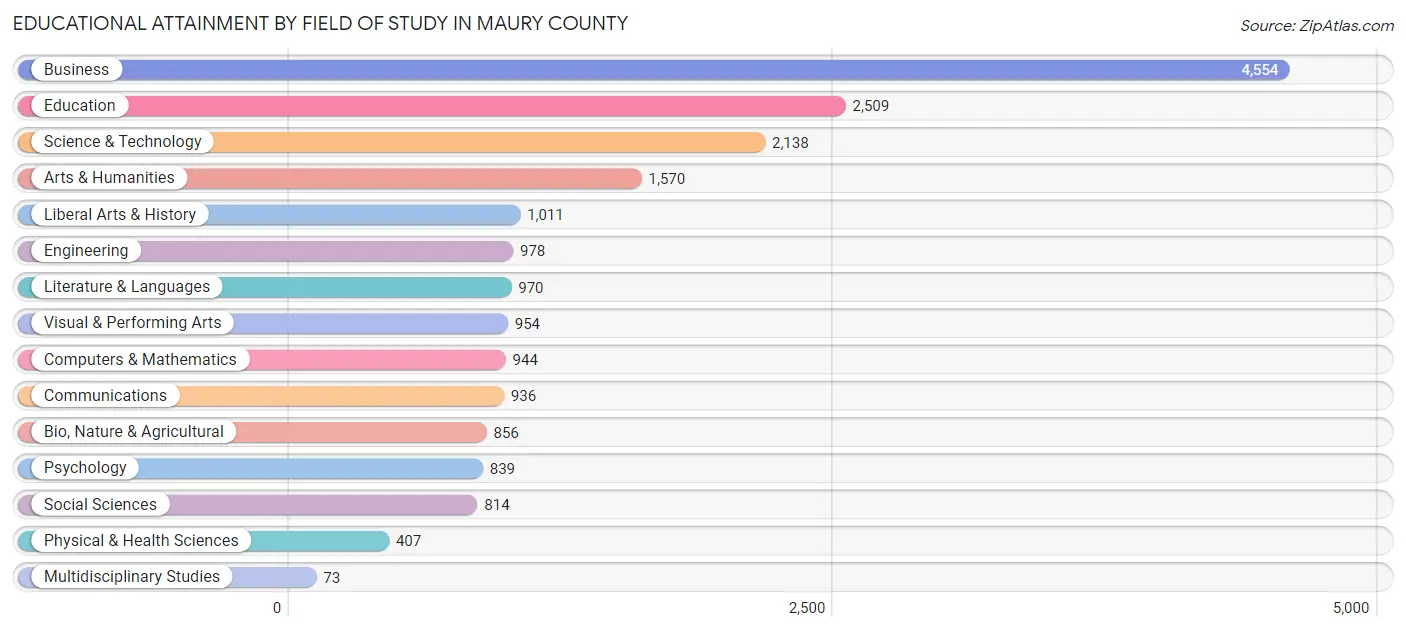
| Field of Study | # Graduates | % Graduates |
| Computers & Mathematics | 944 | 4.8% |
| Bio, Nature & Agricultural | 856 | 4.4% |
| Physical & Health Sciences | 407 | 2.1% |
| Psychology | 839 | 4.3% |
| Social Sciences | 814 | 4.2% |
| Engineering | 978 | 5.0% |
| Multidisciplinary Studies | 73 | 0.4% |
| Science & Technology | 2,138 | 10.9% |
| Business | 4,554 | 23.3% |
| Education | 2,509 | 12.8% |
| Literature & Languages | 970 | 5.0% |
| Liberal Arts & History | 1,011 | 5.2% |
| Visual & Performing Arts | 954 | 4.9% |
| Communications | 936 | 4.8% |
| Arts & Humanities | 1,570 | 8.0% |
| Total | 19,553 | 100.0% |
Transportation & Commute in Maury County
Vehicle Availability by Sex in Maury County
The most prevalent vehicle ownership categories in Maury County are males with 2 vehicles (10,765, accounting for 40.0%) and females with 2 vehicles (9,067, making up 46.7%).
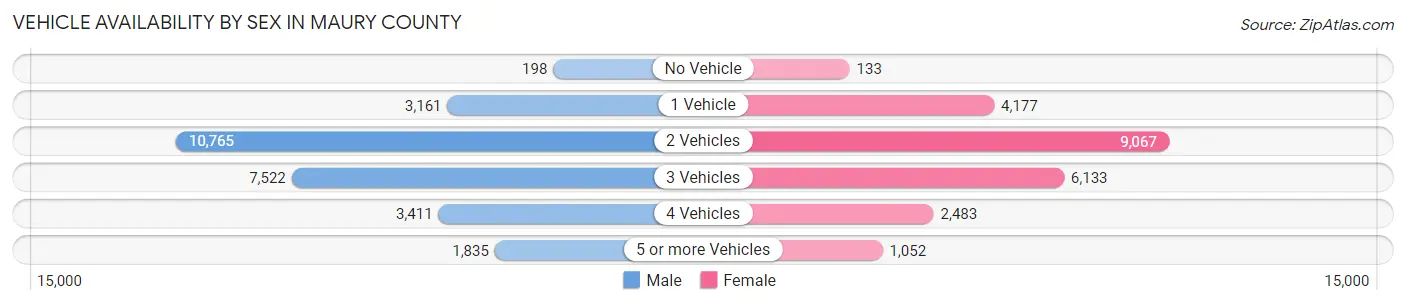
| Vehicles Available | Male | Female |
| No Vehicle | 198 (0.7%) | 133 (0.6%) |
| 1 Vehicle | 3,161 (11.7%) | 4,177 (18.1%) |
| 2 Vehicles | 10,765 (40.0%) | 9,067 (39.3%) |
| 3 Vehicles | 7,522 (28.0%) | 6,133 (26.6%) |
| 4 Vehicles | 3,411 (12.7%) | 2,483 (10.8%) |
| 5 or more Vehicles | 1,835 (6.8%) | 1,052 (4.6%) |
| Total | 26,892 (100.0%) | 23,045 (100.0%) |
Commute Time in Maury County
The most frequently occuring commute durations in Maury County are 30 to 34 minutes (6,966 commuters, 15.9%), 20 to 24 minutes (5,975 commuters, 13.6%), and 15 to 19 minutes (5,481 commuters, 12.5%).
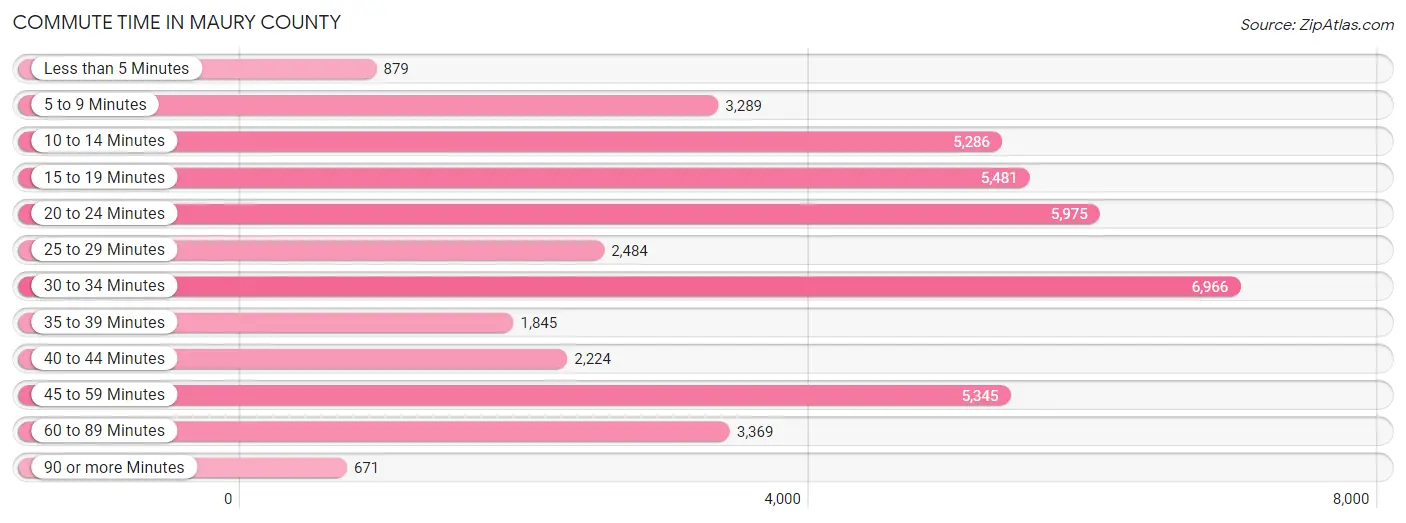
| Commute Time | # Commuters | % Commuters |
| Less than 5 Minutes | 879 | 2.0% |
| 5 to 9 Minutes | 3,289 | 7.5% |
| 10 to 14 Minutes | 5,286 | 12.1% |
| 15 to 19 Minutes | 5,481 | 12.5% |
| 20 to 24 Minutes | 5,975 | 13.6% |
| 25 to 29 Minutes | 2,484 | 5.7% |
| 30 to 34 Minutes | 6,966 | 15.9% |
| 35 to 39 Minutes | 1,845 | 4.2% |
| 40 to 44 Minutes | 2,224 | 5.1% |
| 45 to 59 Minutes | 5,345 | 12.2% |
| 60 to 89 Minutes | 3,369 | 7.7% |
| 90 or more Minutes | 671 | 1.5% |
Commute Time by Sex in Maury County
The most common commute times in Maury County are 30 to 34 minutes (3,655 commuters, 15.7%) for males and 30 to 34 minutes (3,311 commuters, 16.2%) for females.
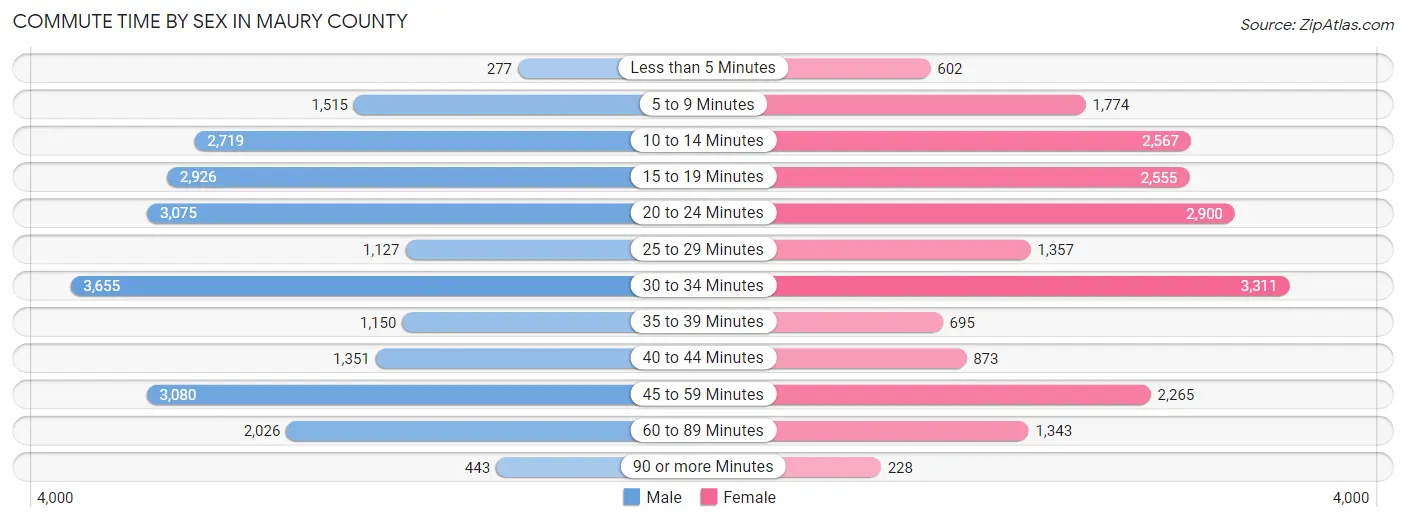
| Commute Time | Male | Female |
| Less than 5 Minutes | 277 (1.2%) | 602 (2.9%) |
| 5 to 9 Minutes | 1,515 (6.5%) | 1,774 (8.7%) |
| 10 to 14 Minutes | 2,719 (11.7%) | 2,567 (12.5%) |
| 15 to 19 Minutes | 2,926 (12.5%) | 2,555 (12.5%) |
| 20 to 24 Minutes | 3,075 (13.2%) | 2,900 (14.2%) |
| 25 to 29 Minutes | 1,127 (4.8%) | 1,357 (6.6%) |
| 30 to 34 Minutes | 3,655 (15.7%) | 3,311 (16.2%) |
| 35 to 39 Minutes | 1,150 (4.9%) | 695 (3.4%) |
| 40 to 44 Minutes | 1,351 (5.8%) | 873 (4.3%) |
| 45 to 59 Minutes | 3,080 (13.2%) | 2,265 (11.1%) |
| 60 to 89 Minutes | 2,026 (8.7%) | 1,343 (6.6%) |
| 90 or more Minutes | 443 (1.9%) | 228 (1.1%) |
Time of Departure to Work by Sex in Maury County
The most frequent times of departure to work in Maury County are 6:00 AM to 6:29 AM (3,711, 15.9%) for males and 7:00 AM to 7:29 AM (3,650, 17.8%) for females.
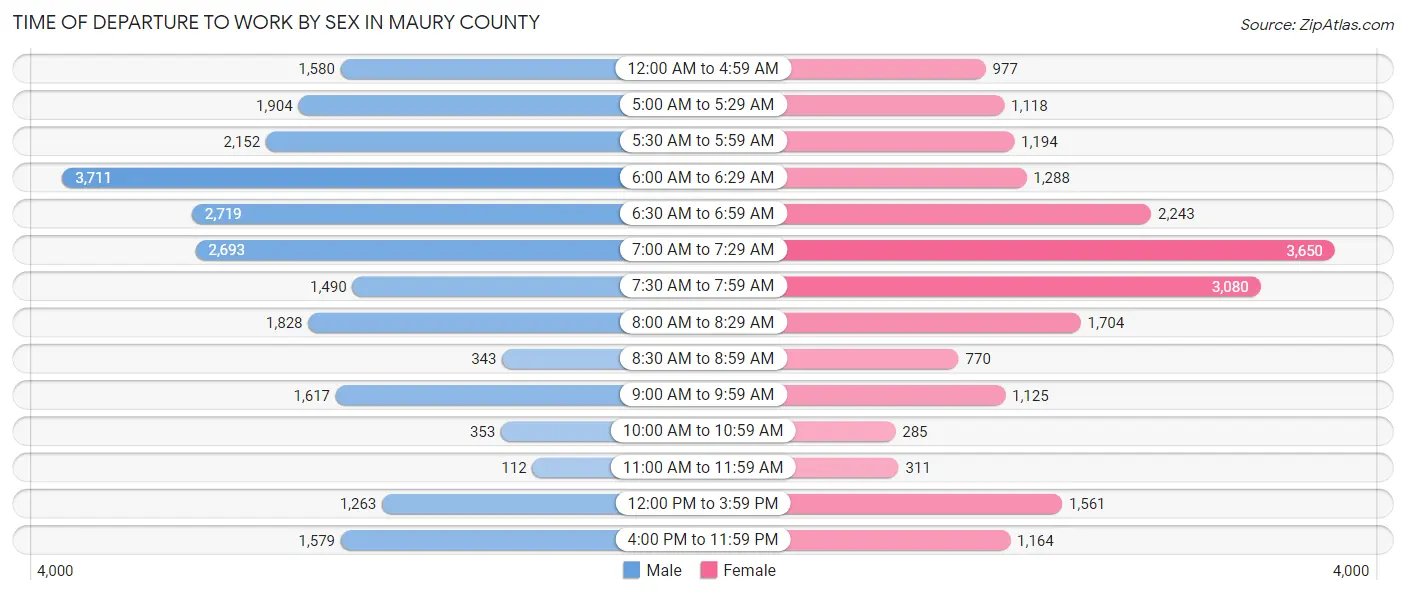
| Time of Departure | Male | Female |
| 12:00 AM to 4:59 AM | 1,580 (6.8%) | 977 (4.8%) |
| 5:00 AM to 5:29 AM | 1,904 (8.2%) | 1,118 (5.5%) |
| 5:30 AM to 5:59 AM | 2,152 (9.2%) | 1,194 (5.8%) |
| 6:00 AM to 6:29 AM | 3,711 (15.9%) | 1,288 (6.3%) |
| 6:30 AM to 6:59 AM | 2,719 (11.7%) | 2,243 (11.0%) |
| 7:00 AM to 7:29 AM | 2,693 (11.5%) | 3,650 (17.8%) |
| 7:30 AM to 7:59 AM | 1,490 (6.4%) | 3,080 (15.0%) |
| 8:00 AM to 8:29 AM | 1,828 (7.8%) | 1,704 (8.3%) |
| 8:30 AM to 8:59 AM | 343 (1.5%) | 770 (3.8%) |
| 9:00 AM to 9:59 AM | 1,617 (6.9%) | 1,125 (5.5%) |
| 10:00 AM to 10:59 AM | 353 (1.5%) | 285 (1.4%) |
| 11:00 AM to 11:59 AM | 112 (0.5%) | 311 (1.5%) |
| 12:00 PM to 3:59 PM | 1,263 (5.4%) | 1,561 (7.6%) |
| 4:00 PM to 11:59 PM | 1,579 (6.8%) | 1,164 (5.7%) |
| Total | 23,344 (100.0%) | 20,470 (100.0%) |
Housing Occupancy in Maury County
Occupancy by Ownership in Maury County
Of the total 39,591 dwellings in Maury County, owner-occupied units account for 28,507 (72.0%), while renter-occupied units make up 11,084 (28.0%).
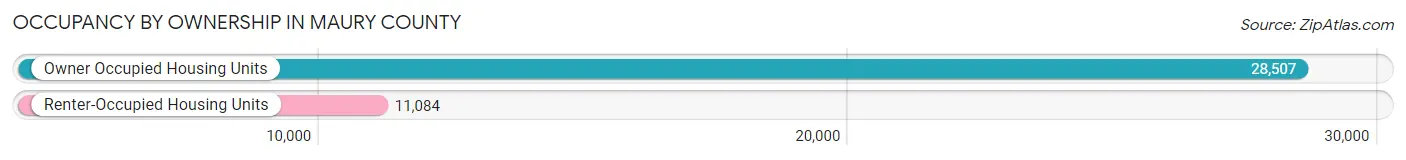
| Occupancy | # Housing Units | % Housing Units |
| Owner Occupied Housing Units | 28,507 | 72.0% |
| Renter-Occupied Housing Units | 11,084 | 28.0% |
| Total Occupied Housing Units | 39,591 | 100.0% |
Occupancy by Household Size in Maury County
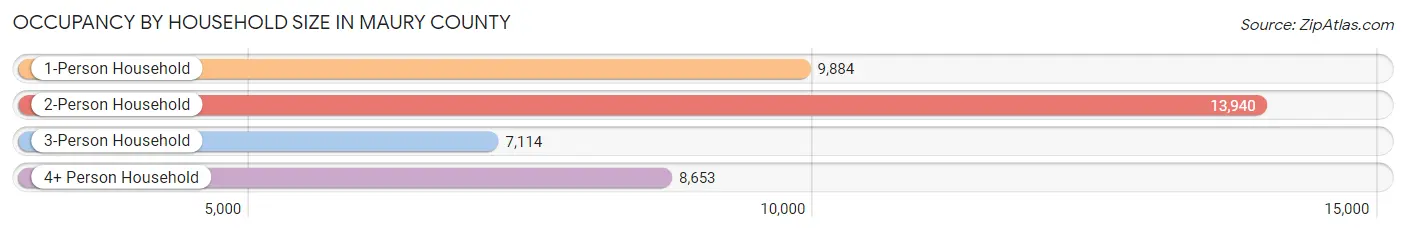
| Household Size | # Housing Units | % Housing Units |
| 1-Person Household | 9,884 | 25.0% |
| 2-Person Household | 13,940 | 35.2% |
| 3-Person Household | 7,114 | 18.0% |
| 4+ Person Household | 8,653 | 21.9% |
| Total Housing Units | 39,591 | 100.0% |
Occupancy by Ownership by Household Size in Maury County
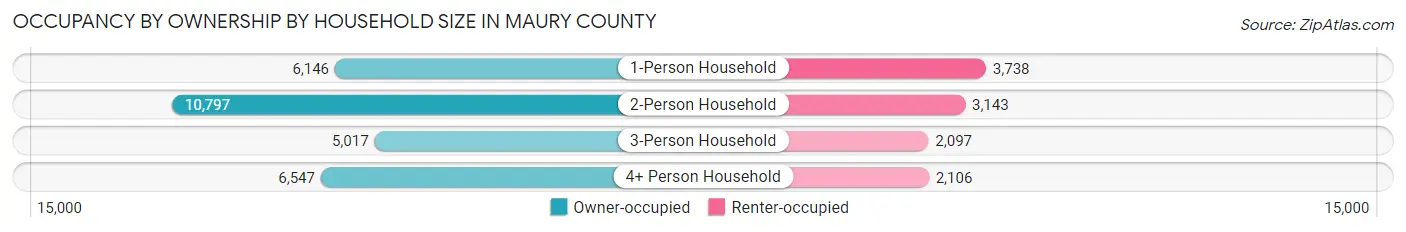
| Household Size | Owner-occupied | Renter-occupied |
| 1-Person Household | 6,146 (62.2%) | 3,738 (37.8%) |
| 2-Person Household | 10,797 (77.4%) | 3,143 (22.6%) |
| 3-Person Household | 5,017 (70.5%) | 2,097 (29.5%) |
| 4+ Person Household | 6,547 (75.7%) | 2,106 (24.3%) |
| Total Housing Units | 28,507 (72.0%) | 11,084 (28.0%) |
Occupancy by Educational Attainment in Maury County
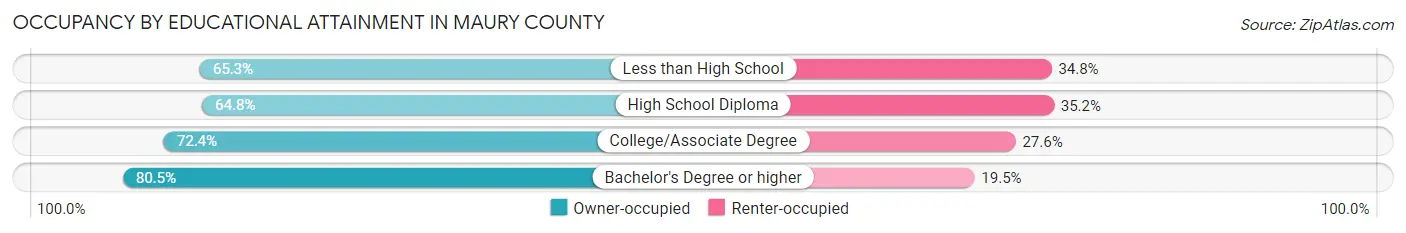
| Household Size | Owner-occupied | Renter-occupied |
| Less than High School | 1,829 (65.2%) | 974 (34.7%) |
| High School Diploma | 7,521 (64.8%) | 4,087 (35.2%) |
| College/Associate Degree | 9,939 (72.4%) | 3,793 (27.6%) |
| Bachelor's Degree or higher | 9,218 (80.5%) | 2,230 (19.5%) |
Occupancy by Age of Householder in Maury County
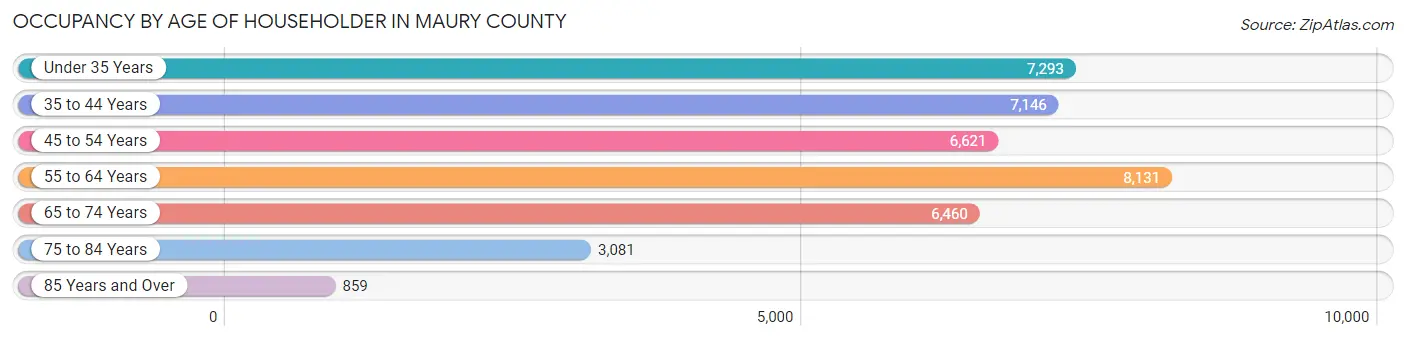
| Age Bracket | # Households | % Households |
| Under 35 Years | 7,293 | 18.4% |
| 35 to 44 Years | 7,146 | 18.0% |
| 45 to 54 Years | 6,621 | 16.7% |
| 55 to 64 Years | 8,131 | 20.5% |
| 65 to 74 Years | 6,460 | 16.3% |
| 75 to 84 Years | 3,081 | 7.8% |
| 85 Years and Over | 859 | 2.2% |
| Total | 39,591 | 100.0% |
Housing Finances in Maury County
Median Income by Occupancy in Maury County
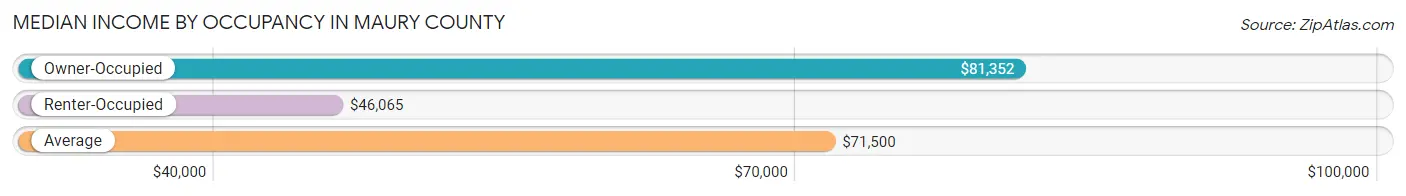
| Occupancy Type | # Households | Median Income |
| Owner-Occupied | 28,507 (72.0%) | $81,352 |
| Renter-Occupied | 11,084 (28.0%) | $46,065 |
| Average | 39,591 (100.0%) | $71,500 |
Occupancy by Householder Income Bracket in Maury County
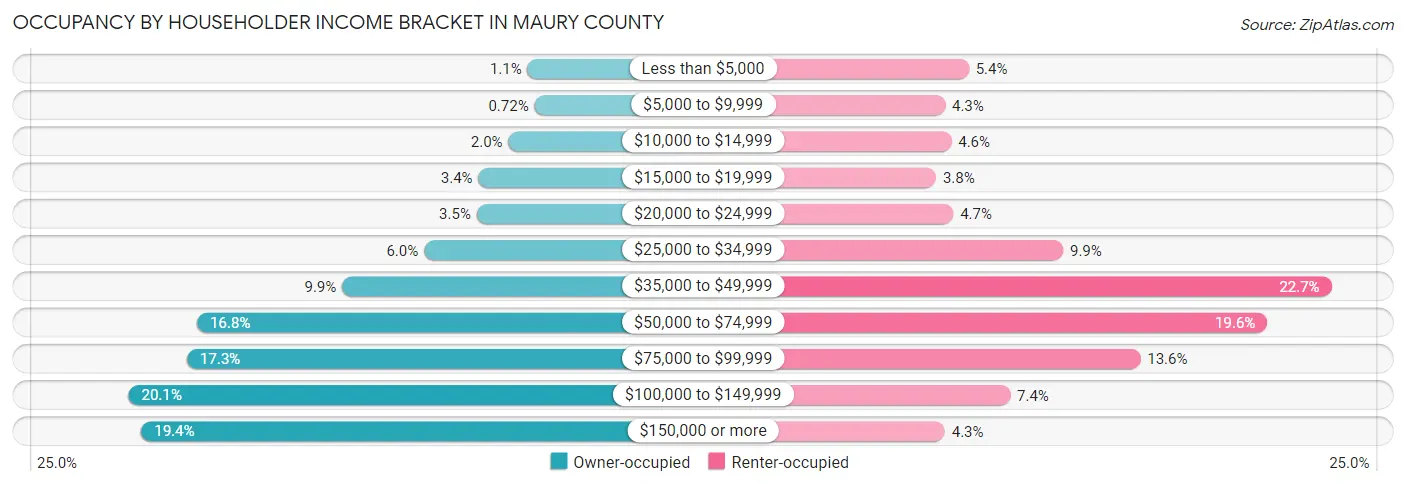
| Income Bracket | Owner-occupied | Renter-occupied |
| Less than $5,000 | 300 (1.1%) | 597 (5.4%) |
| $5,000 to $9,999 | 204 (0.7%) | 472 (4.3%) |
| $10,000 to $14,999 | 559 (2.0%) | 505 (4.6%) |
| $15,000 to $19,999 | 965 (3.4%) | 425 (3.8%) |
| $20,000 to $24,999 | 989 (3.5%) | 515 (4.6%) |
| $25,000 to $34,999 | 1,706 (6.0%) | 1,095 (9.9%) |
| $35,000 to $49,999 | 2,816 (9.9%) | 2,512 (22.7%) |
| $50,000 to $74,999 | 4,787 (16.8%) | 2,173 (19.6%) |
| $75,000 to $99,999 | 4,923 (17.3%) | 1,503 (13.6%) |
| $100,000 to $149,999 | 5,717 (20.1%) | 816 (7.4%) |
| $150,000 or more | 5,541 (19.4%) | 471 (4.3%) |
| Total | 28,507 (100.0%) | 11,084 (100.0%) |
Monthly Housing Cost Tiers in Maury County
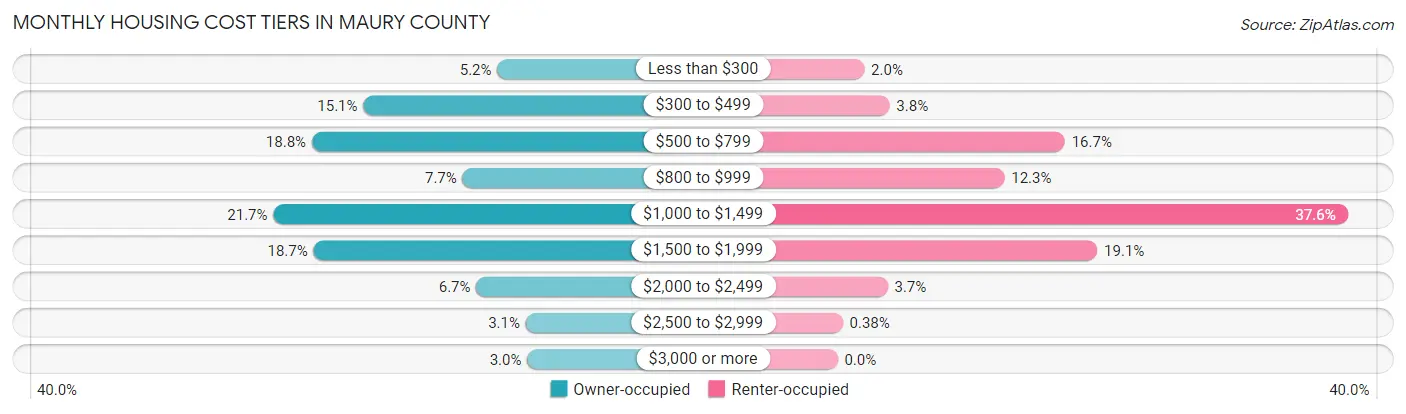
| Monthly Cost | Owner-occupied | Renter-occupied |
| Less than $300 | 1,476 (5.2%) | 218 (2.0%) |
| $300 to $499 | 4,289 (15.0%) | 424 (3.8%) |
| $500 to $799 | 5,370 (18.8%) | 1,855 (16.7%) |
| $800 to $999 | 2,207 (7.7%) | 1,362 (12.3%) |
| $1,000 to $1,499 | 6,180 (21.7%) | 4,164 (37.6%) |
| $1,500 to $1,999 | 5,337 (18.7%) | 2,120 (19.1%) |
| $2,000 to $2,499 | 1,919 (6.7%) | 409 (3.7%) |
| $2,500 to $2,999 | 880 (3.1%) | 42 (0.4%) |
| $3,000 or more | 849 (3.0%) | 0 (0.0%) |
| Total | 28,507 (100.0%) | 11,084 (100.0%) |
Physical Housing Characteristics in Maury County
Housing Structures in Maury County
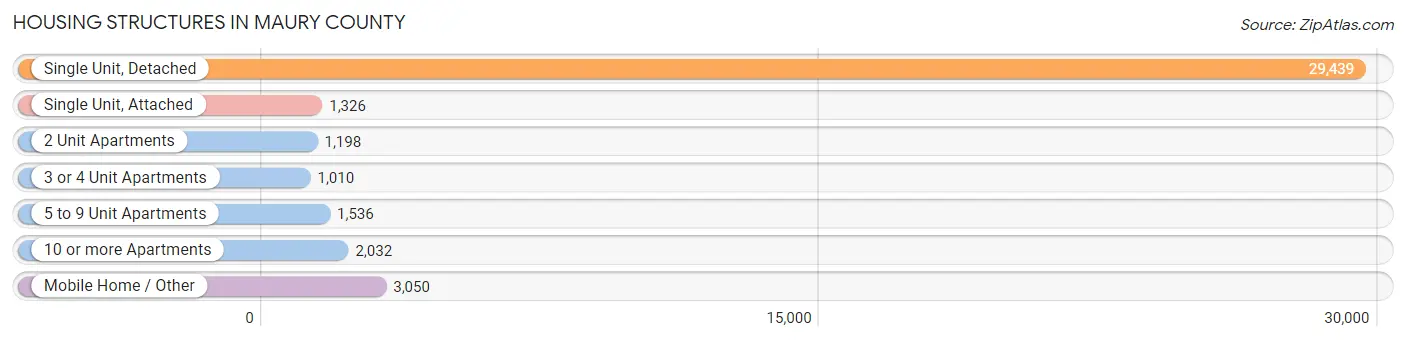
| Structure Type | # Housing Units | % Housing Units |
| Single Unit, Detached | 29,439 | 74.4% |
| Single Unit, Attached | 1,326 | 3.4% |
| 2 Unit Apartments | 1,198 | 3.0% |
| 3 or 4 Unit Apartments | 1,010 | 2.5% |
| 5 to 9 Unit Apartments | 1,536 | 3.9% |
| 10 or more Apartments | 2,032 | 5.1% |
| Mobile Home / Other | 3,050 | 7.7% |
| Total | 39,591 | 100.0% |
Housing Structures by Occupancy in Maury County
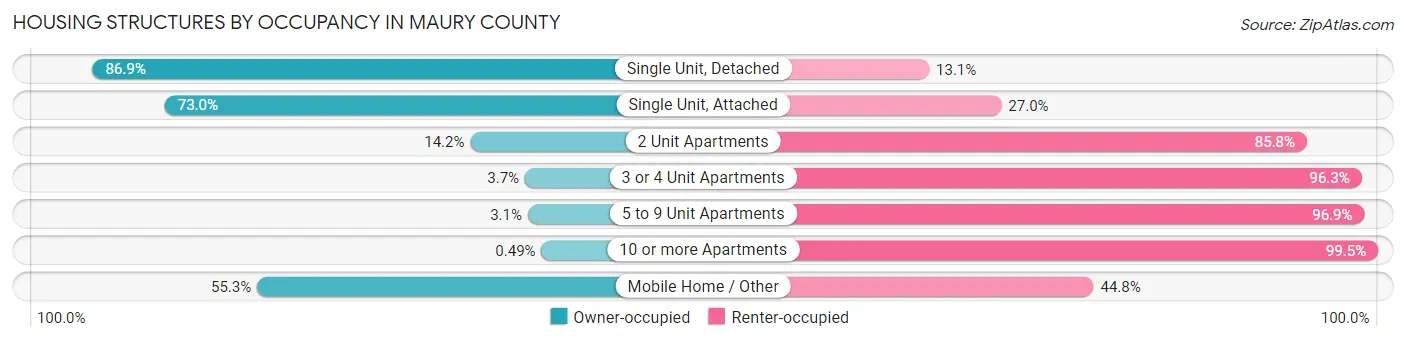
| Structure Type | Owner-occupied | Renter-occupied |
| Single Unit, Detached | 25,589 (86.9%) | 3,850 (13.1%) |
| Single Unit, Attached | 968 (73.0%) | 358 (27.0%) |
| 2 Unit Apartments | 170 (14.2%) | 1,028 (85.8%) |
| 3 or 4 Unit Apartments | 37 (3.7%) | 973 (96.3%) |
| 5 to 9 Unit Apartments | 48 (3.1%) | 1,488 (96.9%) |
| 10 or more Apartments | 10 (0.5%) | 2,022 (99.5%) |
| Mobile Home / Other | 1,685 (55.2%) | 1,365 (44.8%) |
| Total | 28,507 (72.0%) | 11,084 (28.0%) |
Housing Structures by Number of Rooms in Maury County
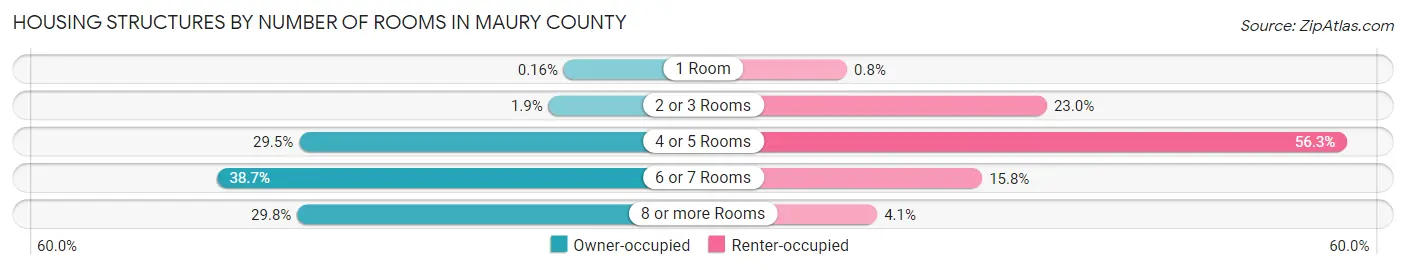
| Number of Rooms | Owner-occupied | Renter-occupied |
| 1 Room | 47 (0.2%) | 89 (0.8%) |
| 2 or 3 Rooms | 527 (1.8%) | 2,547 (23.0%) |
| 4 or 5 Rooms | 8,420 (29.5%) | 6,239 (56.3%) |
| 6 or 7 Rooms | 11,031 (38.7%) | 1,750 (15.8%) |
| 8 or more Rooms | 8,482 (29.7%) | 459 (4.1%) |
| Total | 28,507 (100.0%) | 11,084 (100.0%) |
Housing Structure by Heating Type in Maury County
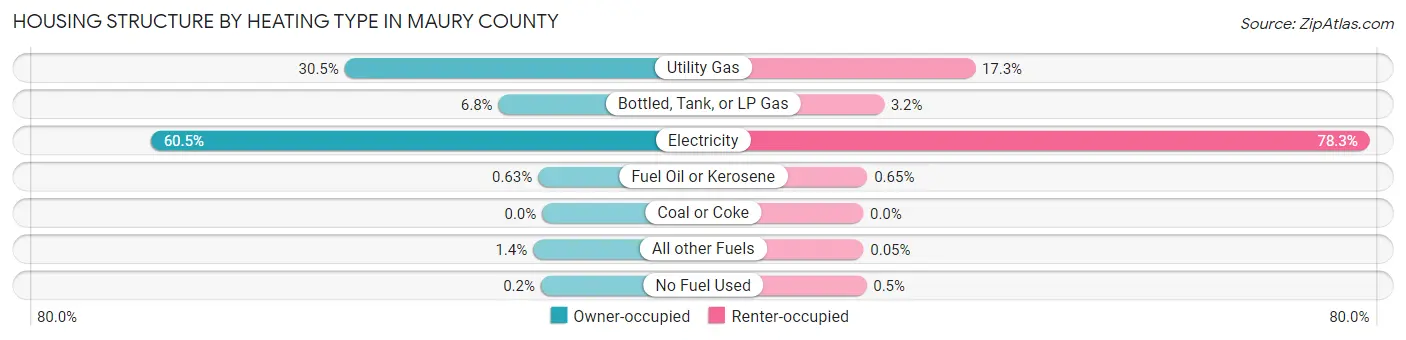
| Heating Type | Owner-occupied | Renter-occupied |
| Utility Gas | 8,703 (30.5%) | 1,918 (17.3%) |
| Bottled, Tank, or LP Gas | 1,923 (6.8%) | 355 (3.2%) |
| Electricity | 17,248 (60.5%) | 8,678 (78.3%) |
| Fuel Oil or Kerosene | 179 (0.6%) | 72 (0.6%) |
| Coal or Coke | 0 (0.0%) | 0 (0.0%) |
| All other Fuels | 398 (1.4%) | 6 (0.1%) |
| No Fuel Used | 56 (0.2%) | 55 (0.5%) |
| Total | 28,507 (100.0%) | 11,084 (100.0%) |
Household Vehicle Usage in Maury County
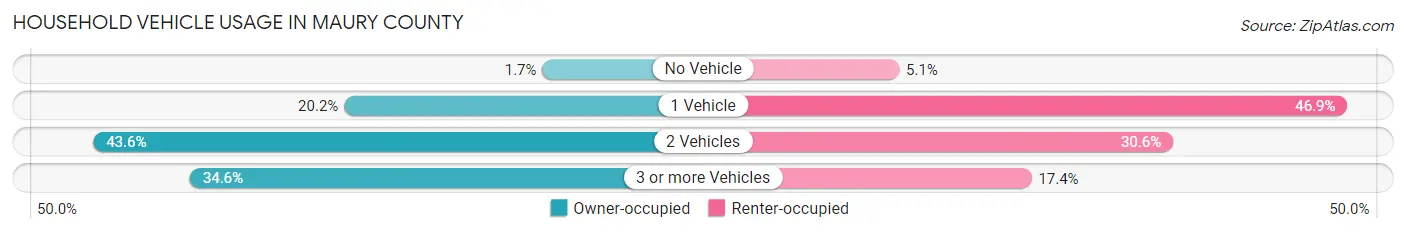
| Vehicles per Household | Owner-occupied | Renter-occupied |
| No Vehicle | 477 (1.7%) | 561 (5.1%) |
| 1 Vehicle | 5,750 (20.2%) | 5,198 (46.9%) |
| 2 Vehicles | 12,425 (43.6%) | 3,395 (30.6%) |
| 3 or more Vehicles | 9,855 (34.6%) | 1,930 (17.4%) |
| Total | 28,507 (100.0%) | 11,084 (100.0%) |
Real Estate & Mortgages in Maury County
Real Estate and Mortgage Overview in Maury County
| Characteristic | Without Mortgage | With Mortgage |
| Housing Units | 10,776 | 17,731 |
| Median Property Value | $248,700 | $285,100 |
| Median Household Income | $63,855 | $3,897 |
| Monthly Housing Costs | $483 | $849 |
| Real Estate Taxes | $1,433 | $552 |
Property Value by Mortgage Status in Maury County
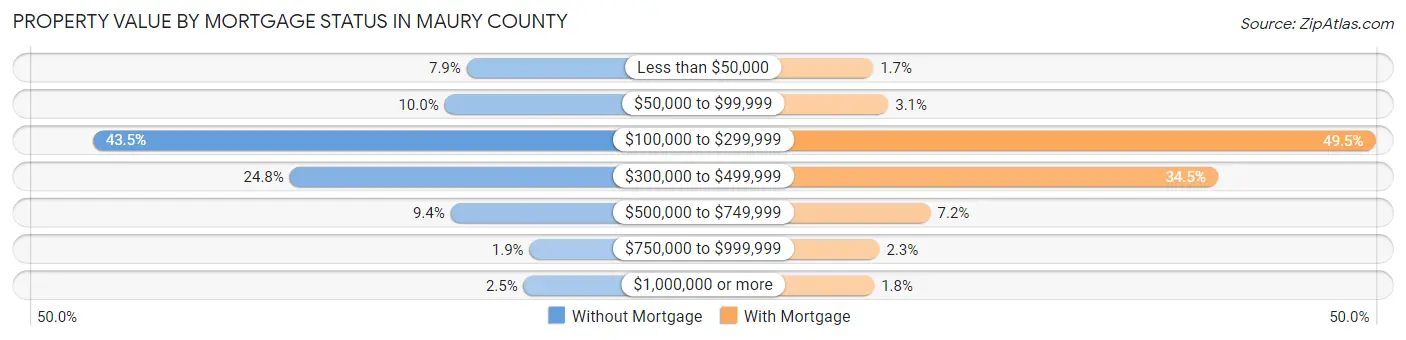
| Property Value | Without Mortgage | With Mortgage |
| Less than $50,000 | 851 (7.9%) | 298 (1.7%) |
| $50,000 to $99,999 | 1,079 (10.0%) | 554 (3.1%) |
| $100,000 to $299,999 | 4,688 (43.5%) | 8,776 (49.5%) |
| $300,000 to $499,999 | 2,668 (24.8%) | 6,116 (34.5%) |
| $500,000 to $749,999 | 1,016 (9.4%) | 1,267 (7.1%) |
| $750,000 to $999,999 | 207 (1.9%) | 404 (2.3%) |
| $1,000,000 or more | 267 (2.5%) | 316 (1.8%) |
| Total | 10,776 (100.0%) | 17,731 (100.0%) |
Household Income by Mortgage Status in Maury County
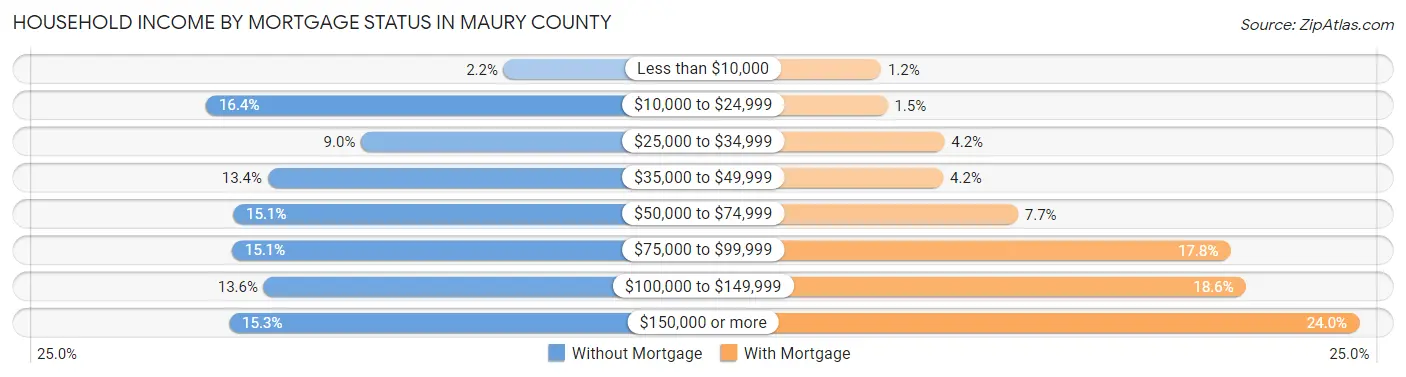
| Household Income | Without Mortgage | With Mortgage |
| Less than $10,000 | 235 (2.2%) | 214 (1.2%) |
| $10,000 to $24,999 | 1,763 (16.4%) | 269 (1.5%) |
| $25,000 to $34,999 | 967 (9.0%) | 750 (4.2%) |
| $35,000 to $49,999 | 1,446 (13.4%) | 739 (4.2%) |
| $50,000 to $74,999 | 1,624 (15.1%) | 1,370 (7.7%) |
| $75,000 to $99,999 | 1,630 (15.1%) | 3,163 (17.8%) |
| $100,000 to $149,999 | 1,467 (13.6%) | 3,293 (18.6%) |
| $150,000 or more | 1,644 (15.3%) | 4,250 (24.0%) |
| Total | 10,776 (100.0%) | 17,731 (100.0%) |
Property Value to Household Income Ratio in Maury County
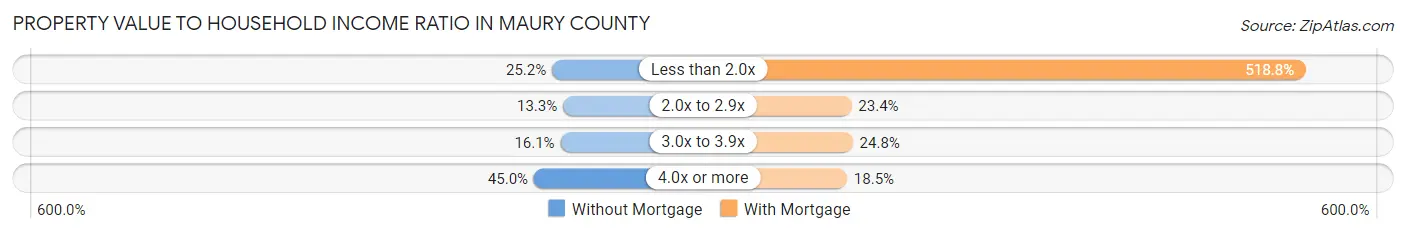
| Value-to-Income Ratio | Without Mortgage | With Mortgage |
| Less than 2.0x | 2,720 (25.2%) | 91,985 (518.8%) |
| 2.0x to 2.9x | 1,429 (13.3%) | 4,153 (23.4%) |
| 3.0x to 3.9x | 1,737 (16.1%) | 4,396 (24.8%) |
| 4.0x or more | 4,849 (45.0%) | 3,286 (18.5%) |
| Total | 10,776 (100.0%) | 17,731 (100.0%) |
Real Estate Taxes by Mortgage Status in Maury County
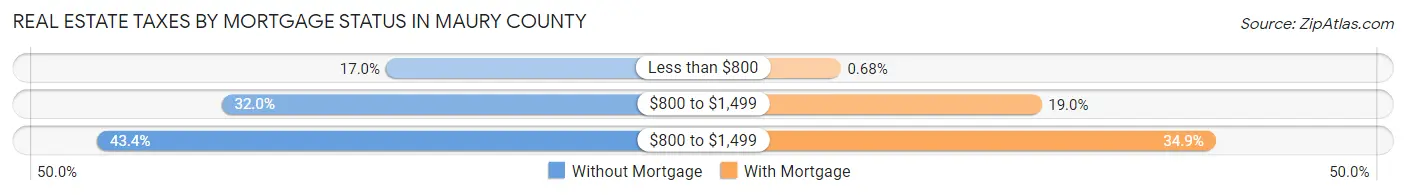
| Property Taxes | Without Mortgage | With Mortgage |
| Less than $800 | 1,833 (17.0%) | 120 (0.7%) |
| $800 to $1,499 | 3,449 (32.0%) | 3,372 (19.0%) |
| $800 to $1,499 | 4,675 (43.4%) | 6,196 (34.9%) |
| Total | 10,776 (100.0%) | 17,731 (100.0%) |
Health & Disability in Maury County
Health Insurance Coverage by Age in Maury County
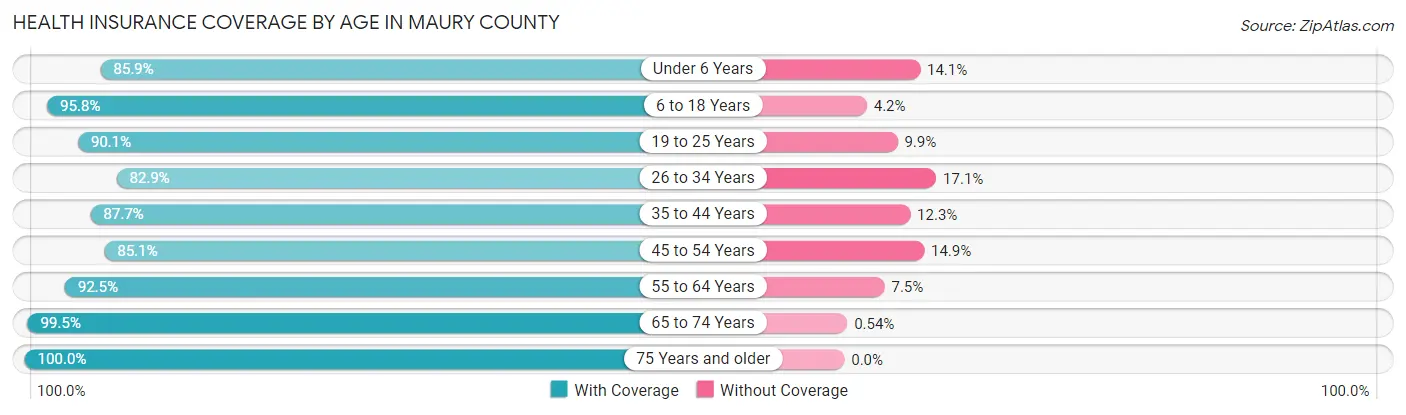
| Age Bracket | With Coverage | Without Coverage |
| Under 6 Years | 6,229 (85.9%) | 1,025 (14.1%) |
| 6 to 18 Years | 16,366 (95.8%) | 716 (4.2%) |
| 19 to 25 Years | 7,690 (90.1%) | 847 (9.9%) |
| 26 to 34 Years | 10,058 (82.9%) | 2,079 (17.1%) |
| 35 to 44 Years | 11,991 (87.7%) | 1,679 (12.3%) |
| 45 to 54 Years | 10,339 (85.1%) | 1,806 (14.9%) |
| 55 to 64 Years | 12,698 (92.5%) | 1,029 (7.5%) |
| 65 to 74 Years | 10,367 (99.5%) | 56 (0.5%) |
| 75 Years and older | 6,021 (100.0%) | 0 (0.0%) |
| Total | 91,759 (90.8%) | 9,237 (9.1%) |
Health Insurance Coverage by Citizenship Status in Maury County
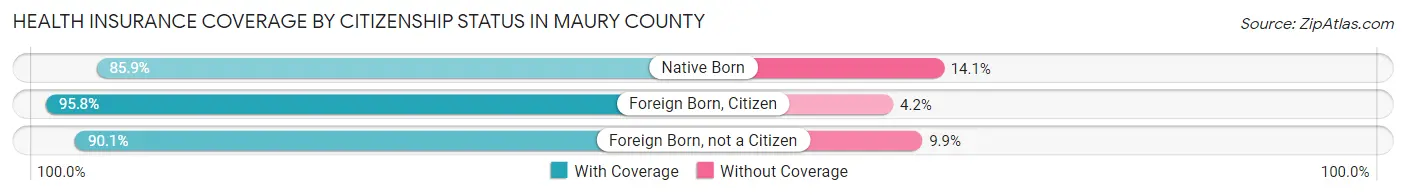
| Citizenship Status | With Coverage | Without Coverage |
| Native Born | 6,229 (85.9%) | 1,025 (14.1%) |
| Foreign Born, Citizen | 16,366 (95.8%) | 716 (4.2%) |
| Foreign Born, not a Citizen | 7,690 (90.1%) | 847 (9.9%) |
Health Insurance Coverage by Household Income in Maury County
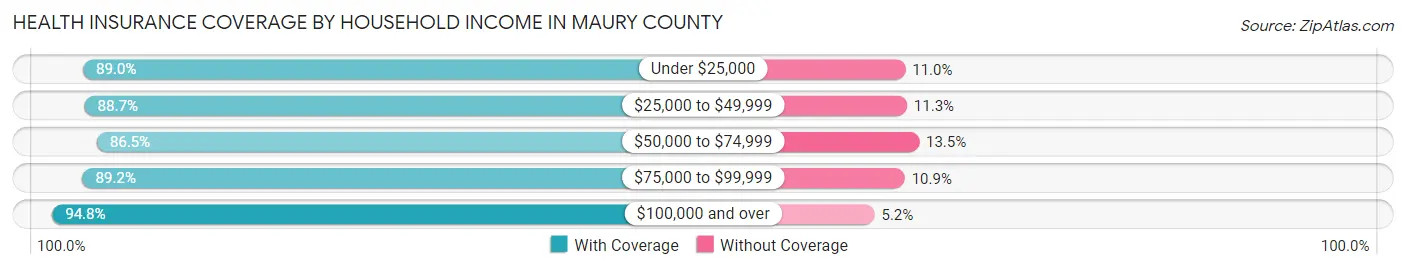
| Household Income | With Coverage | Without Coverage |
| Under $25,000 | 8,298 (89.0%) | 1,021 (11.0%) |
| $25,000 to $49,999 | 14,789 (88.7%) | 1,877 (11.3%) |
| $50,000 to $74,999 | 14,505 (86.5%) | 2,272 (13.5%) |
| $75,000 to $99,999 | 16,026 (89.1%) | 1,950 (10.8%) |
| $100,000 and over | 38,025 (94.8%) | 2,084 (5.2%) |
Public vs Private Health Insurance Coverage by Age in Maury County
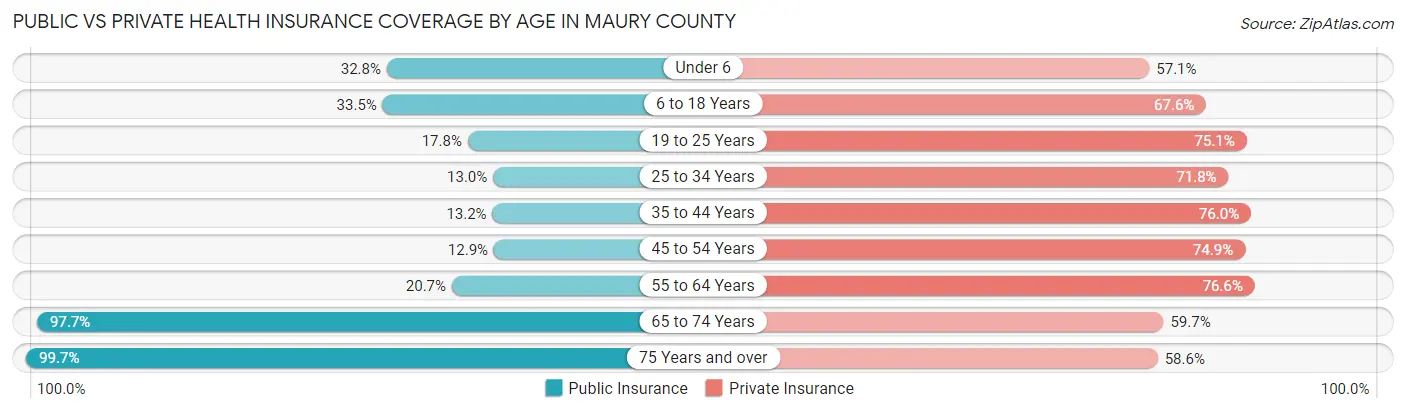
| Age Bracket | Public Insurance | Private Insurance |
| Under 6 | 2,377 (32.8%) | 4,141 (57.1%) |
| 6 to 18 Years | 5,729 (33.5%) | 11,550 (67.6%) |
| 19 to 25 Years | 1,515 (17.7%) | 6,415 (75.1%) |
| 25 to 34 Years | 1,583 (13.0%) | 8,710 (71.8%) |
| 35 to 44 Years | 1,799 (13.2%) | 10,383 (75.9%) |
| 45 to 54 Years | 1,565 (12.9%) | 9,090 (74.9%) |
| 55 to 64 Years | 2,842 (20.7%) | 10,521 (76.6%) |
| 65 to 74 Years | 10,184 (97.7%) | 6,224 (59.7%) |
| 75 Years and over | 6,005 (99.7%) | 3,531 (58.6%) |
| Total | 33,599 (33.3%) | 70,565 (69.9%) |
Disability Status by Sex by Age in Maury County
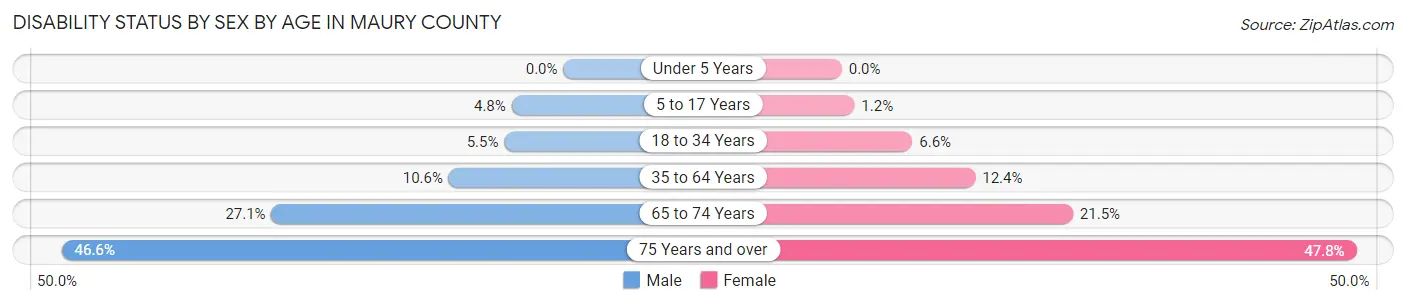
| Age Bracket | Male | Female |
| Under 5 Years | 0 (0.0%) | 0 (0.0%) |
| 5 to 17 Years | 422 (4.8%) | 95 (1.2%) |
| 18 to 34 Years | 586 (5.5%) | 715 (6.6%) |
| 35 to 64 Years | 2,044 (10.6%) | 2,516 (12.4%) |
| 65 to 74 Years | 1,317 (27.1%) | 1,193 (21.4%) |
| 75 Years and over | 1,192 (46.6%) | 1,653 (47.8%) |
Disability Class by Sex by Age in Maury County
Disability Class: Hearing Difficulty
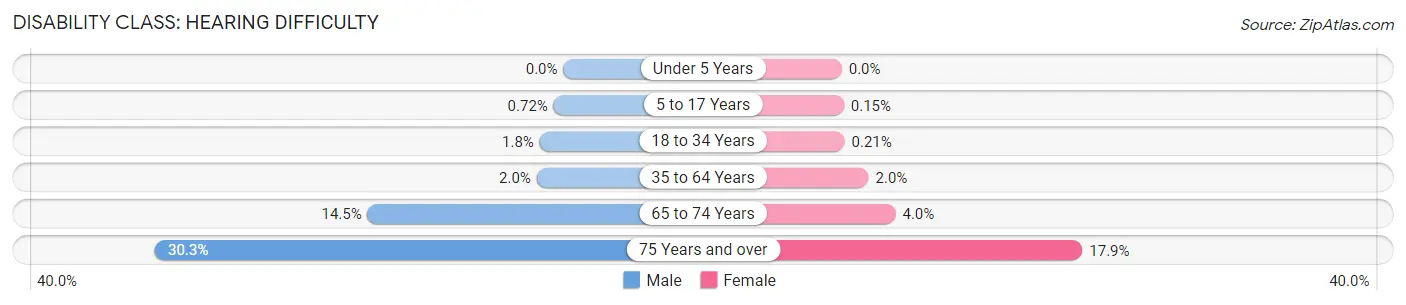
| Age Bracket | Male | Female |
| Under 5 Years | 0 (0.0%) | 0 (0.0%) |
| 5 to 17 Years | 63 (0.7%) | 12 (0.2%) |
| 18 to 34 Years | 188 (1.8%) | 23 (0.2%) |
| 35 to 64 Years | 380 (2.0%) | 404 (2.0%) |
| 65 to 74 Years | 707 (14.5%) | 222 (4.0%) |
| 75 Years and over | 776 (30.3%) | 618 (17.9%) |
Disability Class: Vision Difficulty
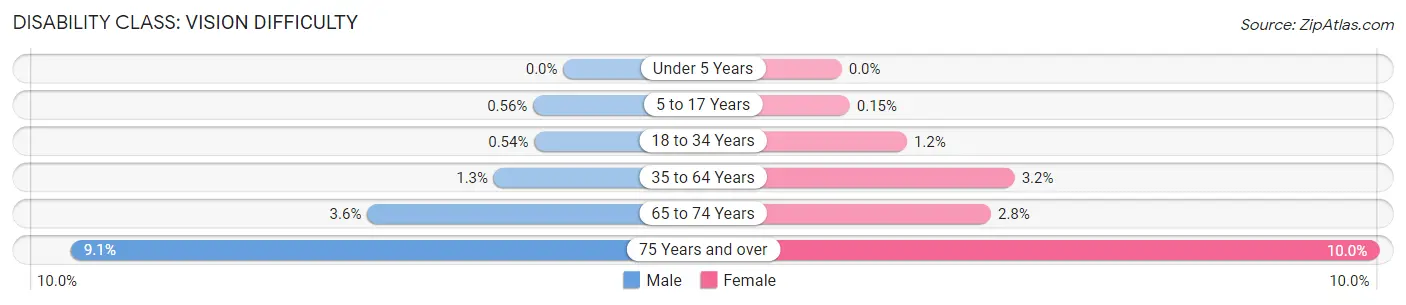
| Age Bracket | Male | Female |
| Under 5 Years | 0 (0.0%) | 0 (0.0%) |
| 5 to 17 Years | 49 (0.6%) | 12 (0.2%) |
| 18 to 34 Years | 58 (0.5%) | 132 (1.2%) |
| 35 to 64 Years | 248 (1.3%) | 653 (3.2%) |
| 65 to 74 Years | 177 (3.6%) | 154 (2.8%) |
| 75 Years and over | 234 (9.1%) | 345 (10.0%) |
Disability Class: Cognitive Difficulty
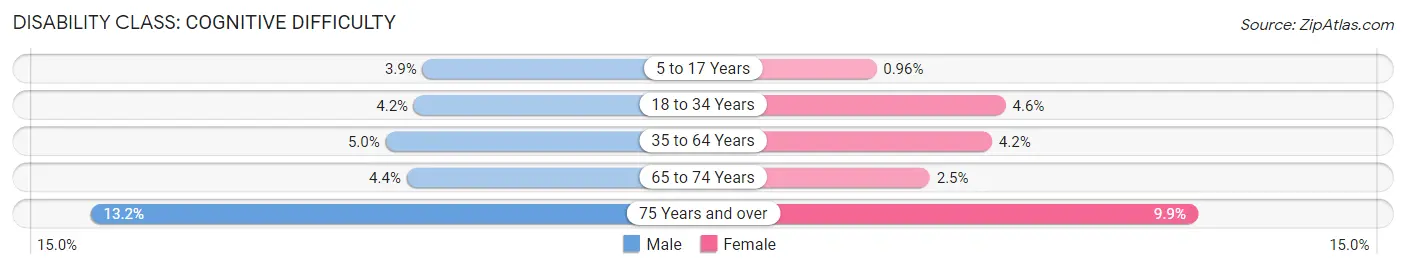
| Age Bracket | Male | Female |
| 5 to 17 Years | 345 (3.9%) | 78 (1.0%) |
| 18 to 34 Years | 445 (4.2%) | 498 (4.6%) |
| 35 to 64 Years | 951 (5.0%) | 849 (4.2%) |
| 65 to 74 Years | 212 (4.4%) | 136 (2.5%) |
| 75 Years and over | 337 (13.2%) | 343 (9.9%) |
Disability Class: Ambulatory Difficulty
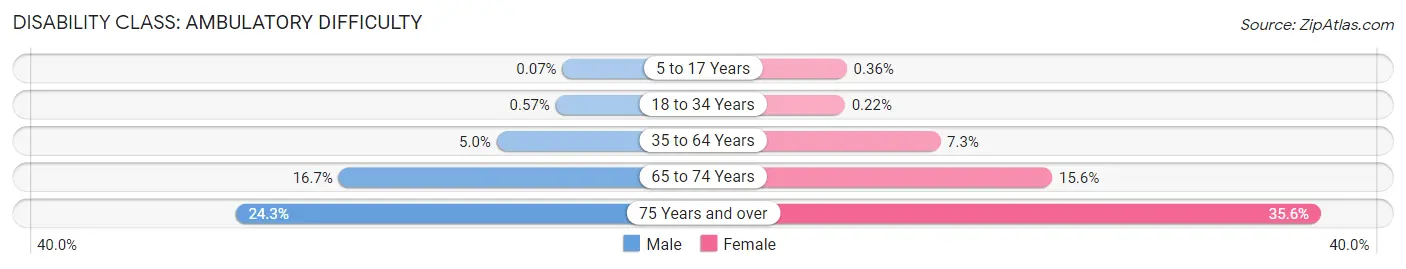
| Age Bracket | Male | Female |
| 5 to 17 Years | 6 (0.1%) | 29 (0.4%) |
| 18 to 34 Years | 61 (0.6%) | 24 (0.2%) |
| 35 to 64 Years | 952 (5.0%) | 1,482 (7.3%) |
| 65 to 74 Years | 811 (16.7%) | 868 (15.6%) |
| 75 Years and over | 623 (24.3%) | 1,231 (35.6%) |
Disability Class: Self-Care Difficulty
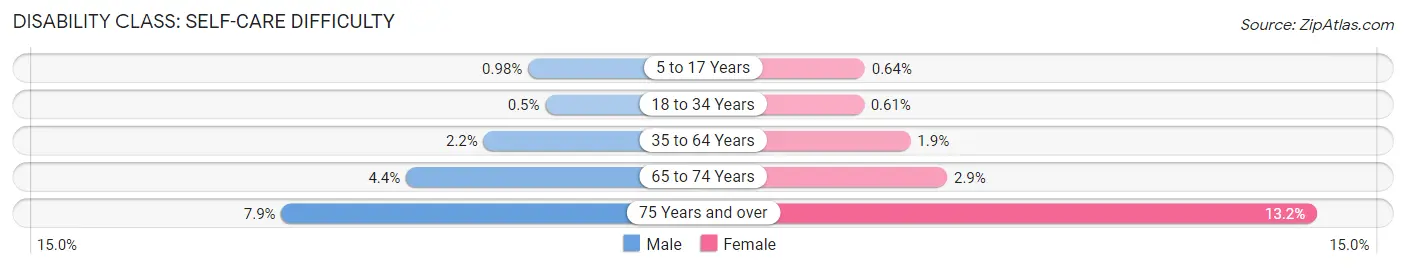
| Age Bracket | Male | Female |
| 5 to 17 Years | 86 (1.0%) | 52 (0.6%) |
| 18 to 34 Years | 53 (0.5%) | 67 (0.6%) |
| 35 to 64 Years | 426 (2.2%) | 387 (1.9%) |
| 65 to 74 Years | 213 (4.4%) | 163 (2.9%) |
| 75 Years and over | 201 (7.9%) | 458 (13.2%) |
Technology Access in Maury County
Computing Device Access in Maury County
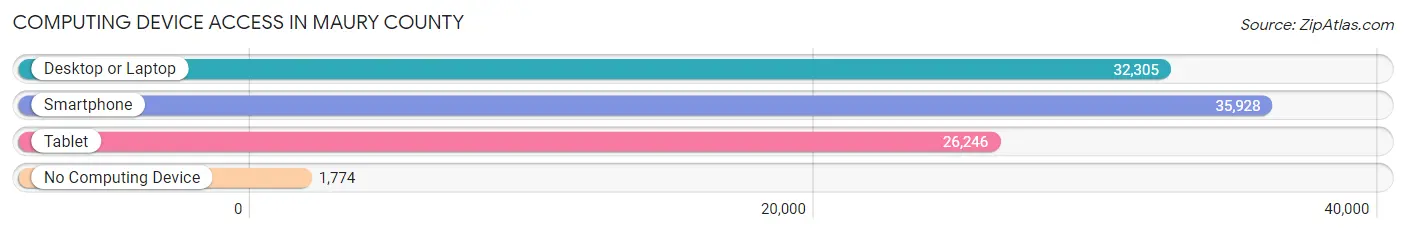
| Device Type | # Households | % Households |
| Desktop or Laptop | 32,305 | 81.6% |
| Smartphone | 35,928 | 90.7% |
| Tablet | 26,246 | 66.3% |
| No Computing Device | 1,774 | 4.5% |
| Total | 39,591 | 100.0% |
Internet Access in Maury County
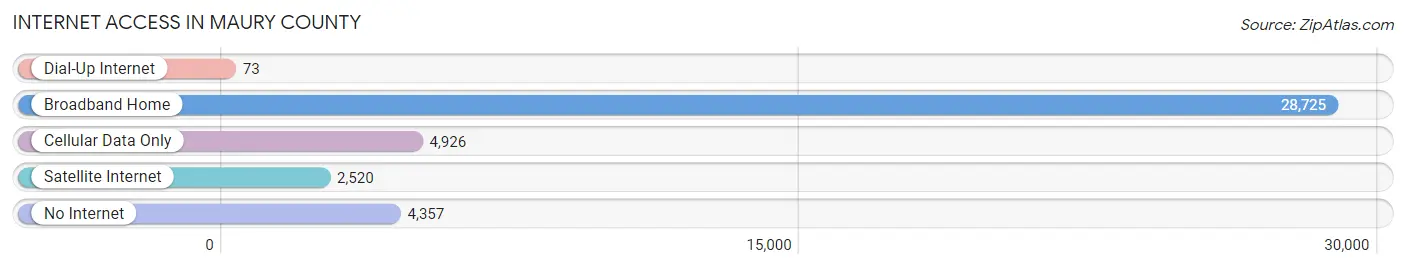
| Internet Type | # Households | % Households |
| Dial-Up Internet | 73 | 0.2% |
| Broadband Home | 28,725 | 72.6% |
| Cellular Data Only | 4,926 | 12.4% |
| Satellite Internet | 2,520 | 6.4% |
| No Internet | 4,357 | 11.0% |
| Total | 39,591 | 100.0% |
Maury County Summary
Maury County, Tennessee is located in the middle of the state, just south of Nashville. It is bordered by Williamson, Marshall, Giles, Lawrence, Hickman, and Lewis counties. The county seat is Columbia, and the county is named after Major Abram Poindexter Maury, a veteran of the War of 1812.
Geography
Maury County is located in the Middle Tennessee region of the state. It is mostly rural, with rolling hills and valleys. The Duck River runs through the county, and there are several small lakes and ponds. The county is home to several state parks, including Henry Horton State Park, Natchez Trace State Park, and Chickasaw State Park. The county is also home to several historic sites, including the James K. Polk Home and Museum, the Rippavilla Plantation, and the Columbia Athenaeum.
Demographics
As of the 2010 census, Maury County had a population of 80,956. The population is mostly white (86.2%), with African Americans making up 8.7% of the population. Other races make up the remaining 5.1%. The median household income is $45,837, and the median age is 38.7.
Economy
Maury County is home to several large employers, including General Motors, Bridgestone, and Columbia State Community College. The county is also home to several small businesses, including restaurants, retail stores, and service providers. Agriculture is also an important part of the economy, with corn, soybeans, and hay being the main crops.
History
Maury County was established in 1807, and was named after Major Abram Poindexter Maury, a veteran of the War of 1812. The county was originally part of Williamson County, and was later divided into Marshall and Maury counties. The county seat was originally located in Spring Hill, but was moved to Columbia in 1817.
During the Civil War, Maury County was a major site of conflict. The Battle of Spring Hill was fought in the county in November 1864, and the Battle of Franklin was fought in the county in November 1864. The county was also the site of the Columbia Athenaeum, a library and museum that was destroyed by Union troops in 1864.
In the late 19th and early 20th centuries, Maury County was home to several prominent figures, including President James K. Polk, who was born in the county in 1795. The county was also home to several prominent writers, including Pulitzer Prize-winning novelist James Agee and poet and novelist Robert Penn Warren.
Today, Maury County is a thriving community with a strong economy and a rich history. It is home to several state parks, historic sites, and museums, and is a popular destination for tourists and outdoor enthusiasts.
Common Questions
What is Per Capita Income in Maury County?
Per Capita income in Maury County is $35,733.
What is the Median Family Income in Maury County?
Median Family Income in Maury County is $83,154.
What is the Median Household income in Maury County?
Median Household Income in Maury County is $71,500.
What is Income or Wage Gap in Maury County?
Income or Wage Gap in Maury County is 26.0%.
Women in Maury County earn 74.0 cents for every dollar earned by a man.
What is Family Income Deficit in Maury County?
Family Income Deficit in Maury County is $8,929.
Families that are below poverty line in Maury County earn $8,929 less on average than the poverty threshold level.
What is Inequality or Gini Index in Maury County?
Inequality or Gini Index in Maury County is 0.42.
What is the Total Population of Maury County?
Total Population of Maury County is 102,002.
What is the Total Male Population of Maury County?
Total Male Population of Maury County is 49,972.
What is the Total Female Population of Maury County?
Total Female Population of Maury County is 52,030.
What is the Ratio of Males per 100 Females in Maury County?
There are 96.04 Males per 100 Females in Maury County.
What is the Ratio of Females per 100 Males in Maury County?
There are 104.12 Females per 100 Males in Maury County.
What is the Median Population Age in Maury County?
Median Population Age in Maury County is 39.4 Years.
What is the Average Family Size in Maury County
Average Family Size in Maury County is 3.0 People.
What is the Average Household Size in Maury County
Average Household Size in Maury County is 2.5 People.
How Large is the Labor Force in Maury County?
There are 52,031 People in the Labor Forcein in Maury County.
What is the Percentage of People in the Labor Force in Maury County?
64.0% of People are in the Labor Force in Maury County.
What is the Unemployment Rate in Maury County?
Unemployment Rate in Maury County is 2.5%.