Macon County, TN Map & Demographics
Macon County Map
Macon County Overview
$24,979
PER CAPITA INCOME
$67,944
AVG FAMILY INCOME
$51,215
AVG HOUSEHOLD INCOME
18.1%
WAGE / INCOME GAP [ % ]
81.9¢/ $1
WAGE / INCOME GAP [ $ ]
$11,605
FAMILY INCOME DEFICIT
0.42
INEQUALITY / GINI INDEX
25,365
TOTAL POPULATION
12,408
MALE POPULATION
12,957
FEMALE POPULATION
95.76
MALES / 100 FEMALES
104.42
FEMALES / 100 MALES
39.1
MEDIAN AGE
3.3
AVG FAMILY SIZE
2.7
AVG HOUSEHOLD SIZE
12,287
LABOR FORCE [ PEOPLE ]
61.7%
PERCENT IN LABOR FORCE
3.6%
UNEMPLOYMENT RATE
Income in Macon County
Income Overview in Macon County
Per Capita Income in Macon County is $24,979, while median incomes of families and households are $67,944 and $51,215 respectively.
| Characteristic | Number | Measure |
| Per Capita Income | 25,365 | $24,979 |
| Median Family Income | 6,315 | $67,944 |
| Mean Family Income | 6,315 | $78,505 |
| Median Household Income | 9,164 | $51,215 |
| Mean Household Income | 9,164 | $66,681 |
| Income Deficit | 6,315 | $11,605 |
| Wage / Income Gap (%) | 25,365 | 18.10% |
| Wage / Income Gap ($) | 25,365 | 81.90¢ per $1 |
| Gini / Inequality Index | 25,365 | 0.42 |
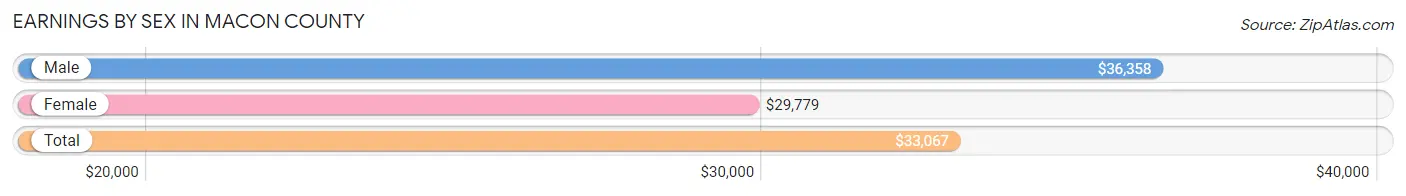
Earnings by Sex in Macon County
Average Earnings in Macon County are $33,067, $36,358 for men and $29,779 for women, a difference of 18.1%.
| Sex | Number | Average Earnings |
| Male | 6,884 (53.1%) | $36,358 |
| Female | 6,079 (46.9%) | $29,779 |
| Total | 12,963 (100.0%) | $33,067 |
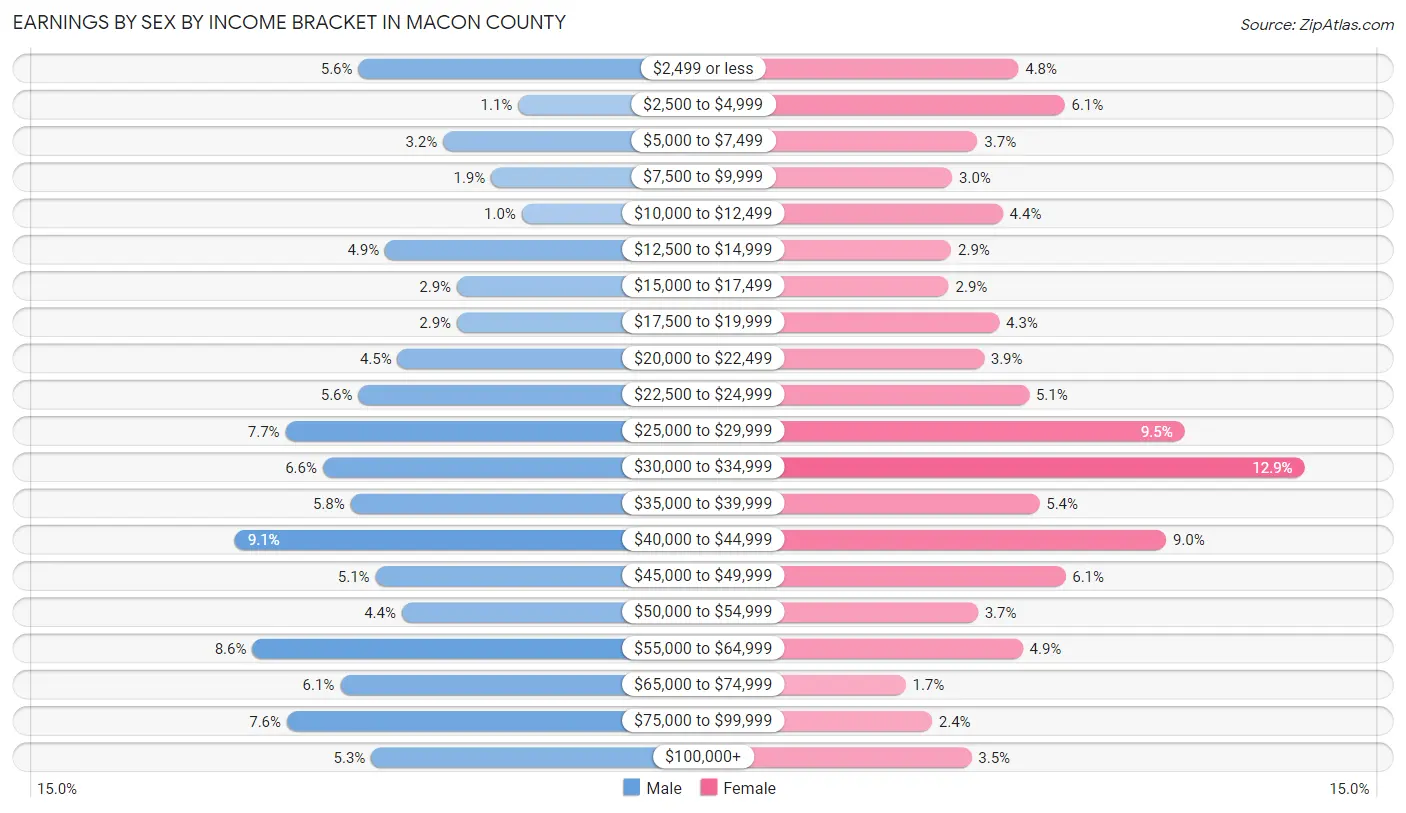
Earnings by Sex by Income Bracket in Macon County
The most common earnings brackets in Macon County are $40,000 to $44,999 for men (626 | 9.1%) and $30,000 to $34,999 for women (782 | 12.9%).
| Income | Male | Female |
| $2,499 or less | 387 (5.6%) | 293 (4.8%) |
| $2,500 to $4,999 | 78 (1.1%) | 372 (6.1%) |
| $5,000 to $7,499 | 223 (3.2%) | 223 (3.7%) |
| $7,500 to $9,999 | 130 (1.9%) | 180 (3.0%) |
| $10,000 to $12,499 | 71 (1.0%) | 266 (4.4%) |
| $12,500 to $14,999 | 335 (4.9%) | 178 (2.9%) |
| $15,000 to $17,499 | 196 (2.9%) | 174 (2.9%) |
| $17,500 to $19,999 | 196 (2.9%) | 260 (4.3%) |
| $20,000 to $22,499 | 311 (4.5%) | 234 (3.8%) |
| $22,500 to $24,999 | 387 (5.6%) | 311 (5.1%) |
| $25,000 to $29,999 | 528 (7.7%) | 577 (9.5%) |
| $30,000 to $34,999 | 456 (6.6%) | 782 (12.9%) |
| $35,000 to $39,999 | 402 (5.8%) | 329 (5.4%) |
| $40,000 to $44,999 | 626 (9.1%) | 545 (9.0%) |
| $45,000 to $49,999 | 354 (5.1%) | 373 (6.1%) |
| $50,000 to $54,999 | 303 (4.4%) | 224 (3.7%) |
| $55,000 to $64,999 | 592 (8.6%) | 300 (4.9%) |
| $65,000 to $74,999 | 422 (6.1%) | 100 (1.7%) |
| $75,000 to $99,999 | 525 (7.6%) | 145 (2.4%) |
| $100,000+ | 362 (5.3%) | 213 (3.5%) |
| Total | 6,884 (100.0%) | 6,079 (100.0%) |
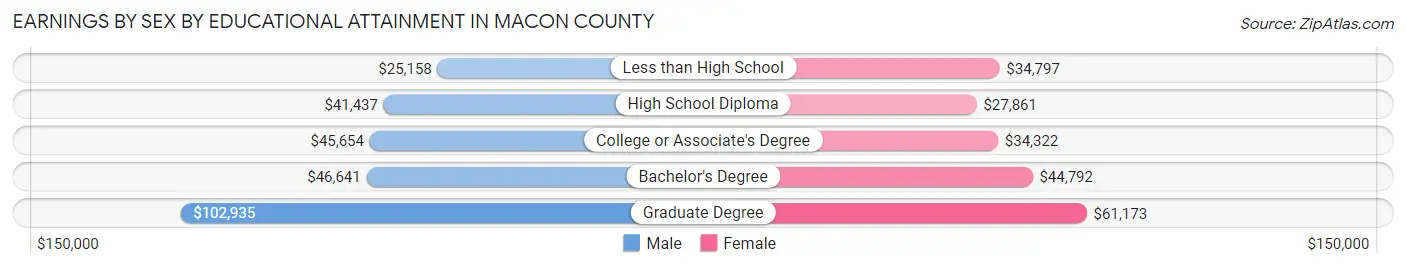
Earnings by Sex by Educational Attainment in Macon County
Average earnings in Macon County are $41,070 for men and $33,565 for women, a difference of 18.3%. Men with an educational attainment of graduate degree enjoy the highest average annual earnings of $102,935, while those with less than high school education earn the least with $25,158. Women with an educational attainment of graduate degree earn the most with the average annual earnings of $61,173, while those with high school diploma education have the smallest earnings of $27,861.
| Educational Attainment | Male Income | Female Income |
| Less than High School | $25,158 | $34,797 |
| High School Diploma | $41,437 | $27,861 |
| College or Associate's Degree | $45,654 | $34,322 |
| Bachelor's Degree | $46,641 | $44,792 |
| Graduate Degree | $102,935 | $61,173 |
| Total | $41,070 | $33,565 |
Family Income in Macon County
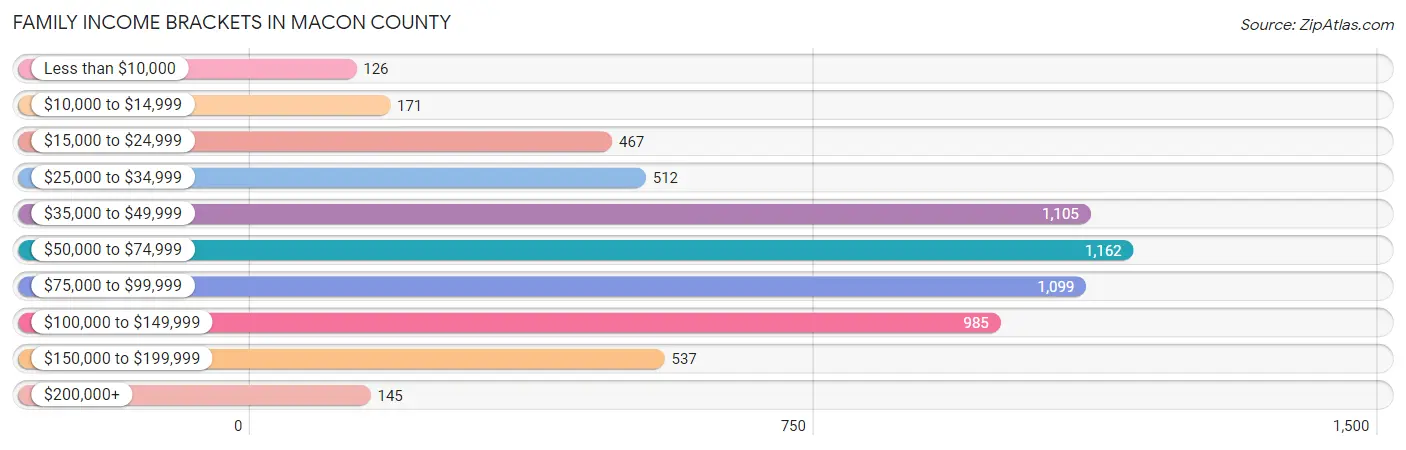
Family Income Brackets in Macon County
According to the Macon County family income data, there are 1,162 families falling into the $50,000 to $74,999 income range, which is the most common income bracket and makes up 18.4% of all families. Conversely, the less than $10,000 income bracket is the least frequent group with only 126 families (2.0%) belonging to this category.
| Income Bracket | # Families | % Families |
| Less than $10,000 | 126 | 2.0% |
| $10,000 to $14,999 | 171 | 2.7% |
| $15,000 to $24,999 | 467 | 7.4% |
| $25,000 to $34,999 | 512 | 8.1% |
| $35,000 to $49,999 | 1,105 | 17.5% |
| $50,000 to $74,999 | 1,162 | 18.4% |
| $75,000 to $99,999 | 1,099 | 17.4% |
| $100,000 to $149,999 | 985 | 15.6% |
| $150,000 to $199,999 | 537 | 8.5% |
| $200,000+ | 145 | 2.3% |
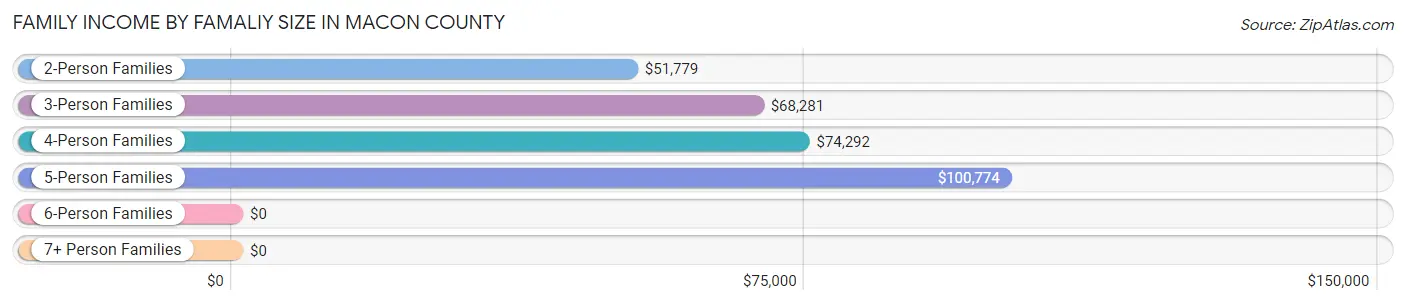
Family Income by Famaliy Size in Macon County
5-person families (575 | 9.1%) account for the highest median family income in Macon County with $100,774 per family, while 2-person families (2,956 | 46.8%) have the highest median income of $25,890 per family member.
| Income Bracket | # Families | Median Income |
| 2-Person Families | 2,956 (46.8%) | $51,779 |
| 3-Person Families | 1,458 (23.1%) | $68,281 |
| 4-Person Families | 1,037 (16.4%) | $74,292 |
| 5-Person Families | 575 (9.1%) | $100,774 |
| 6-Person Families | 228 (3.6%) | $0 |
| 7+ Person Families | 61 (1.0%) | $0 |
| Total | 6,315 (100.0%) | $67,944 |
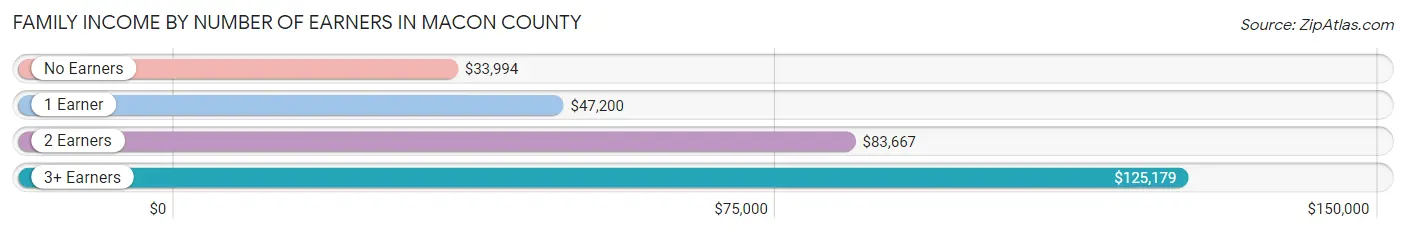
Family Income by Number of Earners in Macon County
The median family income in Macon County is $67,944, with families comprising 3+ earners (681) having the highest median family income of $125,179, while families with no earners (1,138) have the lowest median family income of $33,994, accounting for 10.8% and 18.0% of families, respectively.
| Number of Earners | # Families | Median Income |
| No Earners | 1,138 (18.0%) | $33,994 |
| 1 Earner | 1,588 (25.2%) | $47,200 |
| 2 Earners | 2,908 (46.1%) | $83,667 |
| 3+ Earners | 681 (10.8%) | $125,179 |
| Total | 6,315 (100.0%) | $67,944 |
Household Income in Macon County
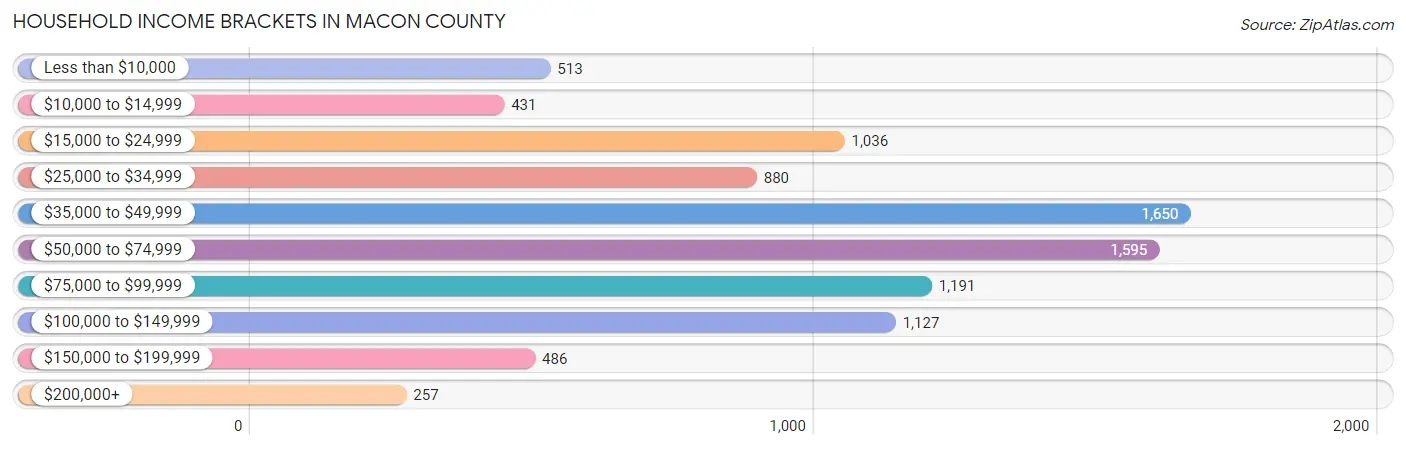
Household Income Brackets in Macon County
With 1,650 households falling in the category, the $35,000 to $49,999 income range is the most frequent in Macon County, accounting for 18.0% of all households. In contrast, only 257 households (2.8%) fall into the $200,000+ income bracket, making it the least populous group.
| Income Bracket | # Households | % Households |
| Less than $10,000 | 513 | 5.6% |
| $10,000 to $14,999 | 431 | 4.7% |
| $15,000 to $24,999 | 1,036 | 11.3% |
| $25,000 to $34,999 | 880 | 9.6% |
| $35,000 to $49,999 | 1,650 | 18.0% |
| $50,000 to $74,999 | 1,595 | 17.4% |
| $75,000 to $99,999 | 1,191 | 13.0% |
| $100,000 to $149,999 | 1,127 | 12.3% |
| $150,000 to $199,999 | 486 | 5.3% |
| $200,000+ | 257 | 2.8% |
Household Income by Householder Age in Macon County
The median household income in Macon County is $51,215, with the highest median household income of $72,321 found in the 25 to 44 years age bracket for the primary householder. A total of 2,758 households (30.1%) fall into this category. Meanwhile, the 65+ years age bracket for the primary householder has the lowest median household income of $40,447, with 2,317 households (25.3%) in this group.
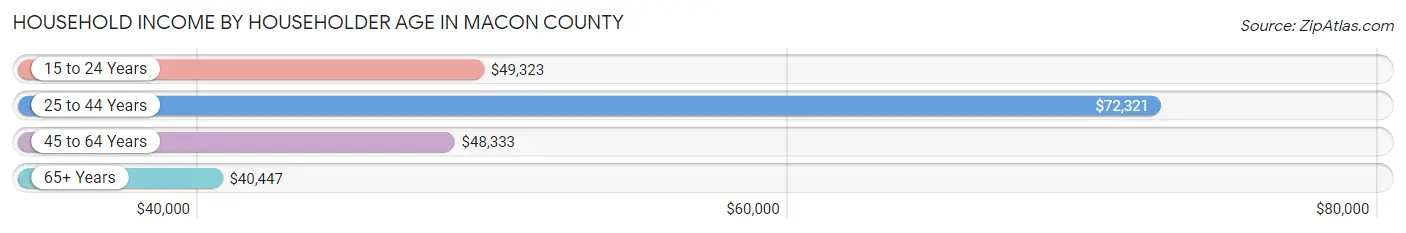
| Income Bracket | # Households | Median Income |
| 15 to 24 Years | 329 (3.6%) | $49,323 |
| 25 to 44 Years | 2,758 (30.1%) | $72,321 |
| 45 to 64 Years | 3,760 (41.0%) | $48,333 |
| 65+ Years | 2,317 (25.3%) | $40,447 |
| Total | 9,164 (100.0%) | $51,215 |
Poverty in Macon County
Income Below Poverty by Sex and Age in Macon County
With 14.6% poverty level for males and 18.3% for females among the residents of Macon County, 15 year old males and 15 year old females are the most vulnerable to poverty, with 16 males (27.6%) and 45 females (39.8%) in their respective age groups living below the poverty level.
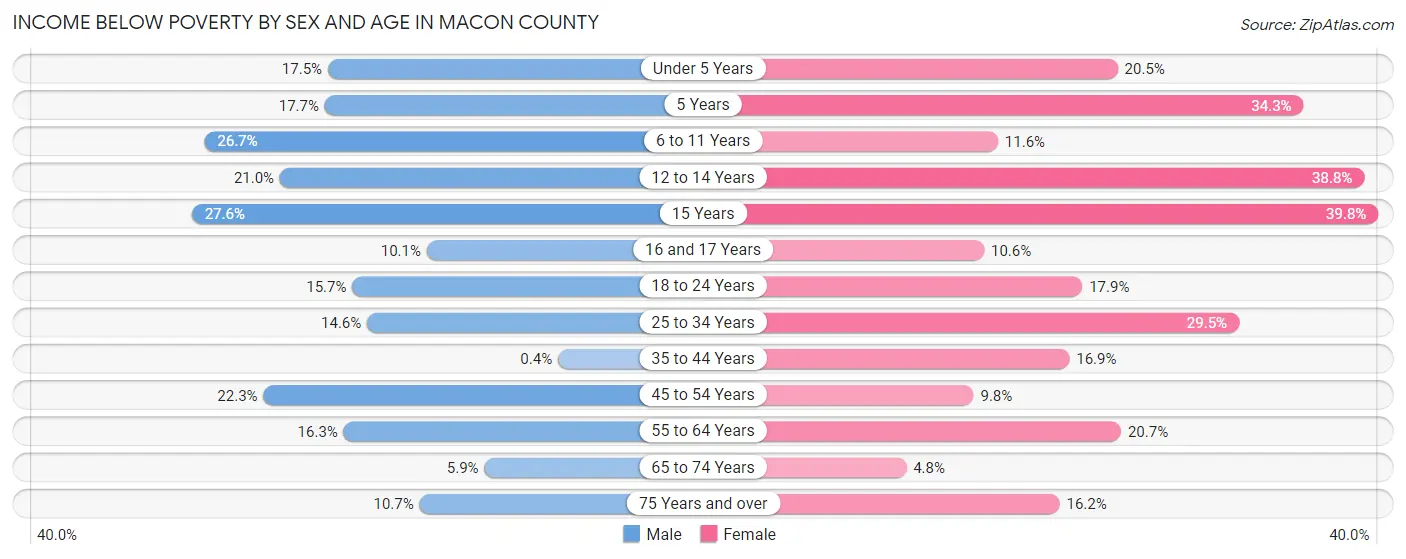
| Age Bracket | Male | Female |
| Under 5 Years | 129 (17.5%) | 162 (20.5%) |
| 5 Years | 48 (17.7%) | 73 (34.3%) |
| 6 to 11 Years | 246 (26.7%) | 119 (11.6%) |
| 12 to 14 Years | 126 (21.0%) | 254 (38.8%) |
| 15 Years | 16 (27.6%) | 45 (39.8%) |
| 16 and 17 Years | 42 (10.1%) | 38 (10.6%) |
| 18 to 24 Years | 180 (15.7%) | 194 (17.8%) |
| 25 to 34 Years | 217 (14.6%) | 518 (29.5%) |
| 35 to 44 Years | 6 (0.4%) | 241 (16.9%) |
| 45 to 54 Years | 357 (22.3%) | 157 (9.8%) |
| 55 to 64 Years | 275 (16.3%) | 347 (20.7%) |
| 65 to 74 Years | 67 (5.9%) | 59 (4.8%) |
| 75 Years and over | 60 (10.7%) | 147 (16.2%) |
| Total | 1,769 (14.6%) | 2,354 (18.3%) |
Income Above Poverty by Sex and Age in Macon County
According to the poverty statistics in Macon County, males aged 35 to 44 years and females aged 65 to 74 years are the age groups that are most secure financially, with 99.6% of males and 95.2% of females in these age groups living above the poverty line.
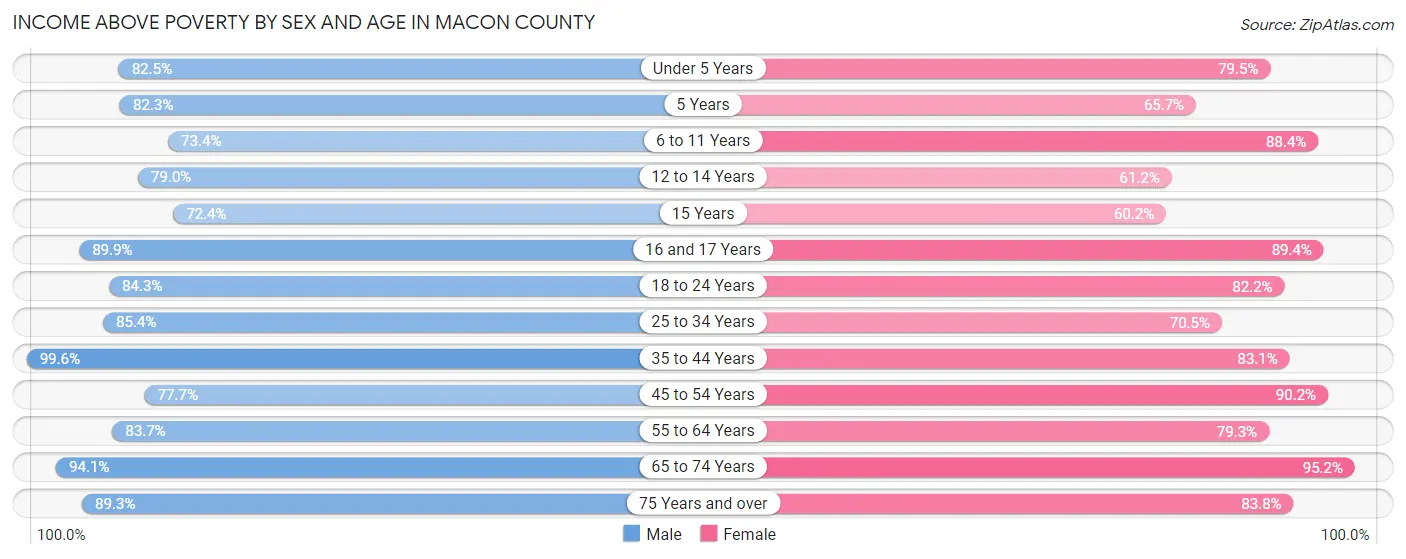
| Age Bracket | Male | Female |
| Under 5 Years | 609 (82.5%) | 629 (79.5%) |
| 5 Years | 223 (82.3%) | 140 (65.7%) |
| 6 to 11 Years | 677 (73.4%) | 908 (88.4%) |
| 12 to 14 Years | 473 (79.0%) | 401 (61.2%) |
| 15 Years | 42 (72.4%) | 68 (60.2%) |
| 16 and 17 Years | 372 (89.9%) | 322 (89.4%) |
| 18 to 24 Years | 969 (84.3%) | 893 (82.2%) |
| 25 to 34 Years | 1,272 (85.4%) | 1,239 (70.5%) |
| 35 to 44 Years | 1,485 (99.6%) | 1,186 (83.1%) |
| 45 to 54 Years | 1,246 (77.7%) | 1,448 (90.2%) |
| 55 to 64 Years | 1,411 (83.7%) | 1,327 (79.3%) |
| 65 to 74 Years | 1,077 (94.1%) | 1,175 (95.2%) |
| 75 Years and over | 502 (89.3%) | 762 (83.8%) |
| Total | 10,358 (85.4%) | 10,498 (81.7%) |
Income Below Poverty Among Married-Couple Families in Macon County
The poverty statistics for married-couple families in Macon County show that 4.5% or 221 of the total 4,874 families live below the poverty line. Families with 3 or 4 children have the highest poverty rate of 21.6%, comprising of 92 families. On the other hand, families with 5 or more children have the lowest poverty rate of 0.0%, which includes 0 families.
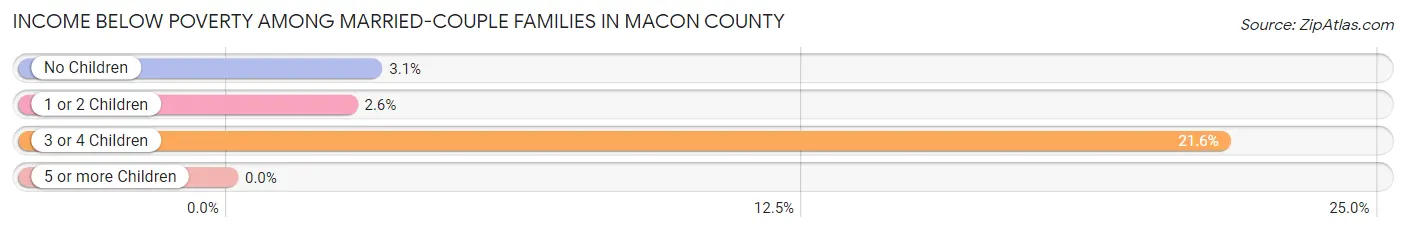
| Children | Above Poverty | Below Poverty |
| No Children | 2,562 (96.9%) | 83 (3.1%) |
| 1 or 2 Children | 1,720 (97.4%) | 46 (2.6%) |
| 3 or 4 Children | 334 (78.4%) | 92 (21.6%) |
| 5 or more Children | 37 (100.0%) | 0 (0.0%) |
| Total | 4,653 (95.5%) | 221 (4.5%) |
Income Below Poverty Among Single-Parent Households in Macon County
According to the poverty data in Macon County, 24.8% or 136 single-father households and 31.3% or 279 single-mother households are living below the poverty line. Among single-father households, those with 1 or 2 children have the highest poverty rate, with 110 households (47.6%) experiencing poverty. Likewise, among single-mother households, those with 3 or 4 children have the highest poverty rate, with 90 households (100.0%) falling below the poverty line.
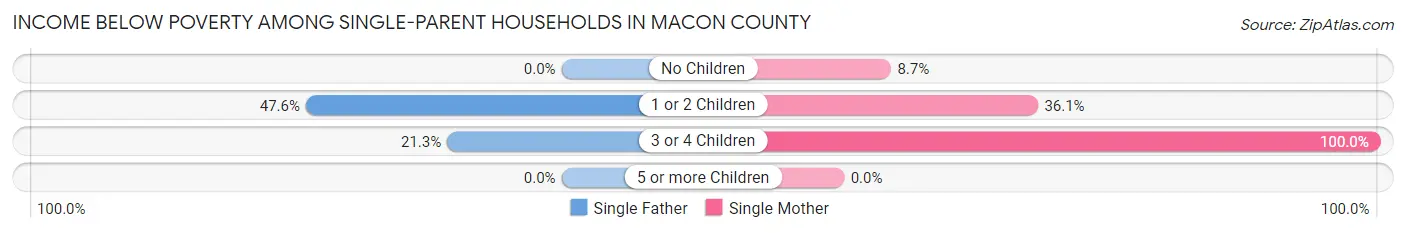
| Children | Single Father | Single Mother |
| No Children | 0 (0.0%) | 32 (8.7%) |
| 1 or 2 Children | 110 (47.6%) | 157 (36.1%) |
| 3 or 4 Children | 26 (21.3%) | 90 (100.0%) |
| 5 or more Children | 0 (0.0%) | 0 (0.0%) |
| Total | 136 (24.8%) | 279 (31.3%) |
Income Below Poverty Among Married-Couple vs Single-Parent Households in Macon County
The poverty data for Macon County shows that 221 of the married-couple family households (4.5%) and 415 of the single-parent households (28.8%) are living below the poverty level. Within the married-couple family households, those with 3 or 4 children have the highest poverty rate, with 92 households (21.6%) falling below the poverty line. Among the single-parent households, those with 3 or 4 children have the highest poverty rate, with 116 household (54.7%) living below poverty.
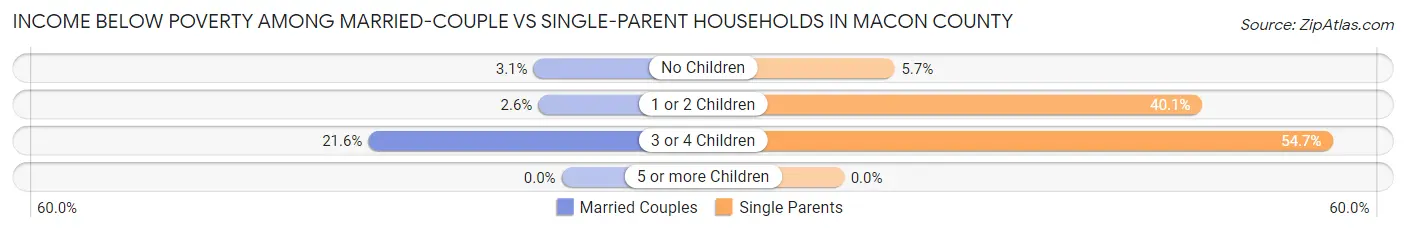
| Children | Married-Couple Families | Single-Parent Households |
| No Children | 83 (3.1%) | 32 (5.7%) |
| 1 or 2 Children | 46 (2.6%) | 267 (40.1%) |
| 3 or 4 Children | 92 (21.6%) | 116 (54.7%) |
| 5 or more Children | 0 (0.0%) | 0 (0.0%) |
| Total | 221 (4.5%) | 415 (28.8%) |
Race in Macon County
The most populous races in Macon County are White / Caucasian (23,262 | 91.7%), Two or more Races (1,445 | 5.7%), and Hispanic or Latino (1,352 | 5.3%).
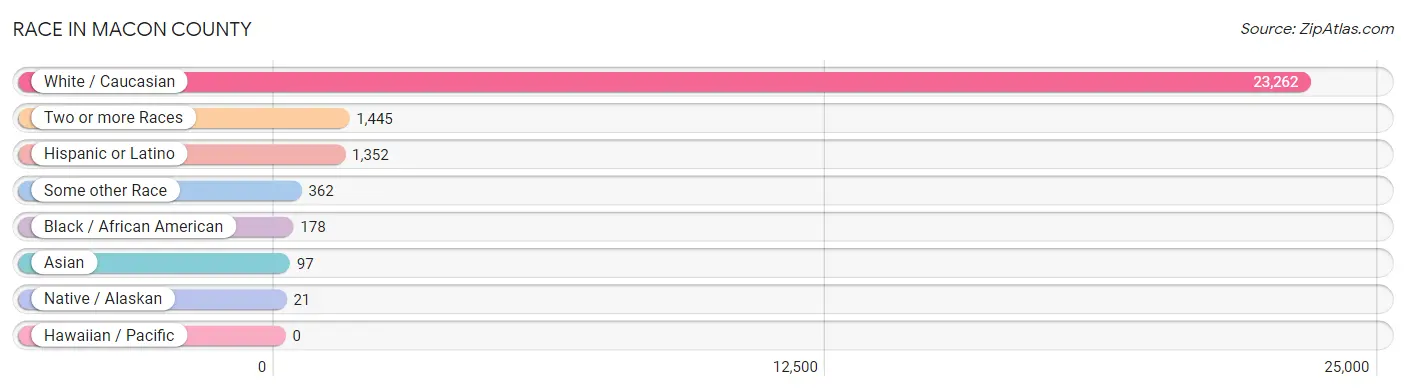
| Race | # Population | % Population |
| Asian | 97 | 0.4% |
| Black / African American | 178 | 0.7% |
| Hawaiian / Pacific | 0 | 0.0% |
| Hispanic or Latino | 1,352 | 5.3% |
| Native / Alaskan | 21 | 0.1% |
| White / Caucasian | 23,262 | 91.7% |
| Two or more Races | 1,445 | 5.7% |
| Some other Race | 362 | 1.4% |
| Total | 25,365 | 100.0% |
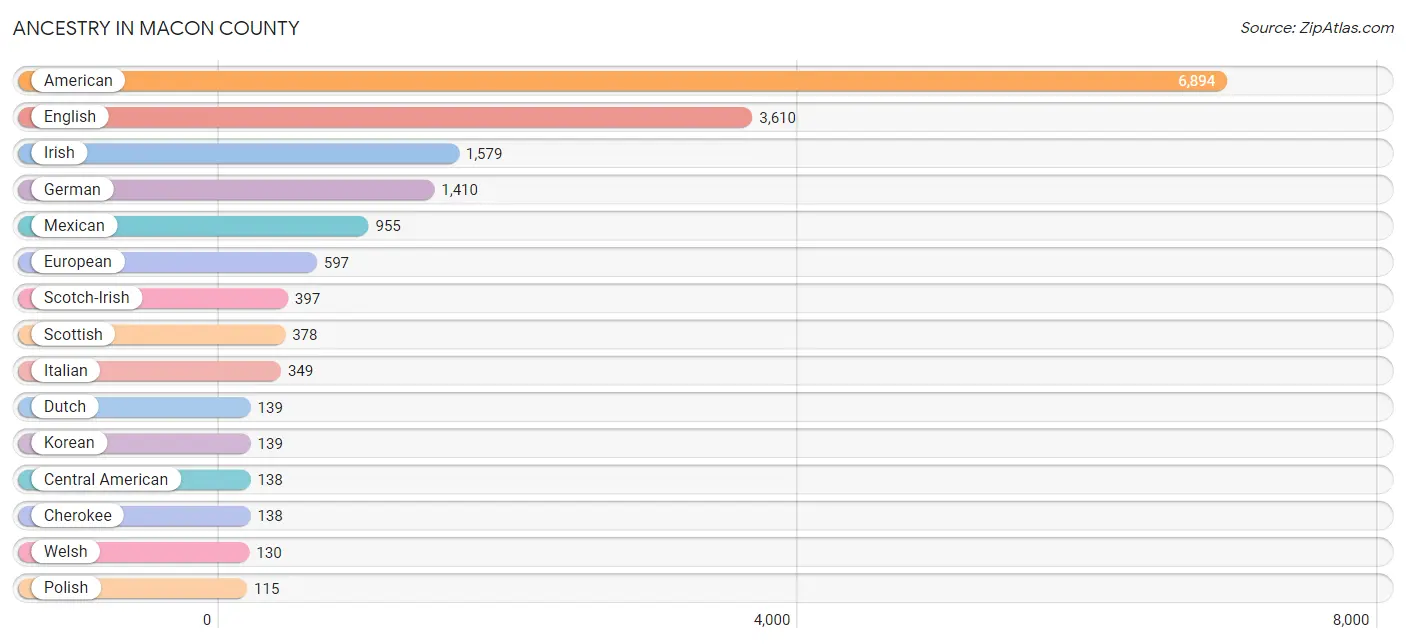
Ancestry in Macon County
The most populous ancestries reported in Macon County are American (6,894 | 27.2%), English (3,610 | 14.2%), Irish (1,579 | 6.2%), German (1,410 | 5.6%), and Mexican (955 | 3.8%), together accounting for 57.0% of all Macon County residents.
| Ancestry | # Population | % Population |
| American | 6,894 | 27.2% |
| Australian | 14 | 0.1% |
| Austrian | 15 | 0.1% |
| Blackfeet | 13 | 0.1% |
| British | 47 | 0.2% |
| Burmese | 28 | 0.1% |
| Canadian | 20 | 0.1% |
| Central American | 138 | 0.5% |
| Cherokee | 138 | 0.5% |
| Chippewa | 2 | 0.0% |
| Colombian | 86 | 0.3% |
| Cuban | 78 | 0.3% |
| Czech | 37 | 0.2% |
| Dutch | 139 | 0.5% |
| English | 3,610 | 14.2% |
| European | 597 | 2.4% |
| French | 94 | 0.4% |
| German | 1,410 | 5.6% |
| Greek | 42 | 0.2% |
| Guatemalan | 94 | 0.4% |
| Honduran | 6 | 0.0% |
| Irish | 1,579 | 6.2% |
| Italian | 349 | 1.4% |
| Korean | 139 | 0.5% |
| Lithuanian | 14 | 0.1% |
| Maltese | 12 | 0.1% |
| Mexican | 955 | 3.8% |
| Native Hawaiian | 14 | 0.1% |
| Nigerian | 9 | 0.0% |
| Norwegian | 7 | 0.0% |
| Pennsylvania German | 14 | 0.1% |
| Polish | 115 | 0.4% |
| Portuguese | 16 | 0.1% |
| Puerto Rican | 80 | 0.3% |
| Romanian | 19 | 0.1% |
| Russian | 53 | 0.2% |
| Salvadoran | 38 | 0.2% |
| Scotch-Irish | 397 | 1.6% |
| Scottish | 378 | 1.5% |
| Sioux | 21 | 0.1% |
| South American | 86 | 0.3% |
| Subsaharan African | 9 | 0.0% |
| Swiss | 32 | 0.1% |
| Ukrainian | 12 | 0.1% |
| Welsh | 130 | 0.5% | View All 45 Rows |
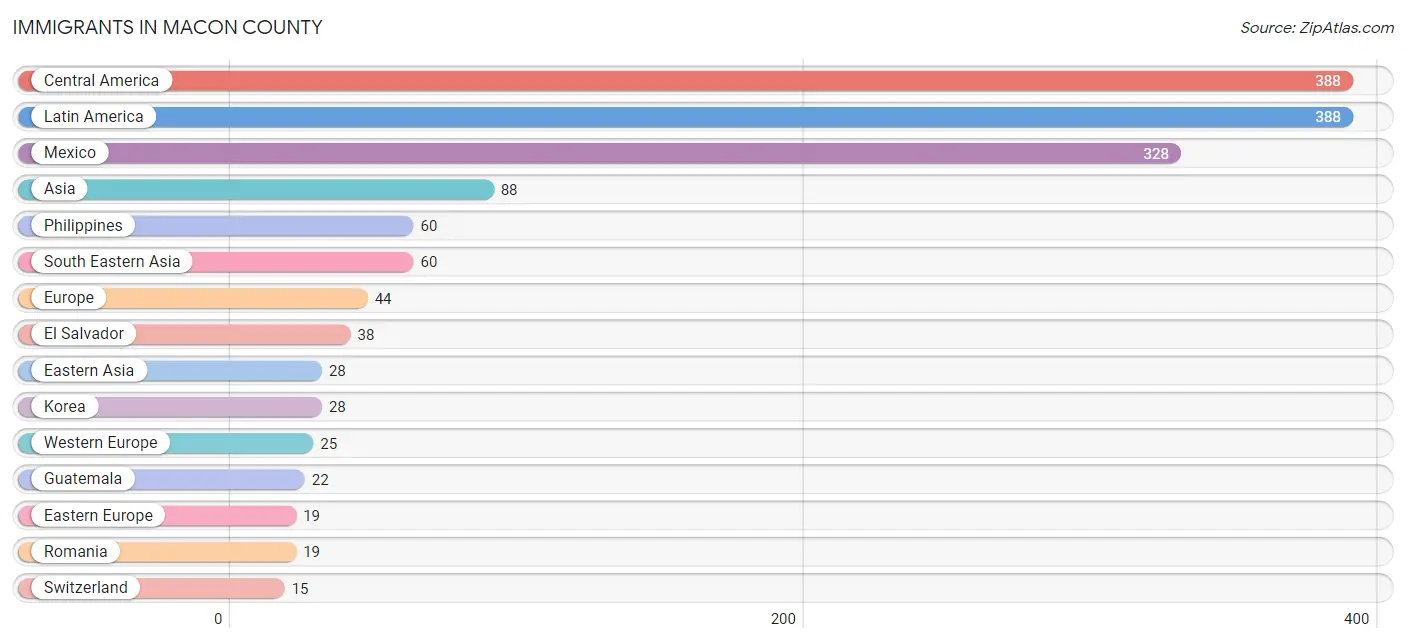
Immigrants in Macon County
The most numerous immigrant groups reported in Macon County came from Central America (388 | 1.5%), Latin America (388 | 1.5%), Mexico (328 | 1.3%), Asia (88 | 0.4%), and Philippines (60 | 0.2%), together accounting for 4.9% of all Macon County residents.
| Immigration Origin | # Population | % Population |
| Asia | 88 | 0.4% |
| Central America | 388 | 1.5% |
| Eastern Asia | 28 | 0.1% |
| Eastern Europe | 19 | 0.1% |
| El Salvador | 38 | 0.2% |
| Europe | 44 | 0.2% |
| Germany | 10 | 0.0% |
| Guatemala | 22 | 0.1% |
| Korea | 28 | 0.1% |
| Latin America | 388 | 1.5% |
| Mexico | 328 | 1.3% |
| Philippines | 60 | 0.2% |
| Romania | 19 | 0.1% |
| South Eastern Asia | 60 | 0.2% |
| Switzerland | 15 | 0.1% |
| Western Europe | 25 | 0.1% | View All 16 Rows |
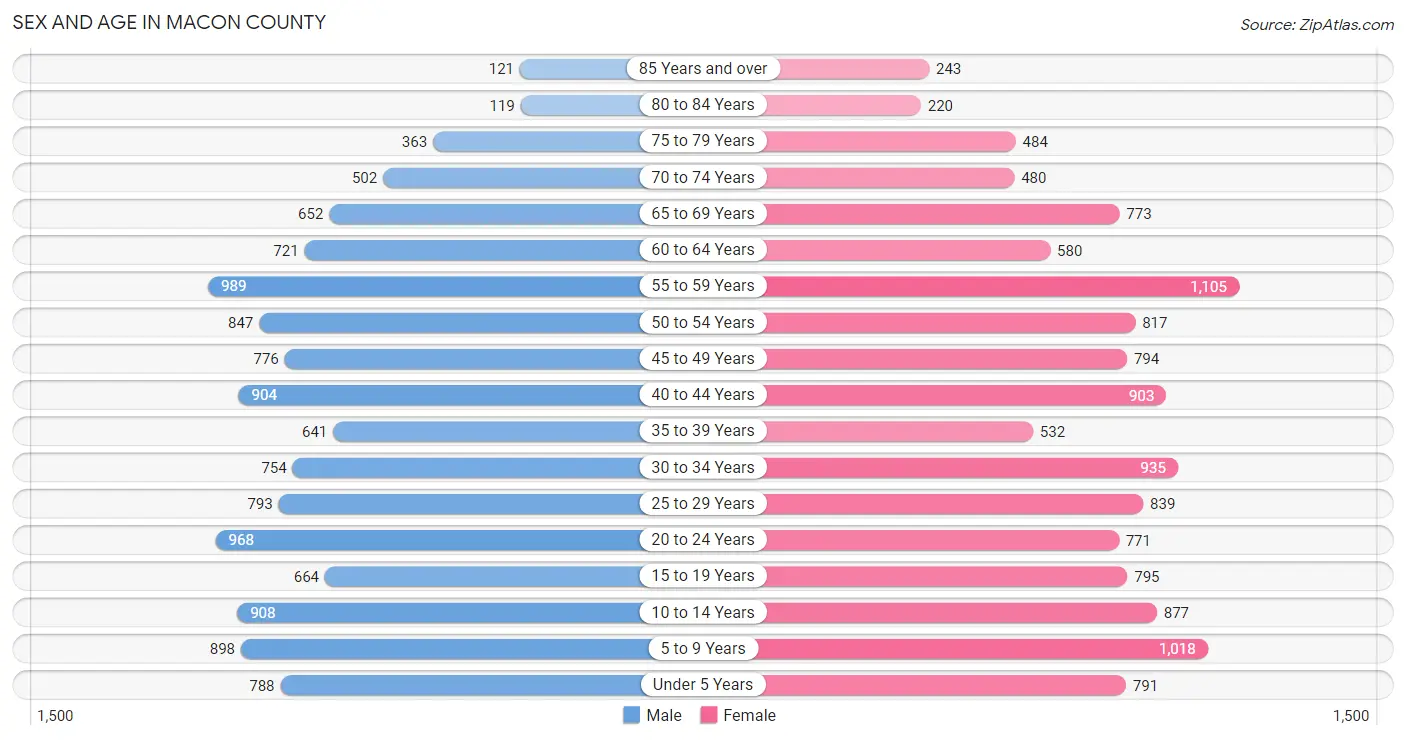
Sex and Age in Macon County
Sex and Age in Macon County
The most populous age groups in Macon County are 55 to 59 Years (989 | 8.0%) for men and 55 to 59 Years (1,105 | 8.5%) for women.
| Age Bracket | Male | Female |
| Under 5 Years | 788 (6.4%) | 791 (6.1%) |
| 5 to 9 Years | 898 (7.2%) | 1,018 (7.9%) |
| 10 to 14 Years | 908 (7.3%) | 877 (6.8%) |
| 15 to 19 Years | 664 (5.3%) | 795 (6.1%) |
| 20 to 24 Years | 968 (7.8%) | 771 (5.9%) |
| 25 to 29 Years | 793 (6.4%) | 839 (6.5%) |
| 30 to 34 Years | 754 (6.1%) | 935 (7.2%) |
| 35 to 39 Years | 641 (5.2%) | 532 (4.1%) |
| 40 to 44 Years | 904 (7.3%) | 903 (7.0%) |
| 45 to 49 Years | 776 (6.2%) | 794 (6.1%) |
| 50 to 54 Years | 847 (6.8%) | 817 (6.3%) |
| 55 to 59 Years | 989 (8.0%) | 1,105 (8.5%) |
| 60 to 64 Years | 721 (5.8%) | 580 (4.5%) |
| 65 to 69 Years | 652 (5.2%) | 773 (6.0%) |
| 70 to 74 Years | 502 (4.1%) | 480 (3.7%) |
| 75 to 79 Years | 363 (2.9%) | 484 (3.7%) |
| 80 to 84 Years | 119 (1.0%) | 220 (1.7%) |
| 85 Years and over | 121 (1.0%) | 243 (1.9%) |
| Total | 12,408 (100.0%) | 12,957 (100.0%) |
Families and Households in Macon County
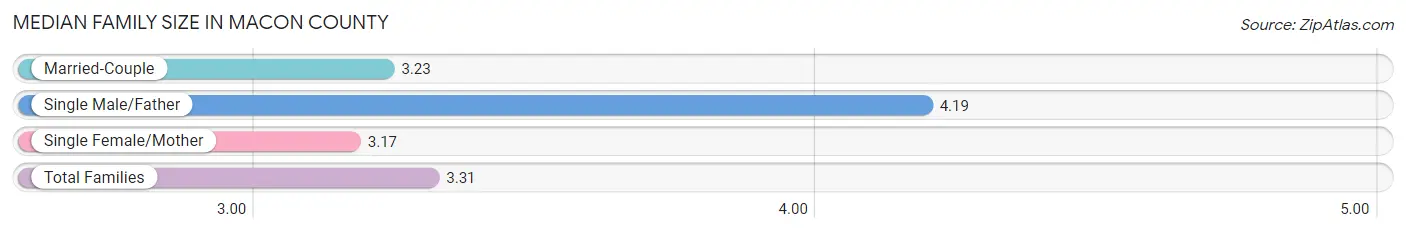
Median Family Size in Macon County
The median family size in Macon County is 3.31 persons per family, with single male/father families (549 | 8.7%) accounting for the largest median family size of 4.19 persons per family. On the other hand, single female/mother families (892 | 14.1%) represent the smallest median family size with 3.17 persons per family.
| Family Type | # Families | Family Size |
| Married-Couple | 4,874 (77.2%) | 3.23 |
| Single Male/Father | 549 (8.7%) | 4.19 |
| Single Female/Mother | 892 (14.1%) | 3.17 |
| Total Families | 6,315 (100.0%) | 3.31 |
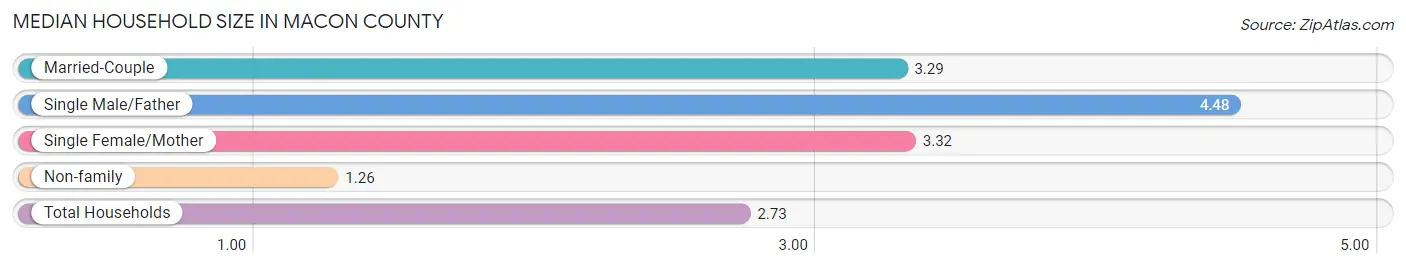
Median Household Size in Macon County
The median household size in Macon County is 2.73 persons per household, with single male/father households (549 | 6.0%) accounting for the largest median household size of 4.48 persons per household. non-family households (2,849 | 31.1%) represent the smallest median household size with 1.26 persons per household.
| Household Type | # Households | Household Size |
| Married-Couple | 4,874 (53.2%) | 3.29 |
| Single Male/Father | 549 (6.0%) | 4.48 |
| Single Female/Mother | 892 (9.7%) | 3.32 |
| Non-family | 2,849 (31.1%) | 1.26 |
| Total Households | 9,164 (100.0%) | 2.73 |
Household Size by Marriage Status in Macon County
Out of a total of 9,164 households in Macon County, 6,315 (68.9%) are family households, while 2,849 (31.1%) are nonfamily households. The most numerous type of family households are 2-person households, comprising 2,752, and the most common type of nonfamily households are 1-person households, comprising 2,429.
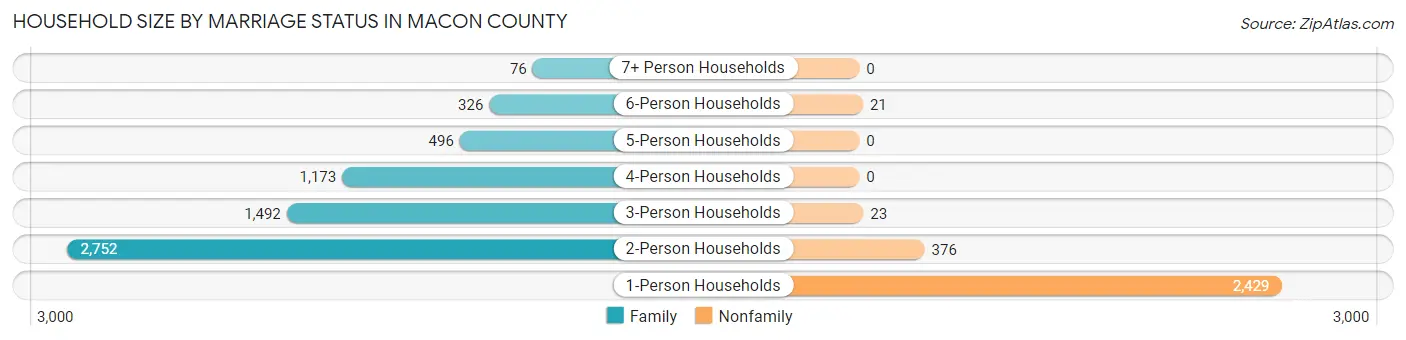
| Household Size | Family Households | Nonfamily Households |
| 1-Person Households | - | 2,429 (26.5%) |
| 2-Person Households | 2,752 (30.0%) | 376 (4.1%) |
| 3-Person Households | 1,492 (16.3%) | 23 (0.3%) |
| 4-Person Households | 1,173 (12.8%) | 0 (0.0%) |
| 5-Person Households | 496 (5.4%) | 0 (0.0%) |
| 6-Person Households | 326 (3.6%) | 21 (0.2%) |
| 7+ Person Households | 76 (0.8%) | 0 (0.0%) |
| Total | 6,315 (68.9%) | 2,849 (31.1%) |
Female Fertility in Macon County
Fertility by Age in Macon County
Average fertility rate in Macon County is 65.0 births per 1,000 women. Women in the age bracket of 20 to 34 years have the highest fertility rate with 141.0 births per 1,000 women. Women in the age bracket of 20 to 34 years acount for 96.5% of all women with births.
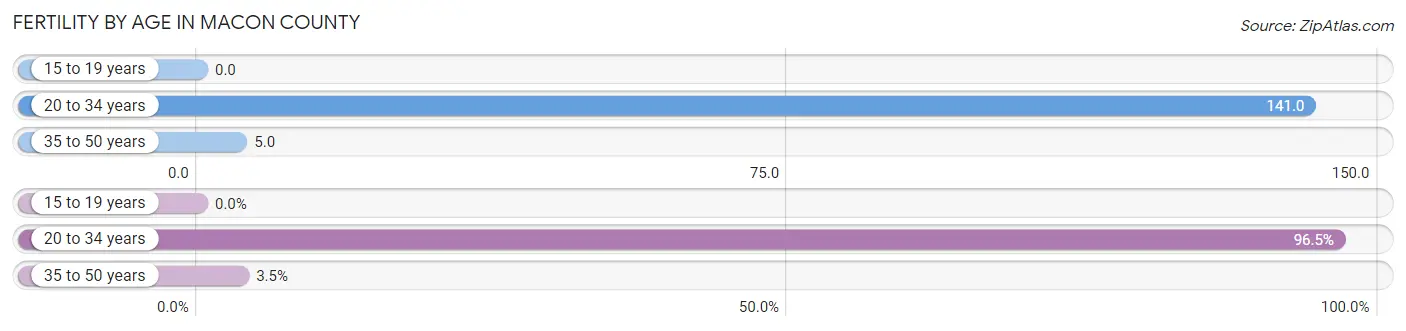
| Age Bracket | Women with Births | Births / 1,000 Women |
| 15 to 19 years | 0 (0.0%) | 0.0 |
| 20 to 34 years | 359 (96.5%) | 141.0 |
| 35 to 50 years | 13 (3.5%) | 5.0 |
| Total | 372 (100.0%) | 65.0 |
Fertility by Age by Marriage Status in Macon County
83.3% of women with births (372) in Macon County are married. The highest percentage of unmarried women with births falls into 20 to 34 years age bracket with 17.3% of them unmarried at the time of birth, while the lowest percentage of unmarried women with births belong to 35 to 50 years age bracket with 0.0% of them unmarried.
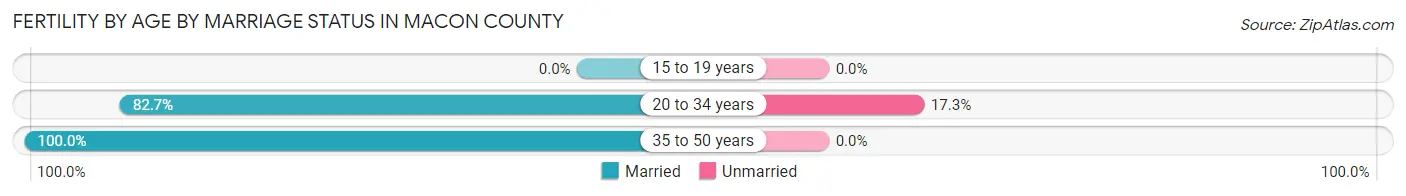
| Age Bracket | Married | Unmarried |
| 15 to 19 years | 0 (0.0%) | 0 (0.0%) |
| 20 to 34 years | 297 (82.7%) | 62 (17.3%) |
| 35 to 50 years | 13 (100.0%) | 0 (0.0%) |
| Total | 310 (83.3%) | 62 (16.7%) |
Fertility by Education in Macon County
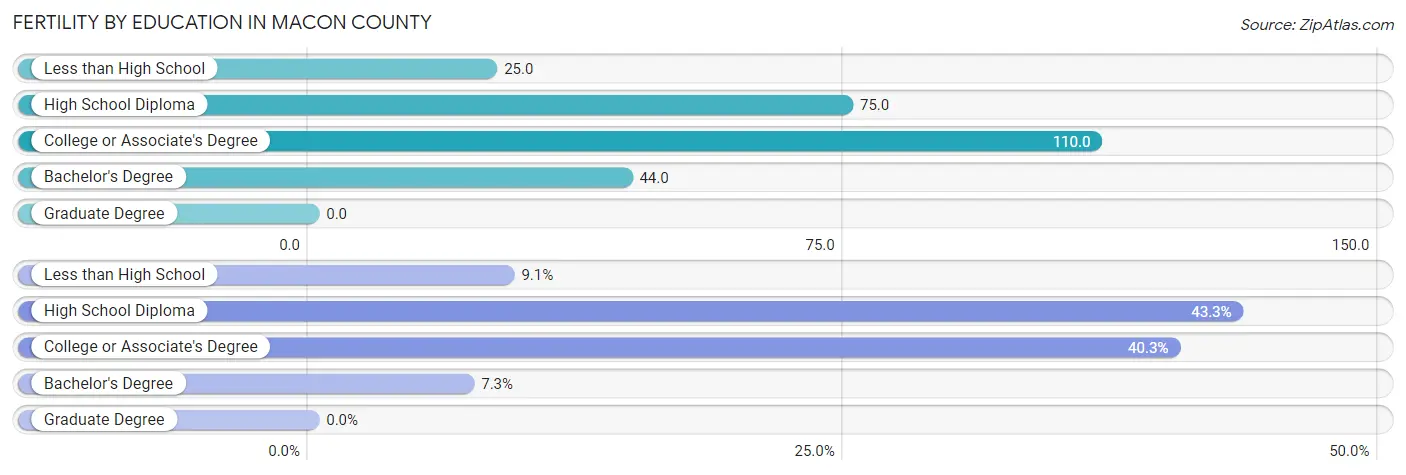
| Educational Attainment | Women with Births | Births / 1,000 Women |
| Less than High School | 34 (9.1%) | 25.0 |
| High School Diploma | 161 (43.3%) | 75.0 |
| College or Associate's Degree | 150 (40.3%) | 110.0 |
| Bachelor's Degree | 27 (7.3%) | 44.0 |
| Graduate Degree | 0 (0.0%) | 0.0 |
| Total | 372 (100.0%) | 65.0 |
Fertility by Education by Marriage Status in Macon County
16.7% of women with births in Macon County are unmarried. Women with the educational attainment of college or associate's degree are most likely to be married with 100.0% of them married at childbirth, while women with the educational attainment of bachelor's degree are least likely to be married with 100.0% of them unmarried at childbirth.
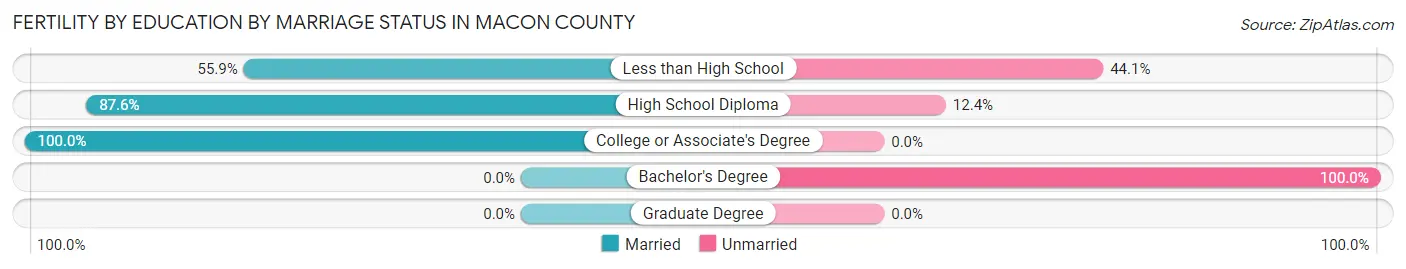
| Educational Attainment | Married | Unmarried |
| Less than High School | 19 (55.9%) | 15 (44.1%) |
| High School Diploma | 141 (87.6%) | 20 (12.4%) |
| College or Associate's Degree | 150 (100.0%) | 0 (0.0%) |
| Bachelor's Degree | 0 (0.0%) | 27 (100.0%) |
| Graduate Degree | 0 (0.0%) | 0 (0.0%) |
| Total | 310 (83.3%) | 62 (16.7%) |
Employment Characteristics in Macon County
Employment by Class of Employer in Macon County
Among the 11,481 employed individuals in Macon County, private company employees (8,398 | 73.2%), local government employees (1,113 | 9.7%), and self-employed (not incorporated) (916 | 8.0%) make up the most common classes of employment.
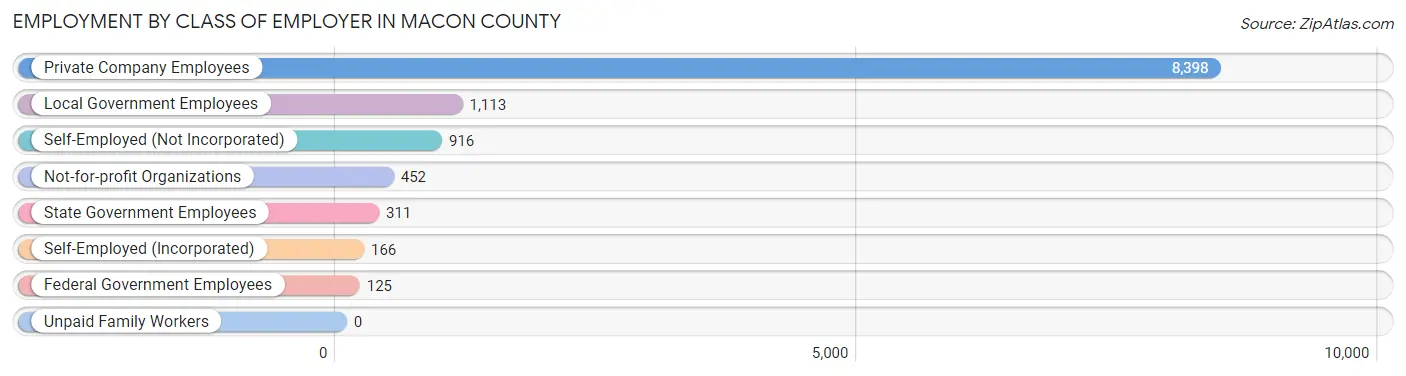
| Employer Class | # Employees | % Employees |
| Private Company Employees | 8,398 | 73.2% |
| Self-Employed (Incorporated) | 166 | 1.5% |
| Self-Employed (Not Incorporated) | 916 | 8.0% |
| Not-for-profit Organizations | 452 | 3.9% |
| Local Government Employees | 1,113 | 9.7% |
| State Government Employees | 311 | 2.7% |
| Federal Government Employees | 125 | 1.1% |
| Unpaid Family Workers | 0 | 0.0% |
| Total | 11,481 | 100.0% |
Employment Status by Age in Macon County
According to the labor force statistics for Macon County, out of the total population over 16 years of age (19,914), 61.7% or 12,287 individuals are in the labor force, with 3.6% or 442 of them unemployed. The age group with the highest labor force participation rate is 35 to 44 years, with 86.3% or 2,572 individuals in the labor force. Within the labor force, the 25 to 29 years age range has the highest percentage of unemployed individuals, with 7.9% or 100 of them being unemployed.
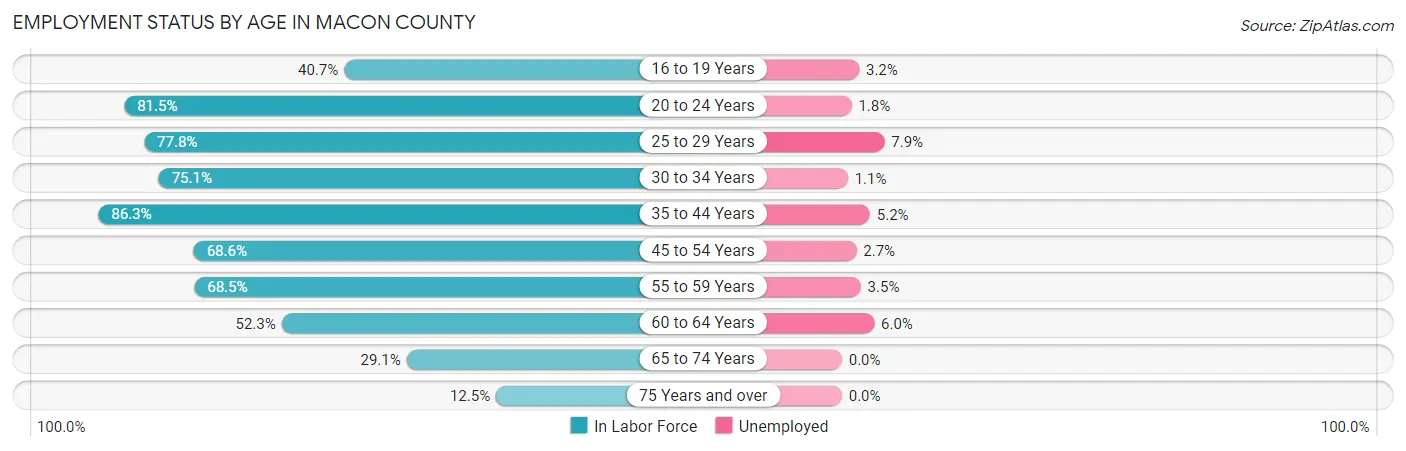
| Age Bracket | In Labor Force | Unemployed |
| 16 to 19 Years | 524 (40.7%) | 17 (3.2%) |
| 20 to 24 Years | 1,417 (81.5%) | 26 (1.8%) |
| 25 to 29 Years | 1,270 (77.8%) | 100 (7.9%) |
| 30 to 34 Years | 1,268 (75.1%) | 14 (1.1%) |
| 35 to 44 Years | 2,572 (86.3%) | 134 (5.2%) |
| 45 to 54 Years | 2,219 (68.6%) | 60 (2.7%) |
| 55 to 59 Years | 1,434 (68.5%) | 50 (3.5%) |
| 60 to 64 Years | 680 (52.3%) | 41 (6.0%) |
| 65 to 74 Years | 700 (29.1%) | 0 (0.0%) |
| 75 Years and over | 194 (12.5%) | 0 (0.0%) |
| Total | 12,287 (61.7%) | 442 (3.6%) |
Employment Status by Educational Attainment in Macon County
According to labor force statistics for Macon County, 73.0% of individuals (9,439) out of the total population between 25 and 64 years of age (12,930) are in the labor force, with 4.2% or 396 of them being unemployed. The group with the highest labor force participation rate are those with the educational attainment of bachelor's degree or higher, with 89.6% or 1,083 individuals in the labor force. Within the labor force, individuals with less than high school education have the highest percentage of unemployment, with 6.3% or 95 of them being unemployed.
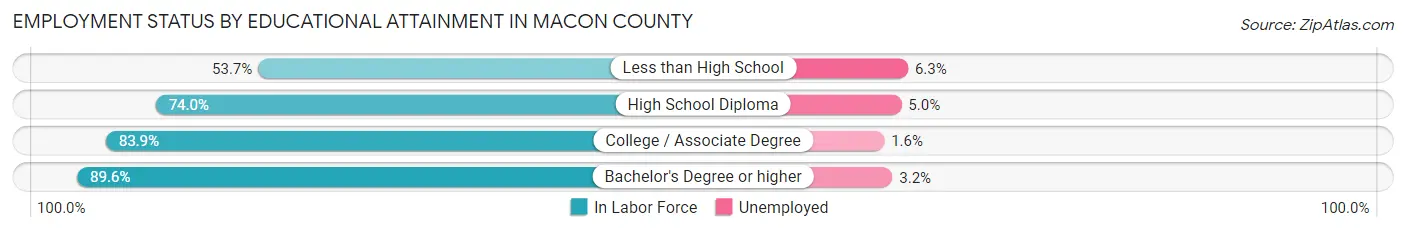
| Educational Attainment | In Labor Force | Unemployed |
| Less than High School | 1,504 (53.7%) | 176 (6.3%) |
| High School Diploma | 4,675 (74.0%) | 316 (5.0%) |
| College / Associate Degree | 2,184 (83.9%) | 42 (1.6%) |
| Bachelor's Degree or higher | 1,083 (89.6%) | 39 (3.2%) |
| Total | 9,439 (73.0%) | 543 (4.2%) |
Employment Occupations by Sex in Macon County
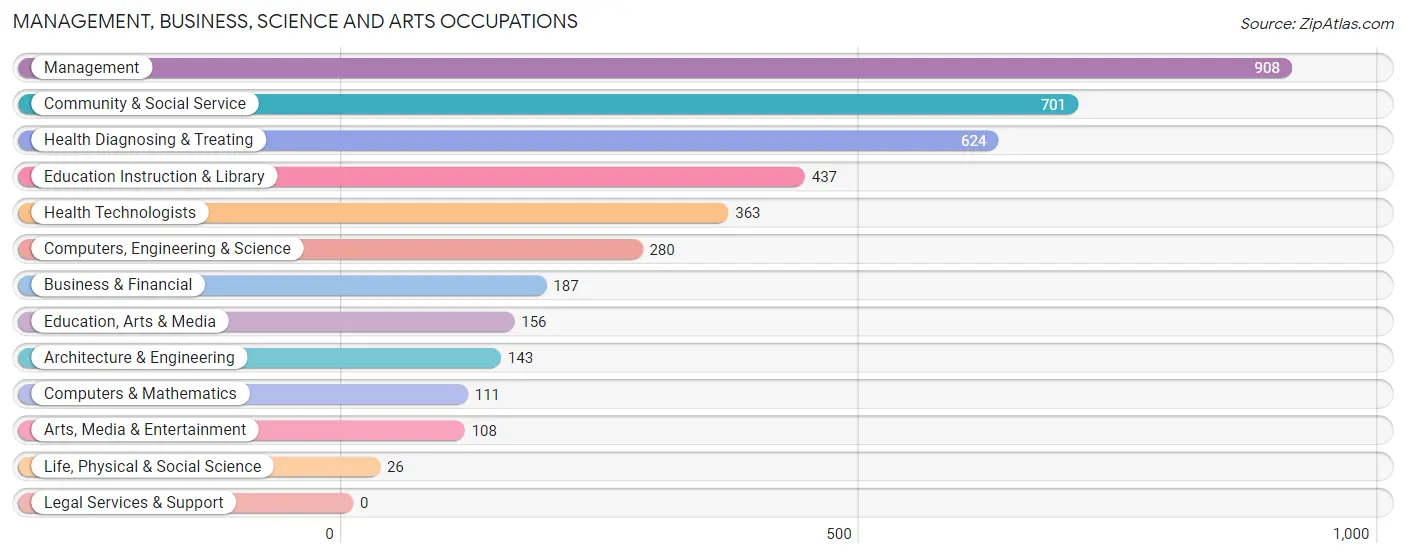
Management, Business, Science and Arts Occupations
The most common Management, Business, Science and Arts occupations in Macon County are Management (908 | 7.7%), Community & Social Service (701 | 5.9%), Health Diagnosing & Treating (624 | 5.3%), Education Instruction & Library (437 | 3.7%), and Health Technologists (363 | 3.1%).
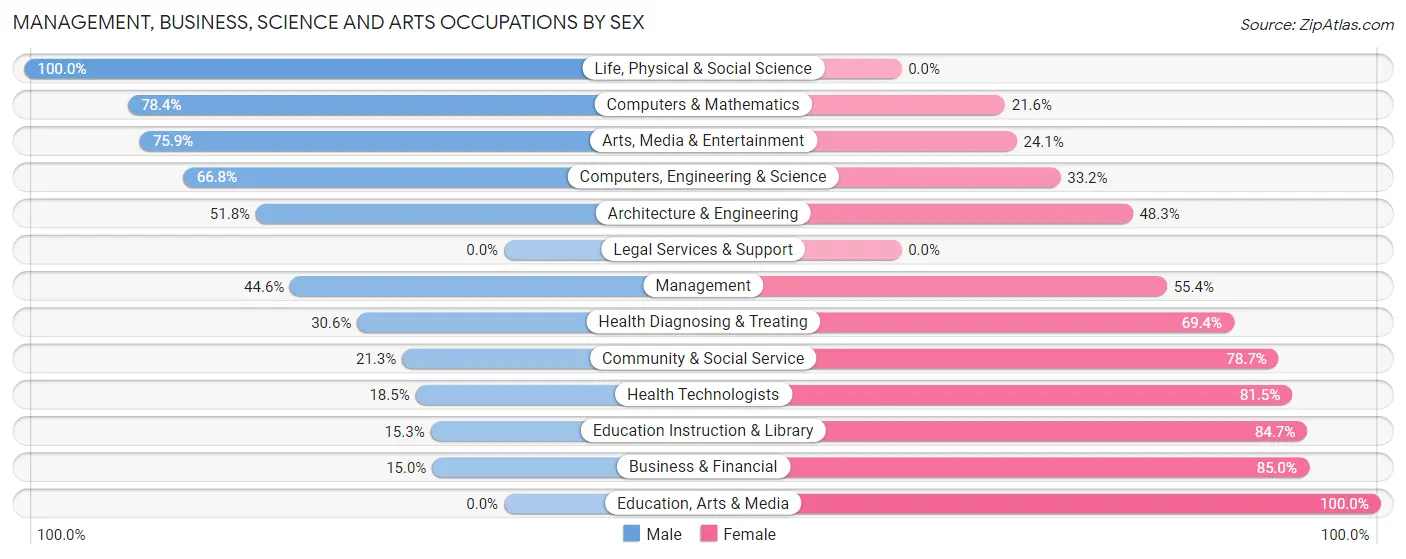
Management, Business, Science and Arts Occupations by Sex
Within the Management, Business, Science and Arts occupations in Macon County, the most male-oriented occupations are Life, Physical & Social Science (100.0%), Computers & Mathematics (78.4%), and Arts, Media & Entertainment (75.9%), while the most female-oriented occupations are Education, Arts & Media (100.0%), Business & Financial (85.0%), and Education Instruction & Library (84.7%).
| Occupation | Male | Female |
| Management | 405 (44.6%) | 503 (55.4%) |
| Business & Financial | 28 (15.0%) | 159 (85.0%) |
| Computers, Engineering & Science | 187 (66.8%) | 93 (33.2%) |
| Computers & Mathematics | 87 (78.4%) | 24 (21.6%) |
| Architecture & Engineering | 74 (51.7%) | 69 (48.2%) |
| Life, Physical & Social Science | 26 (100.0%) | 0 (0.0%) |
| Community & Social Service | 149 (21.3%) | 552 (78.7%) |
| Education, Arts & Media | 0 (0.0%) | 156 (100.0%) |
| Legal Services & Support | 0 (0.0%) | 0 (0.0%) |
| Education Instruction & Library | 67 (15.3%) | 370 (84.7%) |
| Arts, Media & Entertainment | 82 (75.9%) | 26 (24.1%) |
| Health Diagnosing & Treating | 191 (30.6%) | 433 (69.4%) |
| Health Technologists | 67 (18.5%) | 296 (81.5%) |
| Total (Category) | 960 (35.6%) | 1,740 (64.4%) |
| Total (Overall) | 6,362 (53.7%) | 5,475 (46.3%) |
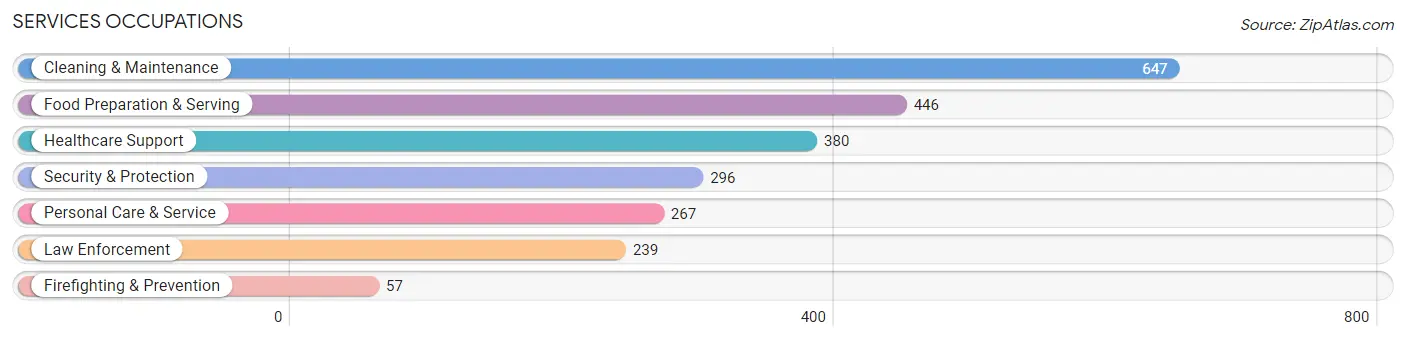
Services Occupations
The most common Services occupations in Macon County are Cleaning & Maintenance (647 | 5.5%), Food Preparation & Serving (446 | 3.8%), Healthcare Support (380 | 3.2%), Security & Protection (296 | 2.5%), and Personal Care & Service (267 | 2.3%).
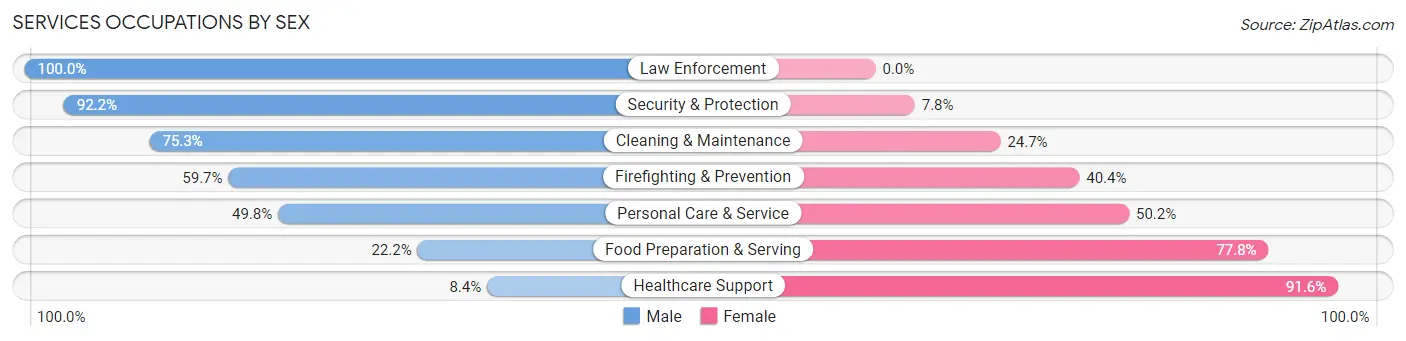
Services Occupations by Sex
Within the Services occupations in Macon County, the most male-oriented occupations are Law Enforcement (100.0%), Security & Protection (92.2%), and Cleaning & Maintenance (75.3%), while the most female-oriented occupations are Healthcare Support (91.6%), Food Preparation & Serving (77.8%), and Personal Care & Service (50.2%).
| Occupation | Male | Female |
| Healthcare Support | 32 (8.4%) | 348 (91.6%) |
| Security & Protection | 273 (92.2%) | 23 (7.8%) |
| Firefighting & Prevention | 34 (59.7%) | 23 (40.4%) |
| Law Enforcement | 239 (100.0%) | 0 (0.0%) |
| Food Preparation & Serving | 99 (22.2%) | 347 (77.8%) |
| Cleaning & Maintenance | 487 (75.3%) | 160 (24.7%) |
| Personal Care & Service | 133 (49.8%) | 134 (50.2%) |
| Total (Category) | 1,024 (50.3%) | 1,012 (49.7%) |
| Total (Overall) | 6,362 (53.7%) | 5,475 (46.3%) |
Sales and Office Occupations
The most common Sales and Office occupations in Macon County are Office & Administration (1,183 | 10.0%), and Sales & Related (1,018 | 8.6%).

Sales and Office Occupations by Sex

| Occupation | Male | Female |
| Sales & Related | 463 (45.5%) | 555 (54.5%) |
| Office & Administration | 170 (14.4%) | 1,013 (85.6%) |
| Total (Category) | 633 (28.8%) | 1,568 (71.2%) |
| Total (Overall) | 6,362 (53.7%) | 5,475 (46.3%) |
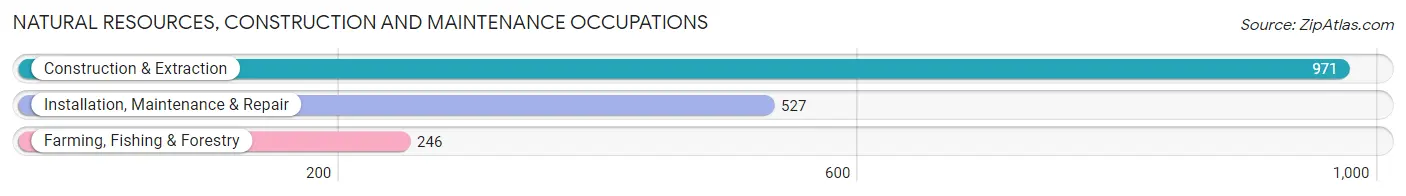
Natural Resources, Construction and Maintenance Occupations
The most common Natural Resources, Construction and Maintenance occupations in Macon County are Construction & Extraction (971 | 8.2%), Installation, Maintenance & Repair (527 | 4.4%), and Farming, Fishing & Forestry (246 | 2.1%).
Natural Resources, Construction and Maintenance Occupations by Sex
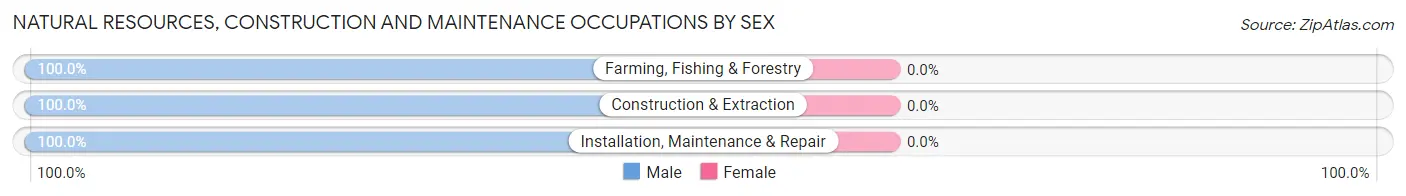
| Occupation | Male | Female |
| Farming, Fishing & Forestry | 246 (100.0%) | 0 (0.0%) |
| Construction & Extraction | 971 (100.0%) | 0 (0.0%) |
| Installation, Maintenance & Repair | 527 (100.0%) | 0 (0.0%) |
| Total (Category) | 1,744 (100.0%) | 0 (0.0%) |
| Total (Overall) | 6,362 (53.7%) | 5,475 (46.3%) |
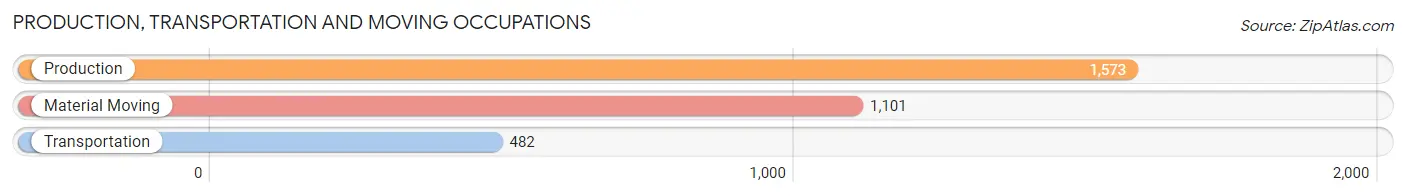
Production, Transportation and Moving Occupations
The most common Production, Transportation and Moving occupations in Macon County are Production (1,573 | 13.3%), Material Moving (1,101 | 9.3%), and Transportation (482 | 4.1%).
Production, Transportation and Moving Occupations by Sex
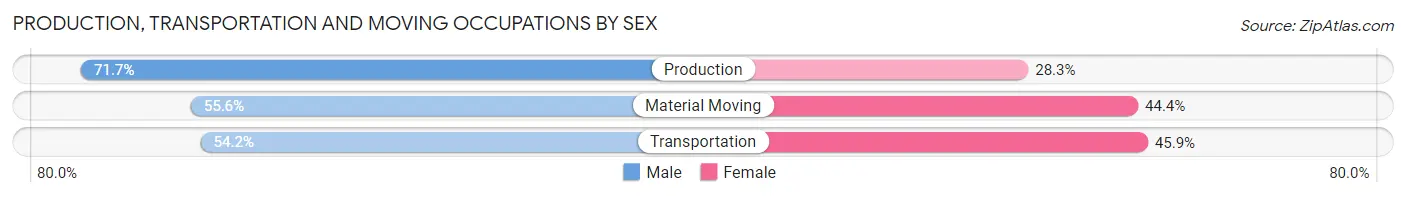
| Occupation | Male | Female |
| Production | 1,128 (71.7%) | 445 (28.3%) |
| Transportation | 261 (54.1%) | 221 (45.9%) |
| Material Moving | 612 (55.6%) | 489 (44.4%) |
| Total (Category) | 2,001 (63.4%) | 1,155 (36.6%) |
| Total (Overall) | 6,362 (53.7%) | 5,475 (46.3%) |
Employment Industries by Sex in Macon County
Employment Industries in Macon County
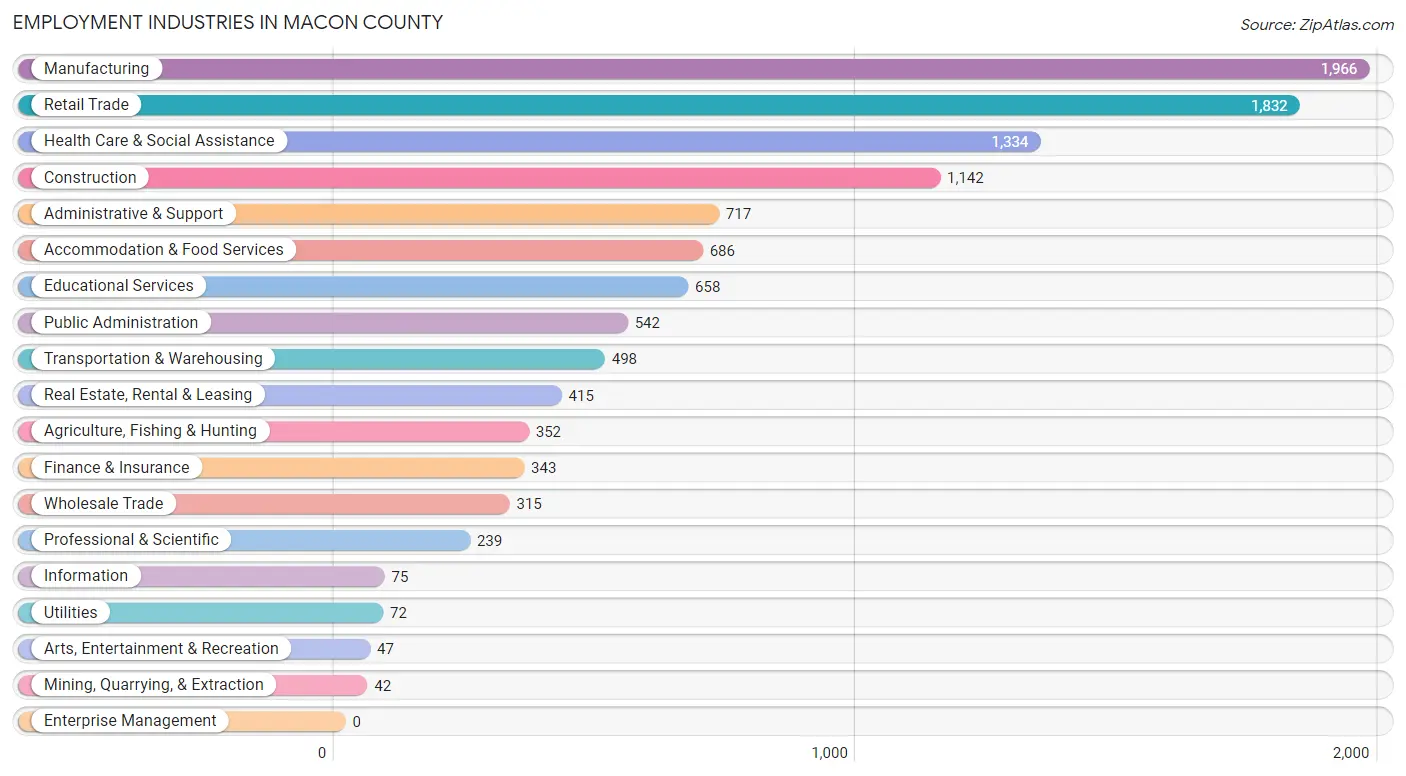
The major employment industries in Macon County include Manufacturing (1,966 | 16.6%), Retail Trade (1,832 | 15.5%), Health Care & Social Assistance (1,334 | 11.3%), Construction (1,142 | 9.7%), and Administrative & Support (717 | 6.1%).
Employment Industries by Sex in Macon County
The Macon County industries that see more men than women are Mining, Quarrying, & Extraction (100.0%), Arts, Entertainment & Recreation (100.0%), and Agriculture, Fishing & Hunting (95.5%), whereas the industries that tend to have a higher number of women are Educational Services (84.7%), Finance & Insurance (82.5%), and Health Care & Social Assistance (82.2%).
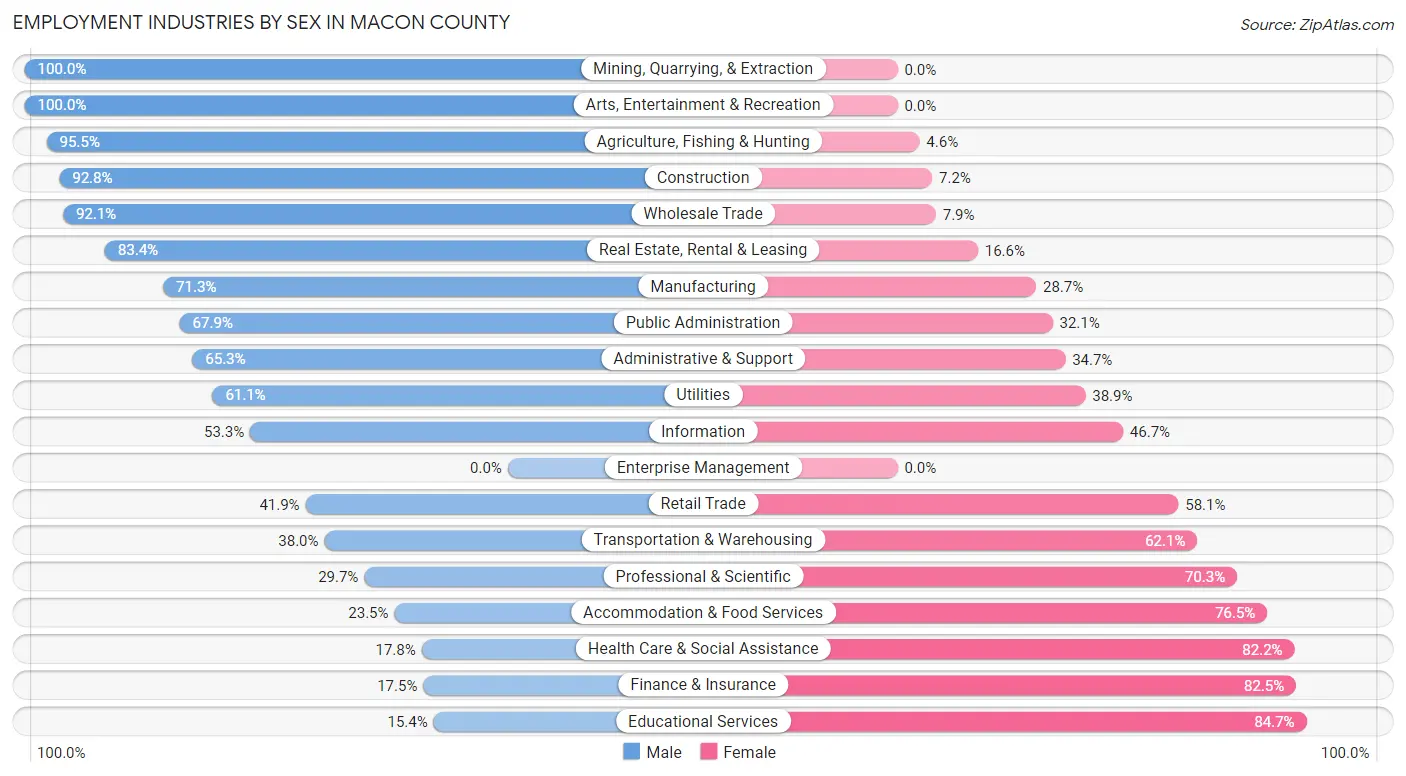
| Industry | Male | Female |
| Agriculture, Fishing & Hunting | 336 (95.5%) | 16 (4.5%) |
| Mining, Quarrying, & Extraction | 42 (100.0%) | 0 (0.0%) |
| Construction | 1,060 (92.8%) | 82 (7.2%) |
| Manufacturing | 1,402 (71.3%) | 564 (28.7%) |
| Wholesale Trade | 290 (92.1%) | 25 (7.9%) |
| Retail Trade | 767 (41.9%) | 1,065 (58.1%) |
| Transportation & Warehousing | 189 (38.0%) | 309 (62.1%) |
| Utilities | 44 (61.1%) | 28 (38.9%) |
| Information | 40 (53.3%) | 35 (46.7%) |
| Finance & Insurance | 60 (17.5%) | 283 (82.5%) |
| Real Estate, Rental & Leasing | 346 (83.4%) | 69 (16.6%) |
| Professional & Scientific | 71 (29.7%) | 168 (70.3%) |
| Enterprise Management | 0 (0.0%) | 0 (0.0%) |
| Administrative & Support | 468 (65.3%) | 249 (34.7%) |
| Educational Services | 101 (15.3%) | 557 (84.7%) |
| Health Care & Social Assistance | 238 (17.8%) | 1,096 (82.2%) |
| Arts, Entertainment & Recreation | 47 (100.0%) | 0 (0.0%) |
| Accommodation & Food Services | 161 (23.5%) | 525 (76.5%) |
| Public Administration | 368 (67.9%) | 174 (32.1%) |
| Total | 6,362 (53.7%) | 5,475 (46.3%) |
Education in Macon County
School Enrollment in Macon County
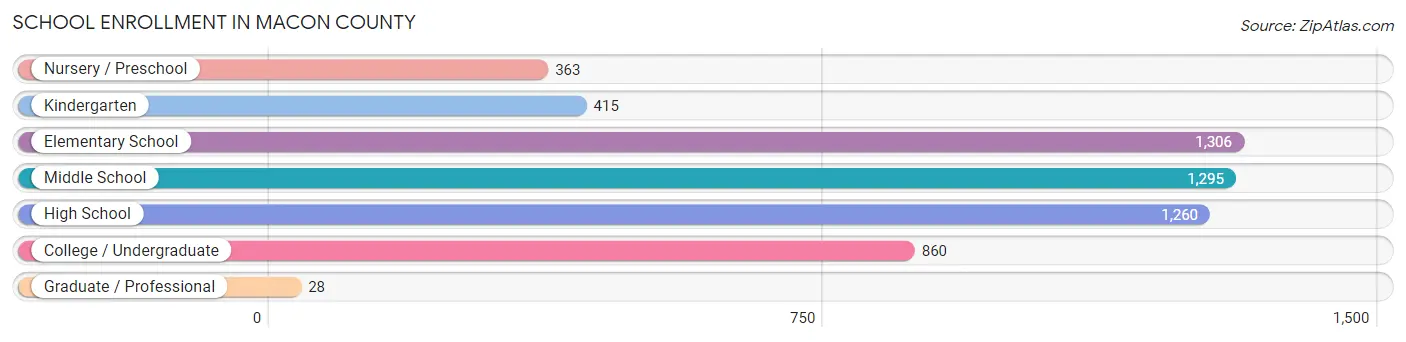
The most common levels of schooling among the 5,527 students in Macon County are elementary school (1,306 | 23.6%), middle school (1,295 | 23.4%), and high school (1,260 | 22.8%).
| School Level | # Students | % Students |
| Nursery / Preschool | 363 | 6.6% |
| Kindergarten | 415 | 7.5% |
| Elementary School | 1,306 | 23.6% |
| Middle School | 1,295 | 23.4% |
| High School | 1,260 | 22.8% |
| College / Undergraduate | 860 | 15.6% |
| Graduate / Professional | 28 | 0.5% |
| Total | 5,527 | 100.0% |
School Enrollment by Age by Funding Source in Macon County
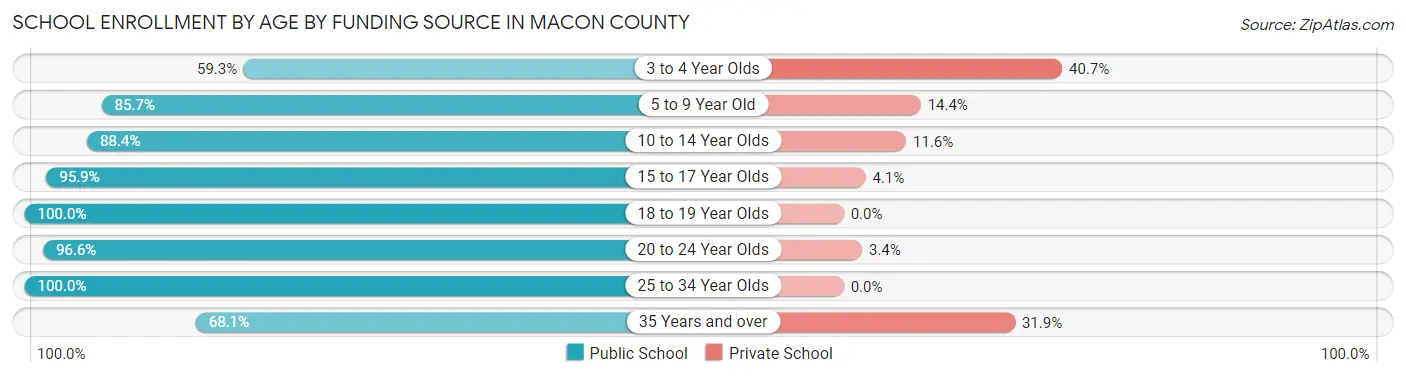
Out of a total of 5,527 students who are enrolled in schools in Macon County, 636 (11.5%) attend a private institution, while the remaining 4,891 (88.5%) are enrolled in public schools. The age group of 3 to 4 year olds has the highest likelihood of being enrolled in private schools, with 118 (40.7% in the age bracket) enrolled. Conversely, the age group of 18 to 19 year olds has the lowest likelihood of being enrolled in a private school, with 249 (100.0% in the age bracket) attending a public institution.
| Age Bracket | Public School | Private School |
| 3 to 4 Year Olds | 172 (59.3%) | 118 (40.7%) |
| 5 to 9 Year Old | 1,414 (85.7%) | 237 (14.3%) |
| 10 to 14 Year Olds | 1,497 (88.4%) | 197 (11.6%) |
| 15 to 17 Year Olds | 804 (95.9%) | 34 (4.1%) |
| 18 to 19 Year Olds | 249 (100.0%) | 0 (0.0%) |
| 20 to 24 Year Olds | 509 (96.6%) | 18 (3.4%) |
| 25 to 34 Year Olds | 184 (100.0%) | 0 (0.0%) |
| 35 Years and over | 64 (68.1%) | 30 (31.9%) |
| Total | 4,891 (88.5%) | 636 (11.5%) |
Educational Attainment by Field of Study in Macon County
Education (476 | 25.7%), science & technology (331 | 17.8%), business (284 | 15.3%), social sciences (178 | 9.6%), and physical & health sciences (134 | 7.2%) are the most common fields of study among 1,855 individuals in Macon County who have obtained a bachelor's degree or higher.
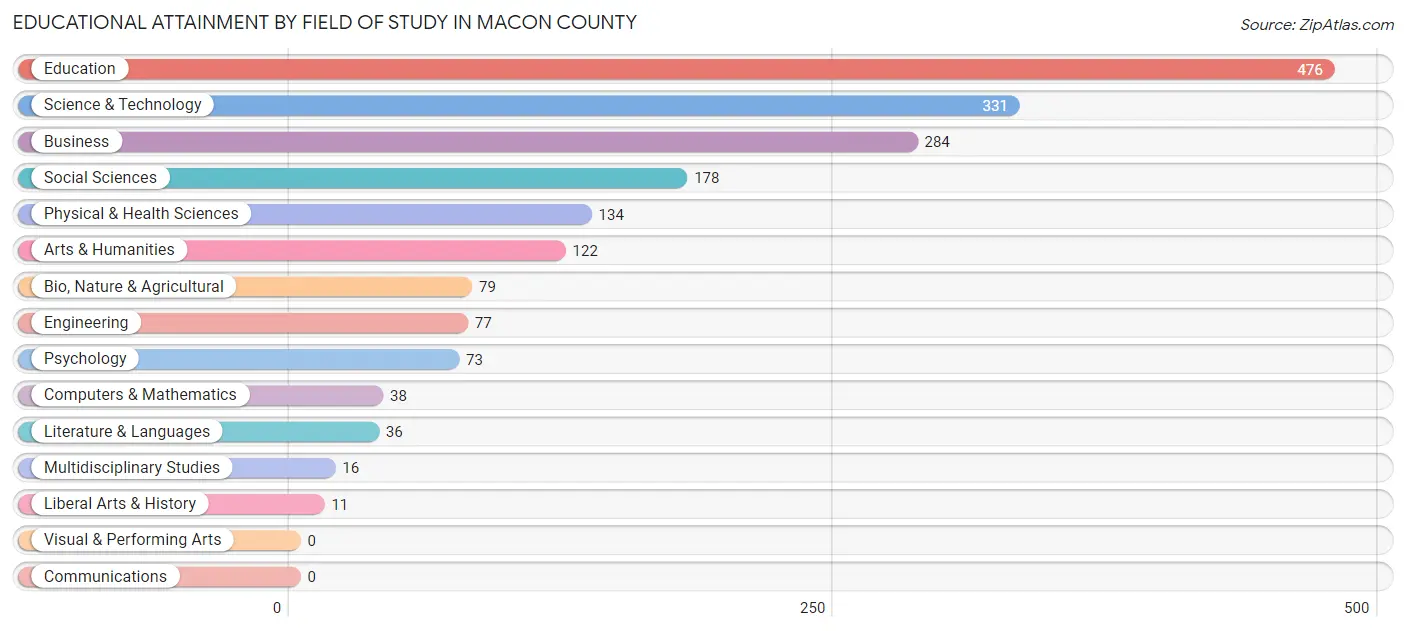
| Field of Study | # Graduates | % Graduates |
| Computers & Mathematics | 38 | 2.1% |
| Bio, Nature & Agricultural | 79 | 4.3% |
| Physical & Health Sciences | 134 | 7.2% |
| Psychology | 73 | 3.9% |
| Social Sciences | 178 | 9.6% |
| Engineering | 77 | 4.2% |
| Multidisciplinary Studies | 16 | 0.9% |
| Science & Technology | 331 | 17.8% |
| Business | 284 | 15.3% |
| Education | 476 | 25.7% |
| Literature & Languages | 36 | 1.9% |
| Liberal Arts & History | 11 | 0.6% |
| Visual & Performing Arts | 0 | 0.0% |
| Communications | 0 | 0.0% |
| Arts & Humanities | 122 | 6.6% |
| Total | 1,855 | 100.0% |
Transportation & Commute in Macon County
Vehicle Availability by Sex in Macon County
The most prevalent vehicle ownership categories in Macon County are males with 2 vehicles (2,039, accounting for 32.8%) and females with 2 vehicles (1,167, making up 38.7%).
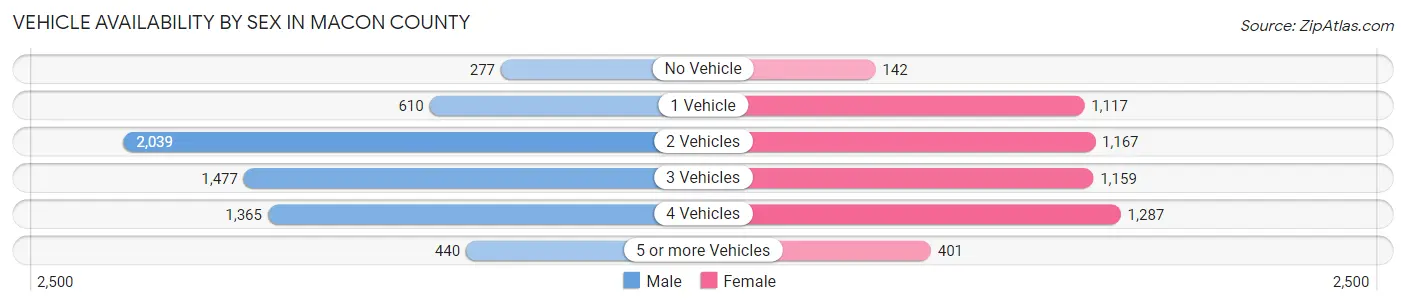
| Vehicles Available | Male | Female |
| No Vehicle | 277 (4.5%) | 142 (2.7%) |
| 1 Vehicle | 610 (9.8%) | 1,117 (21.2%) |
| 2 Vehicles | 2,039 (32.8%) | 1,167 (22.1%) |
| 3 Vehicles | 1,477 (23.8%) | 1,159 (22.0%) |
| 4 Vehicles | 1,365 (22.0%) | 1,287 (24.4%) |
| 5 or more Vehicles | 440 (7.1%) | 401 (7.6%) |
| Total | 6,208 (100.0%) | 5,273 (100.0%) |
Commute Time in Macon County
The most frequently occuring commute durations in Macon County are 10 to 14 minutes (1,825 commuters, 16.5%), 45 to 59 minutes (1,816 commuters, 16.4%), and 60 to 89 minutes (1,769 commuters, 16.0%).
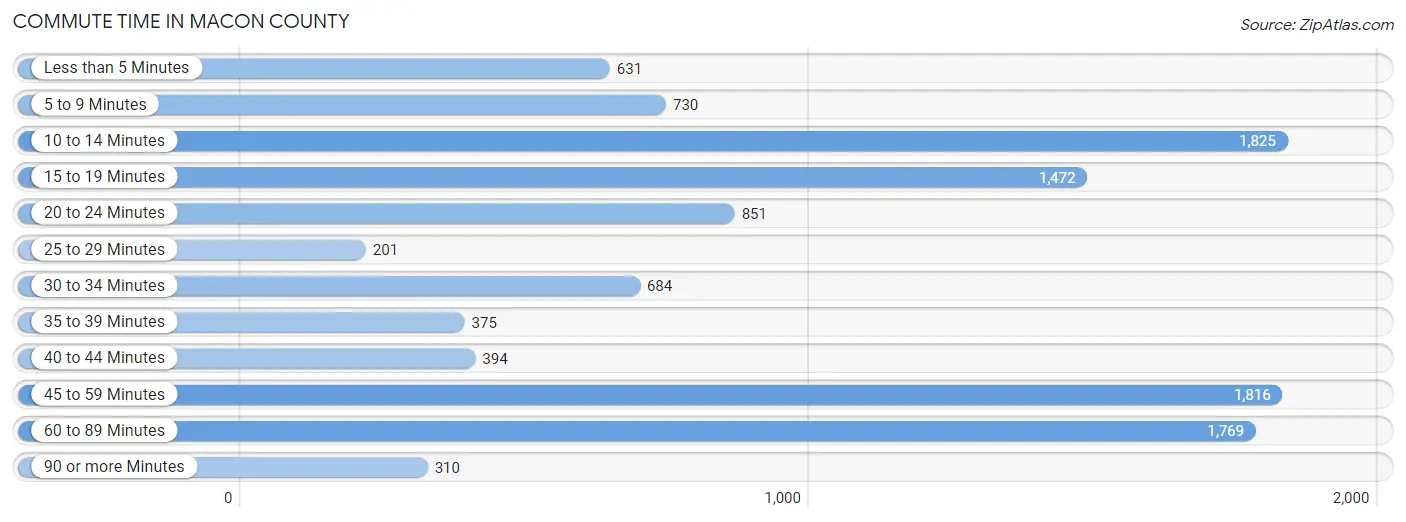
| Commute Time | # Commuters | % Commuters |
| Less than 5 Minutes | 631 | 5.7% |
| 5 to 9 Minutes | 730 | 6.6% |
| 10 to 14 Minutes | 1,825 | 16.5% |
| 15 to 19 Minutes | 1,472 | 13.3% |
| 20 to 24 Minutes | 851 | 7.7% |
| 25 to 29 Minutes | 201 | 1.8% |
| 30 to 34 Minutes | 684 | 6.2% |
| 35 to 39 Minutes | 375 | 3.4% |
| 40 to 44 Minutes | 394 | 3.6% |
| 45 to 59 Minutes | 1,816 | 16.4% |
| 60 to 89 Minutes | 1,769 | 16.0% |
| 90 or more Minutes | 310 | 2.8% |
Commute Time by Sex in Macon County
The most common commute times in Macon County are 60 to 89 minutes (1,311 commuters, 21.6%) for males and 10 to 14 minutes (881 commuters, 17.6%) for females.
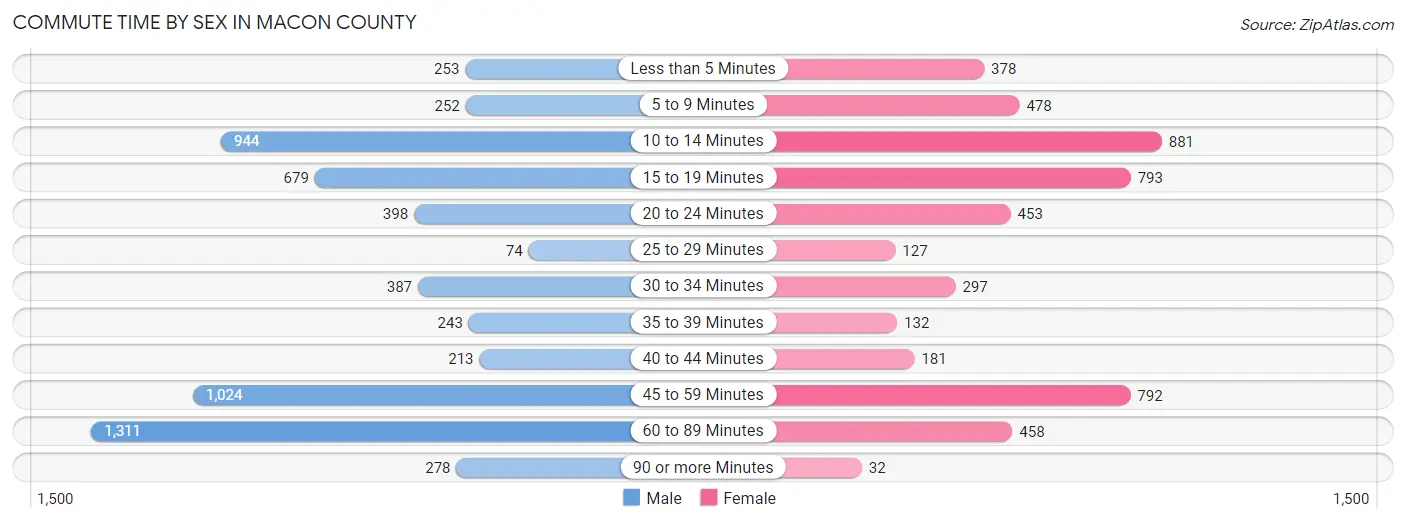
| Commute Time | Male | Female |
| Less than 5 Minutes | 253 (4.2%) | 378 (7.6%) |
| 5 to 9 Minutes | 252 (4.2%) | 478 (9.6%) |
| 10 to 14 Minutes | 944 (15.6%) | 881 (17.6%) |
| 15 to 19 Minutes | 679 (11.2%) | 793 (15.9%) |
| 20 to 24 Minutes | 398 (6.6%) | 453 (9.1%) |
| 25 to 29 Minutes | 74 (1.2%) | 127 (2.5%) |
| 30 to 34 Minutes | 387 (6.4%) | 297 (5.9%) |
| 35 to 39 Minutes | 243 (4.0%) | 132 (2.6%) |
| 40 to 44 Minutes | 213 (3.5%) | 181 (3.6%) |
| 45 to 59 Minutes | 1,024 (16.9%) | 792 (15.8%) |
| 60 to 89 Minutes | 1,311 (21.6%) | 458 (9.2%) |
| 90 or more Minutes | 278 (4.6%) | 32 (0.6%) |
Time of Departure to Work by Sex in Macon County
The most frequent times of departure to work in Macon County are 7:00 AM to 7:29 AM (895, 14.8%) for males and 7:00 AM to 7:29 AM (959, 19.2%) for females.
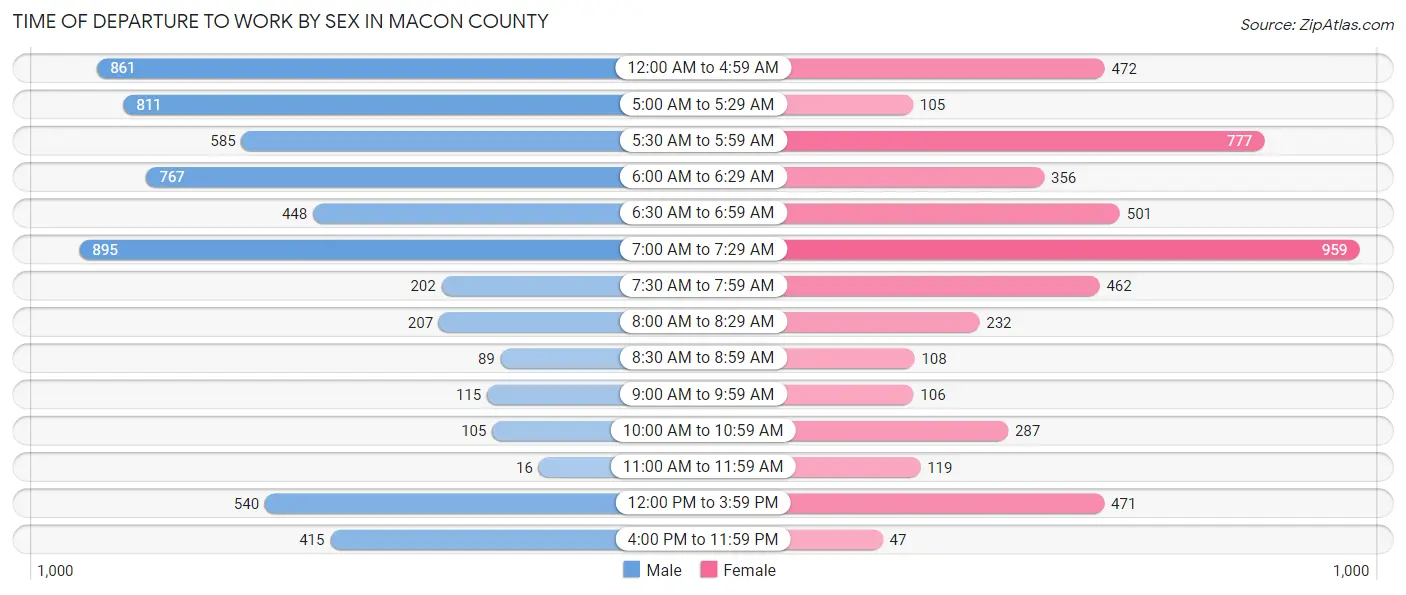
| Time of Departure | Male | Female |
| 12:00 AM to 4:59 AM | 861 (14.2%) | 472 (9.4%) |
| 5:00 AM to 5:29 AM | 811 (13.4%) | 105 (2.1%) |
| 5:30 AM to 5:59 AM | 585 (9.7%) | 777 (15.5%) |
| 6:00 AM to 6:29 AM | 767 (12.7%) | 356 (7.1%) |
| 6:30 AM to 6:59 AM | 448 (7.4%) | 501 (10.0%) |
| 7:00 AM to 7:29 AM | 895 (14.8%) | 959 (19.2%) |
| 7:30 AM to 7:59 AM | 202 (3.3%) | 462 (9.2%) |
| 8:00 AM to 8:29 AM | 207 (3.4%) | 232 (4.6%) |
| 8:30 AM to 8:59 AM | 89 (1.5%) | 108 (2.2%) |
| 9:00 AM to 9:59 AM | 115 (1.9%) | 106 (2.1%) |
| 10:00 AM to 10:59 AM | 105 (1.7%) | 287 (5.7%) |
| 11:00 AM to 11:59 AM | 16 (0.3%) | 119 (2.4%) |
| 12:00 PM to 3:59 PM | 540 (8.9%) | 471 (9.4%) |
| 4:00 PM to 11:59 PM | 415 (6.9%) | 47 (0.9%) |
| Total | 6,056 (100.0%) | 5,002 (100.0%) |
Housing Occupancy in Macon County
Occupancy by Ownership in Macon County
Of the total 9,164 dwellings in Macon County, owner-occupied units account for 6,577 (71.8%), while renter-occupied units make up 2,587 (28.2%).
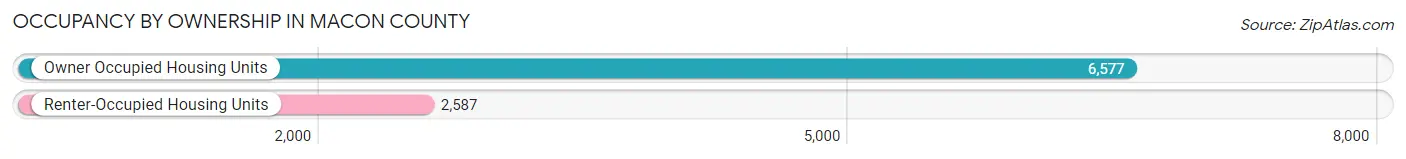
| Occupancy | # Housing Units | % Housing Units |
| Owner Occupied Housing Units | 6,577 | 71.8% |
| Renter-Occupied Housing Units | 2,587 | 28.2% |
| Total Occupied Housing Units | 9,164 | 100.0% |
Occupancy by Household Size in Macon County
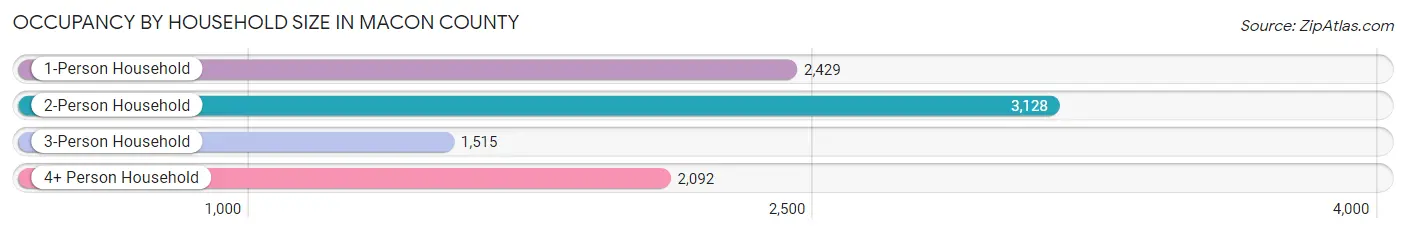
| Household Size | # Housing Units | % Housing Units |
| 1-Person Household | 2,429 | 26.5% |
| 2-Person Household | 3,128 | 34.1% |
| 3-Person Household | 1,515 | 16.5% |
| 4+ Person Household | 2,092 | 22.8% |
| Total Housing Units | 9,164 | 100.0% |
Occupancy by Ownership by Household Size in Macon County
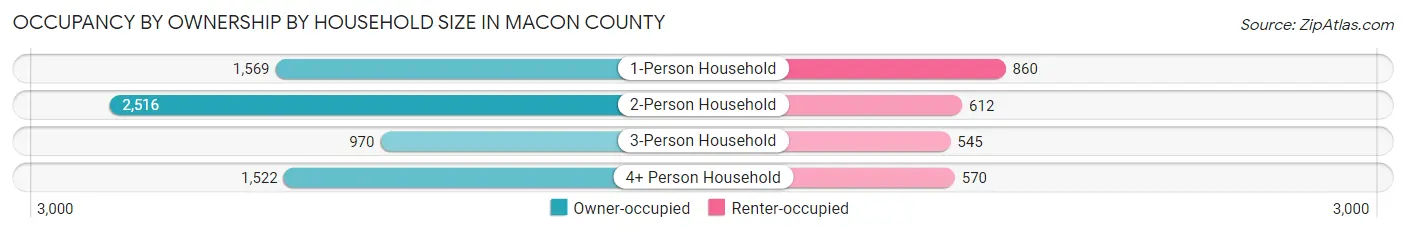
| Household Size | Owner-occupied | Renter-occupied |
| 1-Person Household | 1,569 (64.6%) | 860 (35.4%) |
| 2-Person Household | 2,516 (80.4%) | 612 (19.6%) |
| 3-Person Household | 970 (64.0%) | 545 (36.0%) |
| 4+ Person Household | 1,522 (72.8%) | 570 (27.3%) |
| Total Housing Units | 6,577 (71.8%) | 2,587 (28.2%) |
Occupancy by Educational Attainment in Macon County
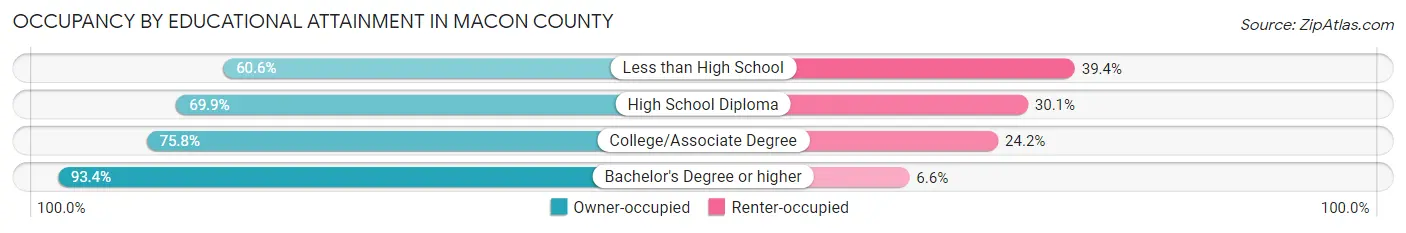
| Household Size | Owner-occupied | Renter-occupied |
| Less than High School | 1,016 (60.6%) | 660 (39.4%) |
| High School Diploma | 3,115 (69.9%) | 1,340 (30.1%) |
| College/Associate Degree | 1,667 (75.8%) | 532 (24.2%) |
| Bachelor's Degree or higher | 779 (93.4%) | 55 (6.6%) |
Occupancy by Age of Householder in Macon County
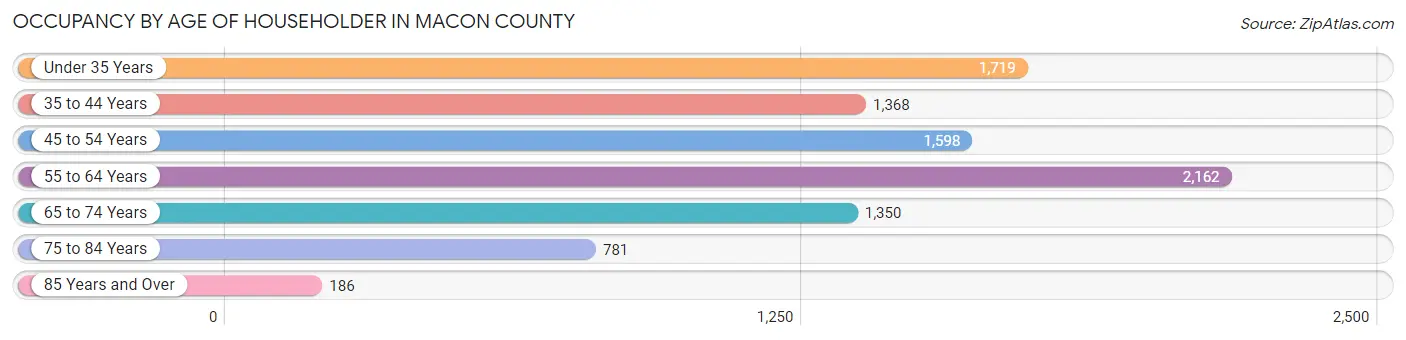
| Age Bracket | # Households | % Households |
| Under 35 Years | 1,719 | 18.8% |
| 35 to 44 Years | 1,368 | 14.9% |
| 45 to 54 Years | 1,598 | 17.4% |
| 55 to 64 Years | 2,162 | 23.6% |
| 65 to 74 Years | 1,350 | 14.7% |
| 75 to 84 Years | 781 | 8.5% |
| 85 Years and Over | 186 | 2.0% |
| Total | 9,164 | 100.0% |
Housing Finances in Macon County
Median Income by Occupancy in Macon County
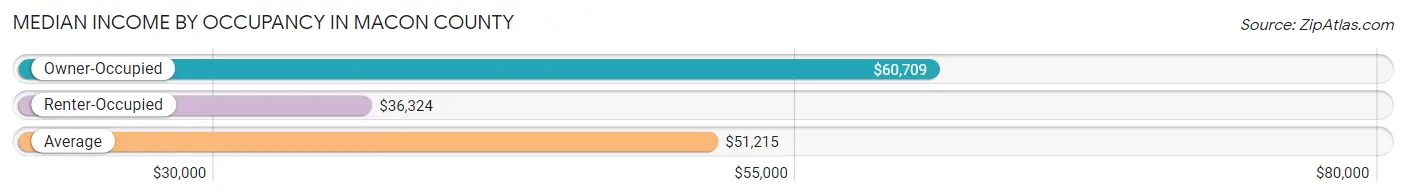
| Occupancy Type | # Households | Median Income |
| Owner-Occupied | 6,577 (71.8%) | $60,709 |
| Renter-Occupied | 2,587 (28.2%) | $36,324 |
| Average | 9,164 (100.0%) | $51,215 |
Occupancy by Householder Income Bracket in Macon County
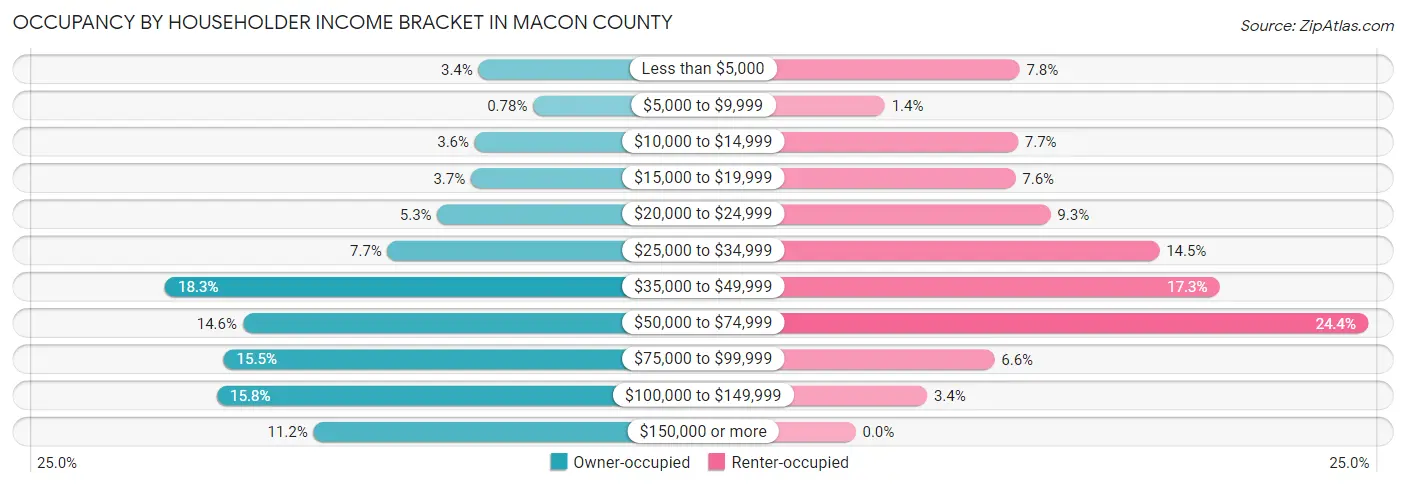
| Income Bracket | Owner-occupied | Renter-occupied |
| Less than $5,000 | 222 (3.4%) | 202 (7.8%) |
| $5,000 to $9,999 | 51 (0.8%) | 36 (1.4%) |
| $10,000 to $14,999 | 234 (3.6%) | 200 (7.7%) |
| $15,000 to $19,999 | 246 (3.7%) | 197 (7.6%) |
| $20,000 to $24,999 | 351 (5.3%) | 240 (9.3%) |
| $25,000 to $34,999 | 507 (7.7%) | 374 (14.5%) |
| $35,000 to $49,999 | 1,204 (18.3%) | 448 (17.3%) |
| $50,000 to $74,999 | 961 (14.6%) | 631 (24.4%) |
| $75,000 to $99,999 | 1,021 (15.5%) | 171 (6.6%) |
| $100,000 to $149,999 | 1,041 (15.8%) | 88 (3.4%) |
| $150,000 or more | 739 (11.2%) | 0 (0.0%) |
| Total | 6,577 (100.0%) | 2,587 (100.0%) |
Monthly Housing Cost Tiers in Macon County
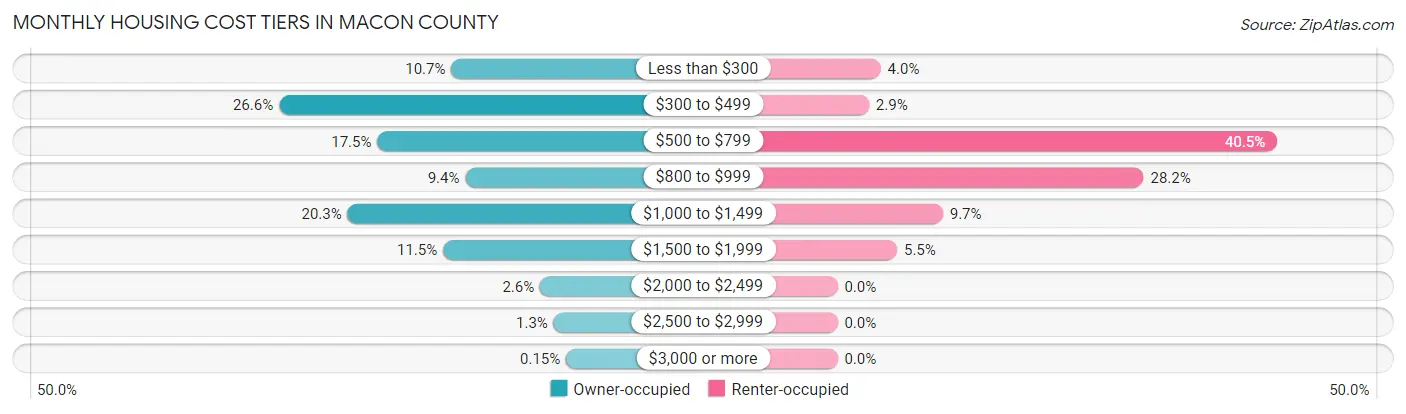
| Monthly Cost | Owner-occupied | Renter-occupied |
| Less than $300 | 705 (10.7%) | 103 (4.0%) |
| $300 to $499 | 1,748 (26.6%) | 75 (2.9%) |
| $500 to $799 | 1,153 (17.5%) | 1,047 (40.5%) |
| $800 to $999 | 620 (9.4%) | 729 (28.2%) |
| $1,000 to $1,499 | 1,333 (20.3%) | 251 (9.7%) |
| $1,500 to $1,999 | 755 (11.5%) | 142 (5.5%) |
| $2,000 to $2,499 | 168 (2.5%) | 0 (0.0%) |
| $2,500 to $2,999 | 85 (1.3%) | 0 (0.0%) |
| $3,000 or more | 10 (0.2%) | 0 (0.0%) |
| Total | 6,577 (100.0%) | 2,587 (100.0%) |
Physical Housing Characteristics in Macon County
Housing Structures in Macon County
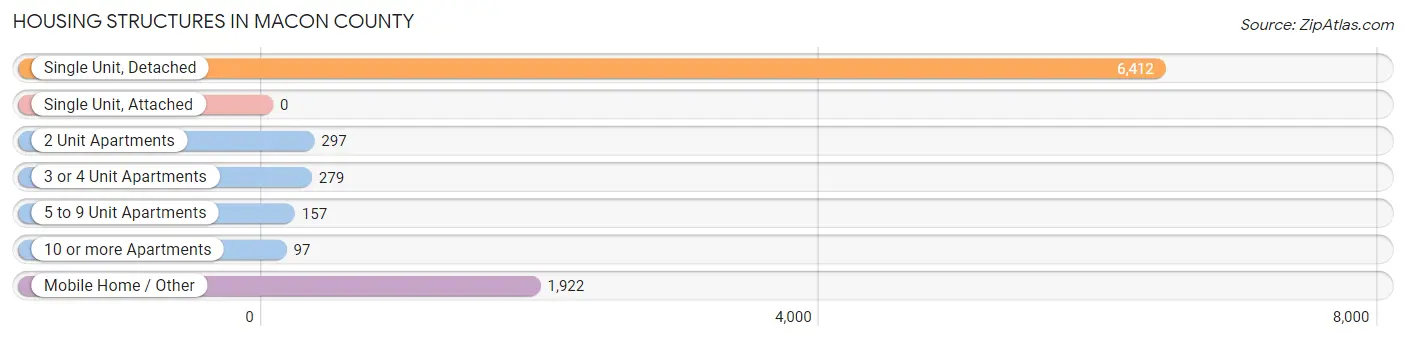
| Structure Type | # Housing Units | % Housing Units |
| Single Unit, Detached | 6,412 | 70.0% |
| Single Unit, Attached | 0 | 0.0% |
| 2 Unit Apartments | 297 | 3.2% |
| 3 or 4 Unit Apartments | 279 | 3.0% |
| 5 to 9 Unit Apartments | 157 | 1.7% |
| 10 or more Apartments | 97 | 1.1% |
| Mobile Home / Other | 1,922 | 21.0% |
| Total | 9,164 | 100.0% |
Housing Structures by Occupancy in Macon County
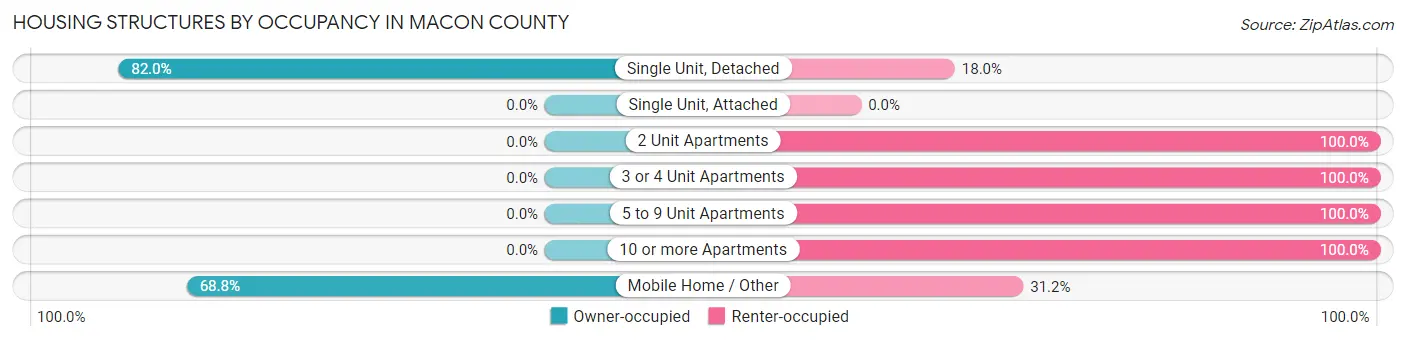
| Structure Type | Owner-occupied | Renter-occupied |
| Single Unit, Detached | 5,255 (82.0%) | 1,157 (18.0%) |
| Single Unit, Attached | 0 (0.0%) | 0 (0.0%) |
| 2 Unit Apartments | 0 (0.0%) | 297 (100.0%) |
| 3 or 4 Unit Apartments | 0 (0.0%) | 279 (100.0%) |
| 5 to 9 Unit Apartments | 0 (0.0%) | 157 (100.0%) |
| 10 or more Apartments | 0 (0.0%) | 97 (100.0%) |
| Mobile Home / Other | 1,322 (68.8%) | 600 (31.2%) |
| Total | 6,577 (71.8%) | 2,587 (28.2%) |
Housing Structures by Number of Rooms in Macon County
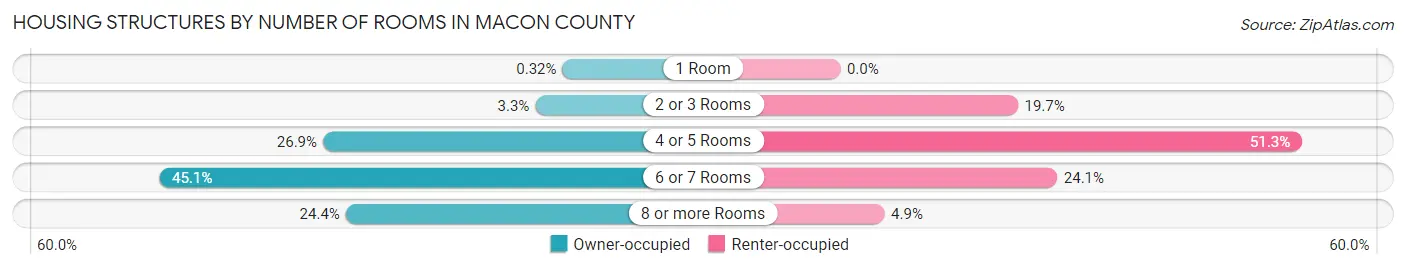
| Number of Rooms | Owner-occupied | Renter-occupied |
| 1 Room | 21 (0.3%) | 0 (0.0%) |
| 2 or 3 Rooms | 219 (3.3%) | 510 (19.7%) |
| 4 or 5 Rooms | 1,769 (26.9%) | 1,327 (51.3%) |
| 6 or 7 Rooms | 2,965 (45.1%) | 623 (24.1%) |
| 8 or more Rooms | 1,603 (24.4%) | 127 (4.9%) |
| Total | 6,577 (100.0%) | 2,587 (100.0%) |
Housing Structure by Heating Type in Macon County
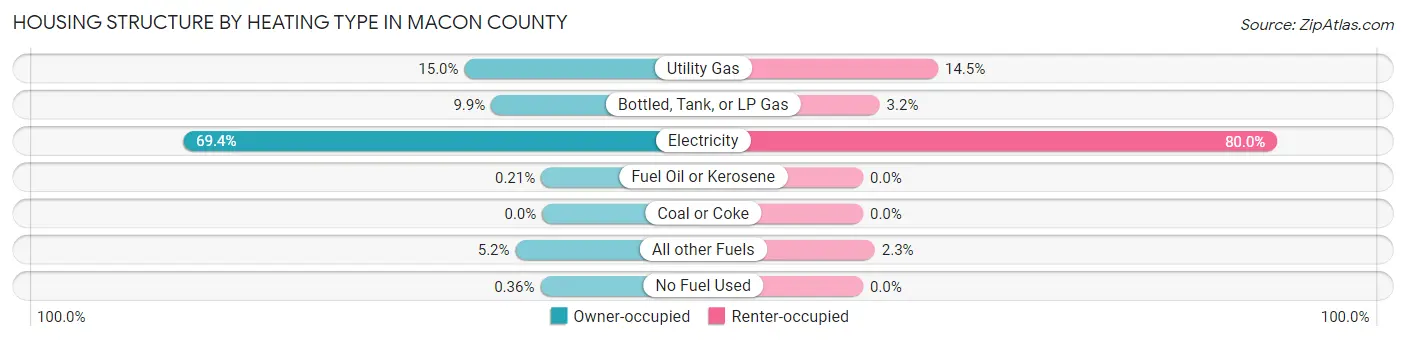
| Heating Type | Owner-occupied | Renter-occupied |
| Utility Gas | 988 (15.0%) | 375 (14.5%) |
| Bottled, Tank, or LP Gas | 649 (9.9%) | 83 (3.2%) |
| Electricity | 4,562 (69.4%) | 2,070 (80.0%) |
| Fuel Oil or Kerosene | 14 (0.2%) | 0 (0.0%) |
| Coal or Coke | 0 (0.0%) | 0 (0.0%) |
| All other Fuels | 340 (5.2%) | 59 (2.3%) |
| No Fuel Used | 24 (0.4%) | 0 (0.0%) |
| Total | 6,577 (100.0%) | 2,587 (100.0%) |
Household Vehicle Usage in Macon County
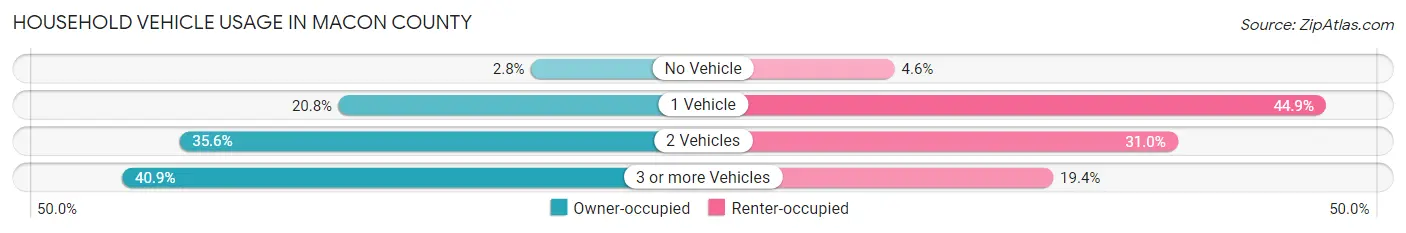
| Vehicles per Household | Owner-occupied | Renter-occupied |
| No Vehicle | 183 (2.8%) | 120 (4.6%) |
| 1 Vehicle | 1,365 (20.7%) | 1,161 (44.9%) |
| 2 Vehicles | 2,339 (35.6%) | 803 (31.0%) |
| 3 or more Vehicles | 2,690 (40.9%) | 503 (19.4%) |
| Total | 6,577 (100.0%) | 2,587 (100.0%) |
Real Estate & Mortgages in Macon County
Real Estate and Mortgage Overview in Macon County
| Characteristic | Without Mortgage | With Mortgage |
| Housing Units | 3,196 | 3,381 |
| Median Property Value | $154,000 | $212,600 |
| Median Household Income | $46,011 | $487 |
| Monthly Housing Costs | $392 | $10 |
| Real Estate Taxes | $793 | $255 |
Property Value by Mortgage Status in Macon County
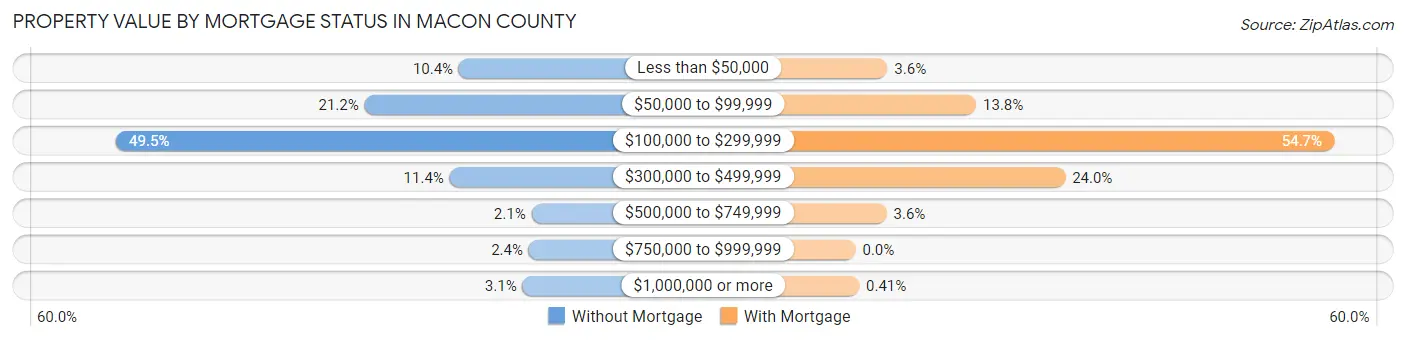
| Property Value | Without Mortgage | With Mortgage |
| Less than $50,000 | 331 (10.4%) | 123 (3.6%) |
| $50,000 to $99,999 | 676 (21.1%) | 466 (13.8%) |
| $100,000 to $299,999 | 1,583 (49.5%) | 1,848 (54.7%) |
| $300,000 to $499,999 | 365 (11.4%) | 810 (24.0%) |
| $500,000 to $749,999 | 66 (2.1%) | 120 (3.5%) |
| $750,000 to $999,999 | 76 (2.4%) | 0 (0.0%) |
| $1,000,000 or more | 99 (3.1%) | 14 (0.4%) |
| Total | 3,196 (100.0%) | 3,381 (100.0%) |
Household Income by Mortgage Status in Macon County
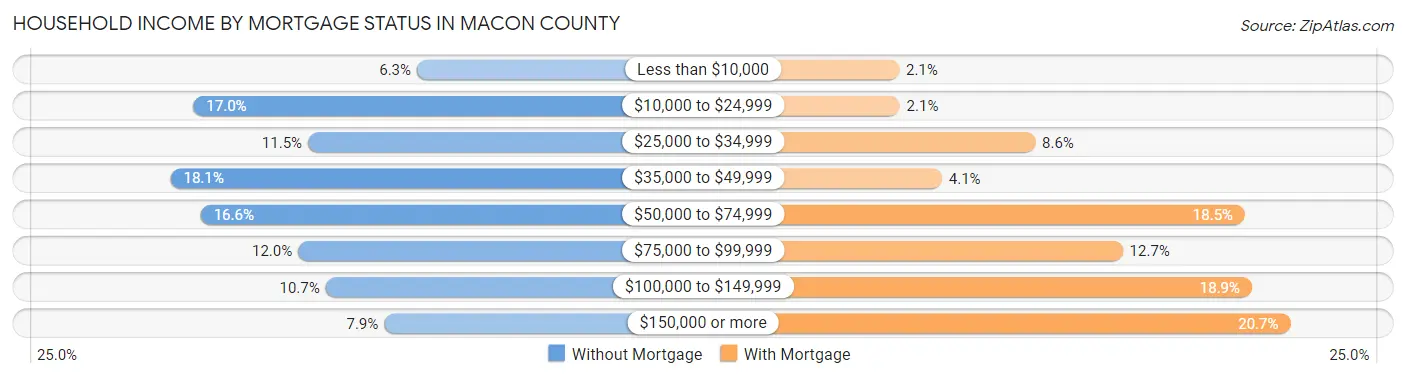
| Household Income | Without Mortgage | With Mortgage |
| Less than $10,000 | 202 (6.3%) | 70 (2.1%) |
| $10,000 to $24,999 | 542 (17.0%) | 71 (2.1%) |
| $25,000 to $34,999 | 368 (11.5%) | 289 (8.6%) |
| $35,000 to $49,999 | 577 (18.0%) | 139 (4.1%) |
| $50,000 to $74,999 | 531 (16.6%) | 627 (18.5%) |
| $75,000 to $99,999 | 383 (12.0%) | 430 (12.7%) |
| $100,000 to $149,999 | 341 (10.7%) | 638 (18.9%) |
| $150,000 or more | 252 (7.9%) | 700 (20.7%) |
| Total | 3,196 (100.0%) | 3,381 (100.0%) |
Property Value to Household Income Ratio in Macon County
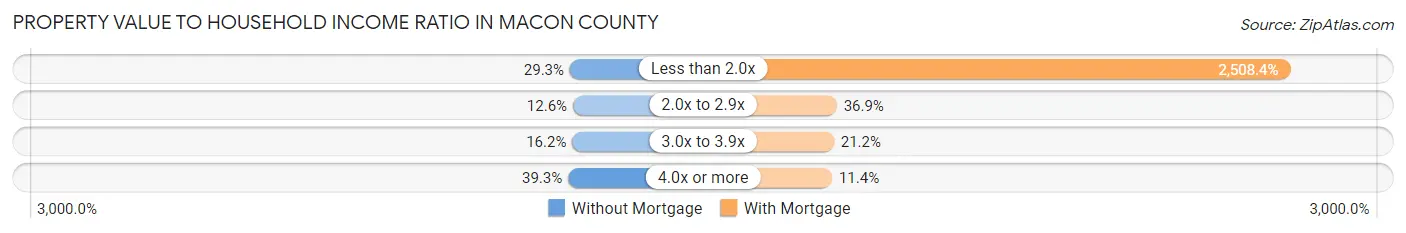
| Value-to-Income Ratio | Without Mortgage | With Mortgage |
| Less than 2.0x | 937 (29.3%) | 84,809 (2,508.4%) |
| 2.0x to 2.9x | 403 (12.6%) | 1,249 (36.9%) |
| 3.0x to 3.9x | 518 (16.2%) | 715 (21.1%) |
| 4.0x or more | 1,257 (39.3%) | 384 (11.4%) |
| Total | 3,196 (100.0%) | 3,381 (100.0%) |
Real Estate Taxes by Mortgage Status in Macon County
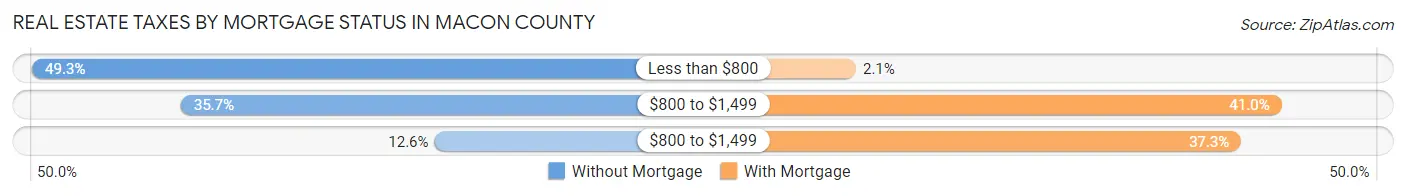
| Property Taxes | Without Mortgage | With Mortgage |
| Less than $800 | 1,576 (49.3%) | 71 (2.1%) |
| $800 to $1,499 | 1,142 (35.7%) | 1,385 (41.0%) |
| $800 to $1,499 | 402 (12.6%) | 1,260 (37.3%) |
| Total | 3,196 (100.0%) | 3,381 (100.0%) |
Health & Disability in Macon County
Health Insurance Coverage by Age in Macon County
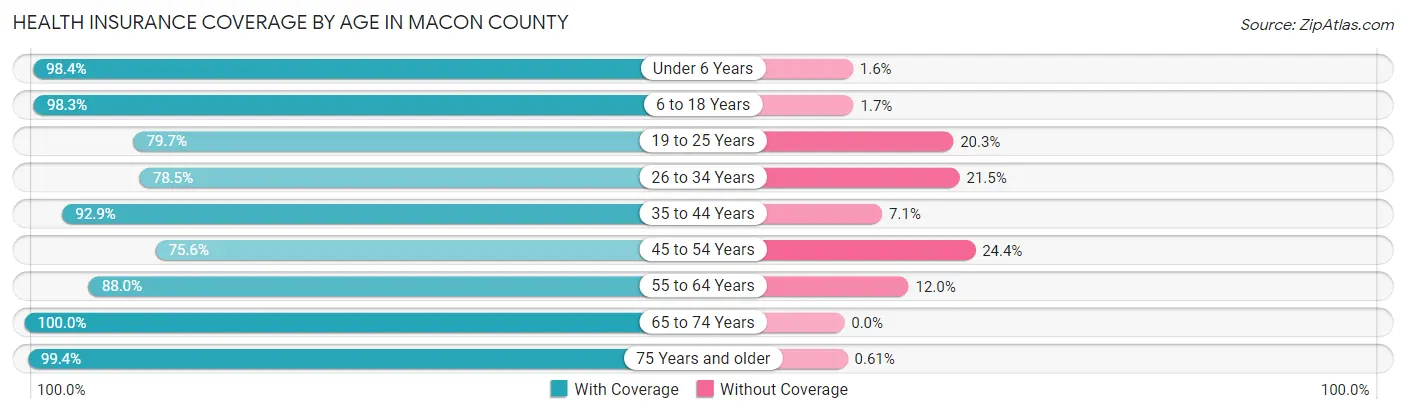
| Age Bracket | With Coverage | Without Coverage |
| Under 6 Years | 2,030 (98.4%) | 33 (1.6%) |
| 6 to 18 Years | 4,305 (98.3%) | 76 (1.7%) |
| 19 to 25 Years | 1,695 (79.7%) | 432 (20.3%) |
| 26 to 34 Years | 2,462 (78.5%) | 674 (21.5%) |
| 35 to 44 Years | 2,712 (92.9%) | 206 (7.1%) |
| 45 to 54 Years | 2,425 (75.6%) | 783 (24.4%) |
| 55 to 64 Years | 2,957 (88.0%) | 403 (12.0%) |
| 65 to 74 Years | 2,378 (100.0%) | 0 (0.0%) |
| 75 Years and older | 1,462 (99.4%) | 9 (0.6%) |
| Total | 22,426 (89.5%) | 2,616 (10.4%) |
Health Insurance Coverage by Citizenship Status in Macon County
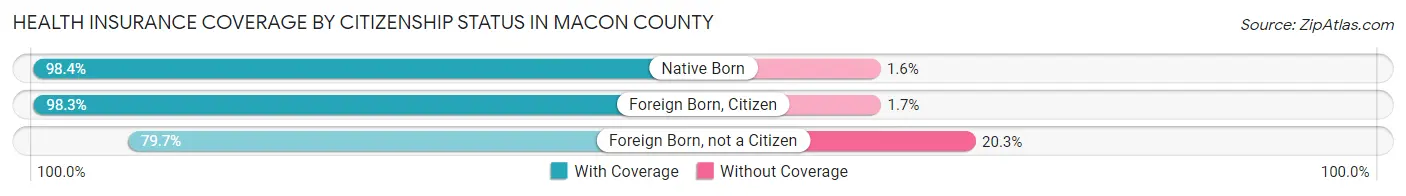
| Citizenship Status | With Coverage | Without Coverage |
| Native Born | 2,030 (98.4%) | 33 (1.6%) |
| Foreign Born, Citizen | 4,305 (98.3%) | 76 (1.7%) |
| Foreign Born, not a Citizen | 1,695 (79.7%) | 432 (20.3%) |
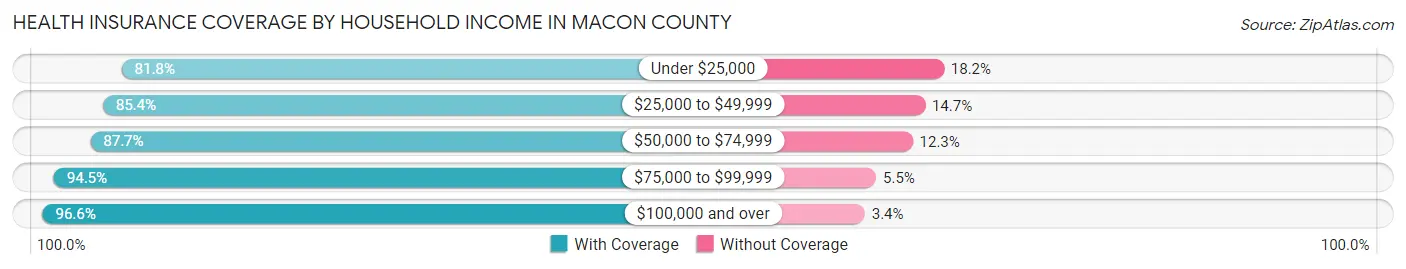
Health Insurance Coverage by Household Income in Macon County
| Household Income | With Coverage | Without Coverage |
| Under $25,000 | 3,286 (81.8%) | 730 (18.2%) |
| $25,000 to $49,999 | 5,090 (85.4%) | 874 (14.6%) |
| $50,000 to $74,999 | 4,222 (87.7%) | 594 (12.3%) |
| $75,000 to $99,999 | 3,234 (94.5%) | 188 (5.5%) |
| $100,000 and over | 6,587 (96.6%) | 230 (3.4%) |
Public vs Private Health Insurance Coverage by Age in Macon County
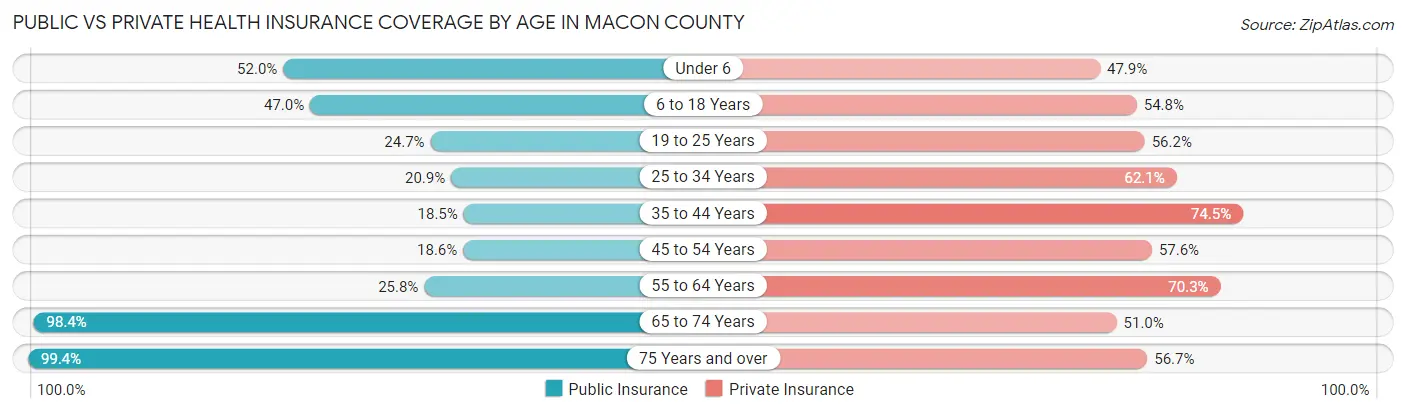
| Age Bracket | Public Insurance | Private Insurance |
| Under 6 | 1,073 (52.0%) | 989 (47.9%) |
| 6 to 18 Years | 2,060 (47.0%) | 2,399 (54.8%) |
| 19 to 25 Years | 525 (24.7%) | 1,196 (56.2%) |
| 25 to 34 Years | 654 (20.8%) | 1,948 (62.1%) |
| 35 to 44 Years | 540 (18.5%) | 2,173 (74.5%) |
| 45 to 54 Years | 597 (18.6%) | 1,847 (57.6%) |
| 55 to 64 Years | 868 (25.8%) | 2,361 (70.3%) |
| 65 to 74 Years | 2,339 (98.4%) | 1,213 (51.0%) |
| 75 Years and over | 1,462 (99.4%) | 834 (56.7%) |
| Total | 10,118 (40.4%) | 14,960 (59.7%) |
Disability Status by Sex by Age in Macon County
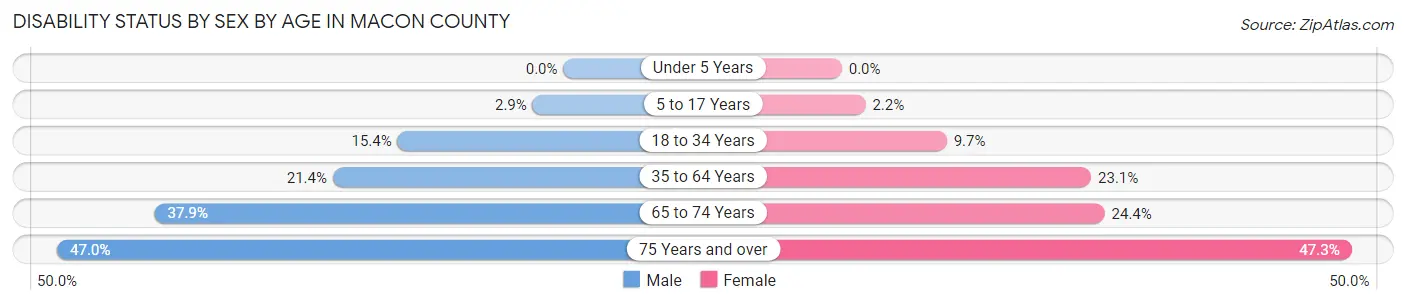
| Age Bracket | Male | Female |
| Under 5 Years | 0 (0.0%) | 0 (0.0%) |
| 5 to 17 Years | 65 (2.9%) | 52 (2.2%) |
| 18 to 34 Years | 406 (15.4%) | 277 (9.7%) |
| 35 to 64 Years | 1,023 (21.4%) | 1,089 (23.1%) |
| 65 to 74 Years | 434 (37.9%) | 301 (24.4%) |
| 75 Years and over | 264 (47.0%) | 430 (47.3%) |
Disability Class by Sex by Age in Macon County
Disability Class: Hearing Difficulty
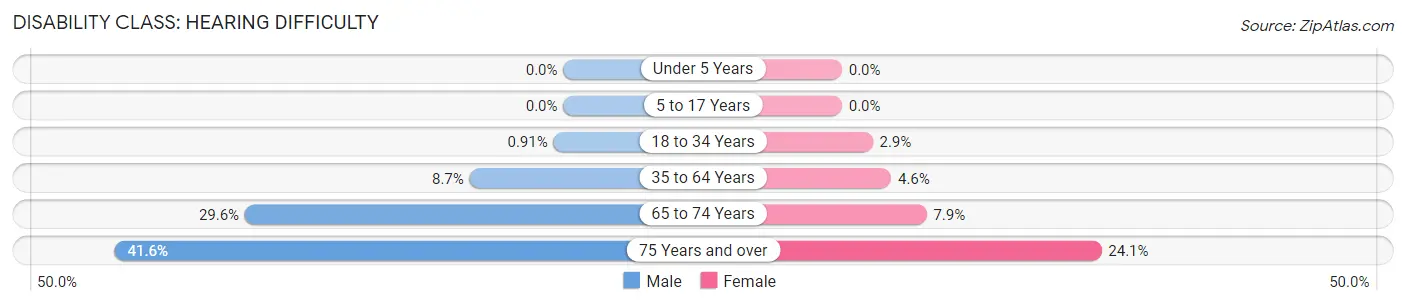
| Age Bracket | Male | Female |
| Under 5 Years | 0 (0.0%) | 0 (0.0%) |
| 5 to 17 Years | 0 (0.0%) | 0 (0.0%) |
| 18 to 34 Years | 24 (0.9%) | 81 (2.9%) |
| 35 to 64 Years | 416 (8.7%) | 215 (4.6%) |
| 65 to 74 Years | 338 (29.5%) | 97 (7.9%) |
| 75 Years and over | 234 (41.6%) | 219 (24.1%) |
Disability Class: Vision Difficulty
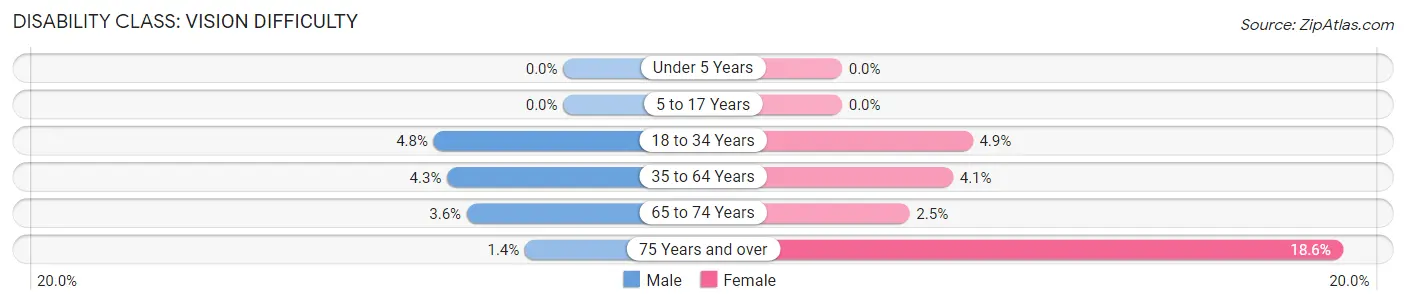
| Age Bracket | Male | Female |
| Under 5 Years | 0 (0.0%) | 0 (0.0%) |
| 5 to 17 Years | 0 (0.0%) | 0 (0.0%) |
| 18 to 34 Years | 127 (4.8%) | 138 (4.9%) |
| 35 to 64 Years | 206 (4.3%) | 194 (4.1%) |
| 65 to 74 Years | 41 (3.6%) | 31 (2.5%) |
| 75 Years and over | 8 (1.4%) | 169 (18.6%) |
Disability Class: Cognitive Difficulty
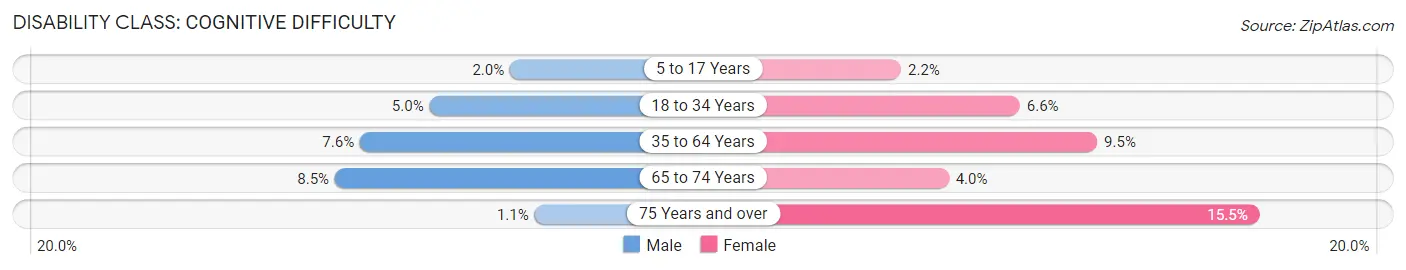
| Age Bracket | Male | Female |
| 5 to 17 Years | 45 (2.0%) | 52 (2.2%) |
| 18 to 34 Years | 131 (5.0%) | 188 (6.6%) |
| 35 to 64 Years | 361 (7.5%) | 446 (9.5%) |
| 65 to 74 Years | 97 (8.5%) | 49 (4.0%) |
| 75 Years and over | 6 (1.1%) | 141 (15.5%) |
Disability Class: Ambulatory Difficulty
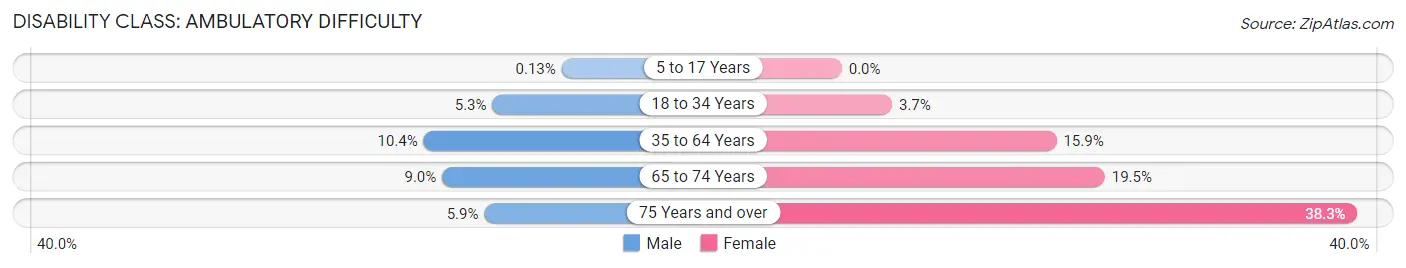
| Age Bracket | Male | Female |
| 5 to 17 Years | 3 (0.1%) | 0 (0.0%) |
| 18 to 34 Years | 139 (5.3%) | 106 (3.7%) |
| 35 to 64 Years | 496 (10.4%) | 750 (15.9%) |
| 65 to 74 Years | 103 (9.0%) | 241 (19.5%) |
| 75 Years and over | 33 (5.9%) | 348 (38.3%) |
Disability Class: Self-Care Difficulty
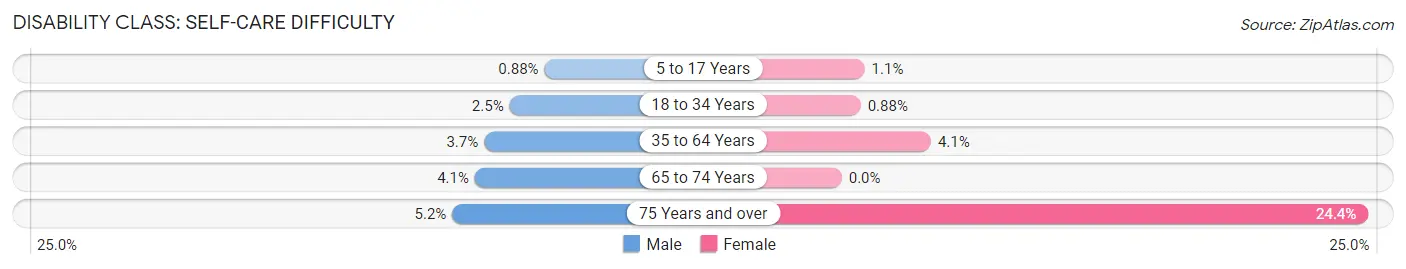
| Age Bracket | Male | Female |
| 5 to 17 Years | 20 (0.9%) | 25 (1.1%) |
| 18 to 34 Years | 66 (2.5%) | 25 (0.9%) |
| 35 to 64 Years | 176 (3.7%) | 195 (4.1%) |
| 65 to 74 Years | 47 (4.1%) | 0 (0.0%) |
| 75 Years and over | 29 (5.2%) | 222 (24.4%) |
Technology Access in Macon County
Computing Device Access in Macon County
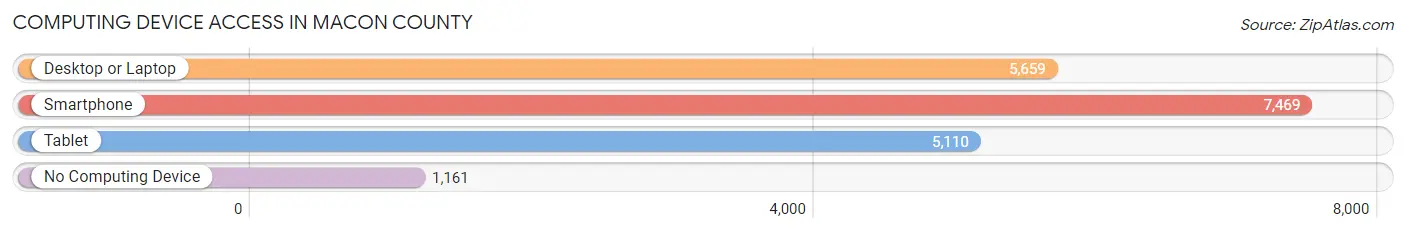
| Device Type | # Households | % Households |
| Desktop or Laptop | 5,659 | 61.8% |
| Smartphone | 7,469 | 81.5% |
| Tablet | 5,110 | 55.8% |
| No Computing Device | 1,161 | 12.7% |
| Total | 9,164 | 100.0% |
Internet Access in Macon County
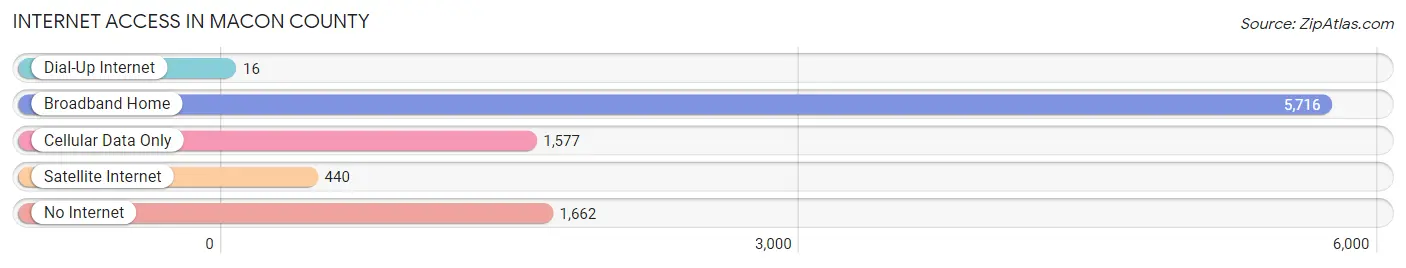
| Internet Type | # Households | % Households |
| Dial-Up Internet | 16 | 0.2% |
| Broadband Home | 5,716 | 62.4% |
| Cellular Data Only | 1,577 | 17.2% |
| Satellite Internet | 440 | 4.8% |
| No Internet | 1,662 | 18.1% |
| Total | 9,164 | 100.0% |
Macon County Summary
Macon County is located in the central part of Tennessee, in the United States. It is bordered by Sumner, Smith, Trousdale, Wilson, and Clay counties. The county seat is Lafayette, and the largest city is Red Boiling Springs. The county was established in 1842 and named after Nathaniel Macon, a Revolutionary War hero and U.S. Senator from North Carolina.
Geography
Macon County is located in the Highland Rim region of Tennessee. The county is mostly hilly and has an elevation of 1,000 feet above sea level. The county is drained by the Red River, which flows through the county from east to west. The county is also home to several small lakes, including Cordell Hull Lake, which is located in the northern part of the county.
The county has a total area of 517 square miles, of which 514 square miles is land and 3 square miles is water. The county is mostly rural, with only a few small towns and villages.
Demographics
As of the 2010 census, Macon County had a population of 22,248. The racial makeup of the county was 92.3% White, 5.2% African American, 0.3% Native American, 0.2% Asian, 0.1% Pacific Islander, 0.7% from other races, and 1.2% from two or more races. Hispanic or Latino of any race were 1.7% of the population.
The median income for a household in the county was $30,945, and the median income for a family was $37,945. The per capita income for the county was $16,845. About 17.2% of families and 21.2% of the population were below the poverty line, including 28.2% of those under age 18 and 17.2% of those age 65 or over.
Economy
Macon County is largely rural and agricultural. The county is home to several small farms, which produce a variety of crops, including corn, soybeans, wheat, hay, and tobacco. The county is also home to several small manufacturing companies, which produce a variety of products, including furniture, clothing, and automotive parts.
The county is also home to several tourist attractions, including the Red Boiling Springs Resort, which is a popular destination for visitors from all over the country. The county is also home to several state parks, including Cordell Hull Lake State Park, which offers camping, fishing, and other recreational activities.
Conclusion
Macon County is a rural county located in the central part of Tennessee. The county is mostly hilly and has an elevation of 1,000 feet above sea level. The county is mostly rural, with only a few small towns and villages. As of the 2010 census, Macon County had a population of 22,248. The county is largely rural and agricultural, with several small farms and manufacturing companies. The county is also home to several tourist attractions and state parks.
Common Questions
What is Per Capita Income in Macon County?
Per Capita income in Macon County is $24,979.
What is the Median Family Income in Macon County?
Median Family Income in Macon County is $67,944.
What is the Median Household income in Macon County?
Median Household Income in Macon County is $51,215.
What is Income or Wage Gap in Macon County?
Income or Wage Gap in Macon County is 18.1%.
Women in Macon County earn 81.9 cents for every dollar earned by a man.
What is Family Income Deficit in Macon County?
Family Income Deficit in Macon County is $11,605.
Families that are below poverty line in Macon County earn $11,605 less on average than the poverty threshold level.
What is Inequality or Gini Index in Macon County?
Inequality or Gini Index in Macon County is 0.42.
What is the Total Population of Macon County?
Total Population of Macon County is 25,365.
What is the Total Male Population of Macon County?
Total Male Population of Macon County is 12,408.
What is the Total Female Population of Macon County?
Total Female Population of Macon County is 12,957.
What is the Ratio of Males per 100 Females in Macon County?
There are 95.76 Males per 100 Females in Macon County.
What is the Ratio of Females per 100 Males in Macon County?
There are 104.42 Females per 100 Males in Macon County.
What is the Median Population Age in Macon County?
Median Population Age in Macon County is 39.1 Years.
What is the Average Family Size in Macon County
Average Family Size in Macon County is 3.3 People.
What is the Average Household Size in Macon County
Average Household Size in Macon County is 2.7 People.
How Large is the Labor Force in Macon County?
There are 12,287 People in the Labor Forcein in Macon County.
What is the Percentage of People in the Labor Force in Macon County?
61.7% of People are in the Labor Force in Macon County.
What is the Unemployment Rate in Macon County?
Unemployment Rate in Macon County is 3.6%.