Hardeman County, TN Map & Demographics
Hardeman County Map
Hardeman County Overview
$22,098
PER CAPITA INCOME
$62,422
AVG FAMILY INCOME
$43,566
AVG HOUSEHOLD INCOME
17.4%
WAGE / INCOME GAP [ % ]
82.6¢/ $1
WAGE / INCOME GAP [ $ ]
$10,455
FAMILY INCOME DEFICIT
0.43
INEQUALITY / GINI INDEX
25,519
TOTAL POPULATION
14,142
MALE POPULATION
11,377
FEMALE POPULATION
124.30
MALES / 100 FEMALES
80.45
FEMALES / 100 MALES
40.7
MEDIAN AGE
3.2
AVG FAMILY SIZE
2.4
AVG HOUSEHOLD SIZE
10,383
LABOR FORCE [ PEOPLE ]
48.7%
PERCENT IN LABOR FORCE
12.8%
UNEMPLOYMENT RATE
Income in Hardeman County
Income Overview in Hardeman County
Per Capita Income in Hardeman County is $22,098, while median incomes of families and households are $62,422 and $43,566 respectively.
| Characteristic | Number | Measure |
| Per Capita Income | 25,519 | $22,098 |
| Median Family Income | 5,549 | $62,422 |
| Mean Family Income | 5,549 | $74,278 |
| Median Household Income | 9,009 | $43,566 |
| Mean Household Income | 9,009 | $58,636 |
| Income Deficit | 5,549 | $10,455 |
| Wage / Income Gap (%) | 25,519 | 17.35% |
| Wage / Income Gap ($) | 25,519 | 82.65¢ per $1 |
| Gini / Inequality Index | 25,519 | 0.43 |
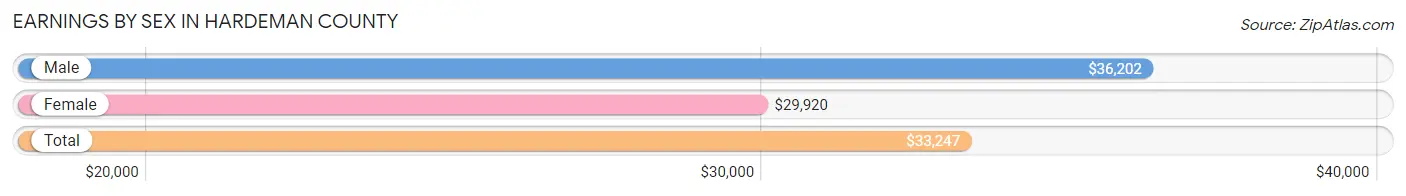
Earnings by Sex in Hardeman County
Average Earnings in Hardeman County are $33,247, $36,202 for men and $29,920 for women, a difference of 17.3%.
| Sex | Number | Average Earnings |
| Male | 5,386 (51.7%) | $36,202 |
| Female | 5,021 (48.2%) | $29,920 |
| Total | 10,407 (100.0%) | $33,247 |
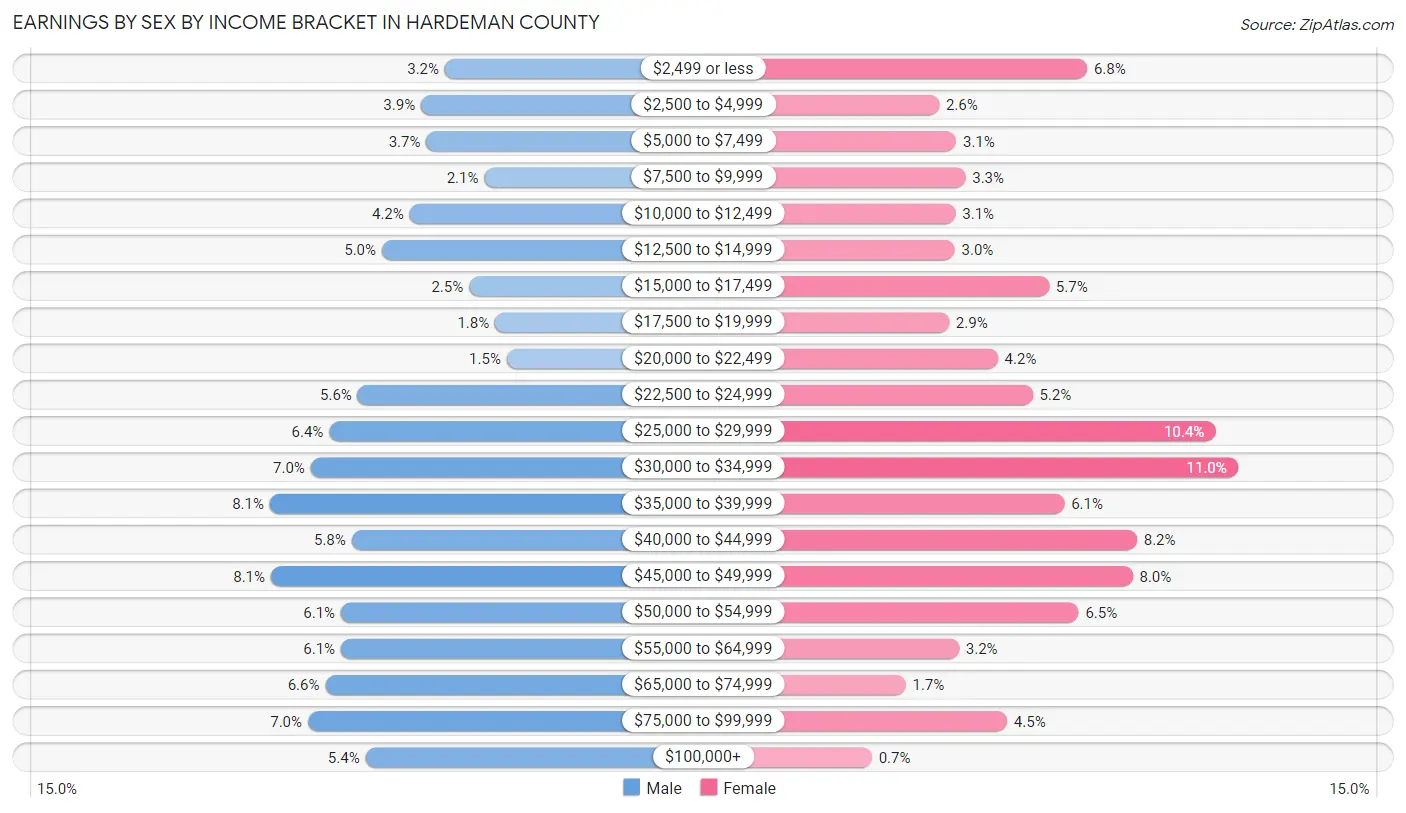
Earnings by Sex by Income Bracket in Hardeman County
The most common earnings brackets in Hardeman County are $35,000 to $39,999 for men (437 | 8.1%) and $30,000 to $34,999 for women (553 | 11.0%).
| Income | Male | Female |
| $2,499 or less | 172 (3.2%) | 339 (6.8%) |
| $2,500 to $4,999 | 208 (3.9%) | 130 (2.6%) |
| $5,000 to $7,499 | 200 (3.7%) | 154 (3.1%) |
| $7,500 to $9,999 | 112 (2.1%) | 167 (3.3%) |
| $10,000 to $12,499 | 225 (4.2%) | 153 (3.0%) |
| $12,500 to $14,999 | 267 (5.0%) | 152 (3.0%) |
| $15,000 to $17,499 | 135 (2.5%) | 285 (5.7%) |
| $17,500 to $19,999 | 96 (1.8%) | 144 (2.9%) |
| $20,000 to $22,499 | 78 (1.5%) | 213 (4.2%) |
| $22,500 to $24,999 | 304 (5.6%) | 262 (5.2%) |
| $25,000 to $29,999 | 347 (6.4%) | 521 (10.4%) |
| $30,000 to $34,999 | 375 (7.0%) | 553 (11.0%) |
| $35,000 to $39,999 | 437 (8.1%) | 307 (6.1%) |
| $40,000 to $44,999 | 313 (5.8%) | 409 (8.2%) |
| $45,000 to $49,999 | 435 (8.1%) | 403 (8.0%) |
| $50,000 to $54,999 | 329 (6.1%) | 327 (6.5%) |
| $55,000 to $64,999 | 329 (6.1%) | 158 (3.2%) |
| $65,000 to $74,999 | 353 (6.6%) | 83 (1.7%) |
| $75,000 to $99,999 | 379 (7.0%) | 226 (4.5%) |
| $100,000+ | 292 (5.4%) | 35 (0.7%) |
| Total | 5,386 (100.0%) | 5,021 (100.0%) |
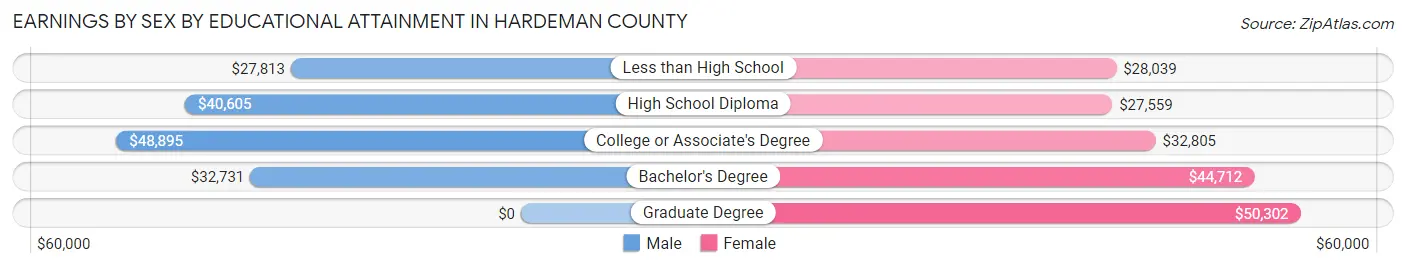
Earnings by Sex by Educational Attainment in Hardeman County
Average earnings in Hardeman County are $42,320 for men and $31,441 for women, a difference of 25.7%. Men with an educational attainment of college or associate's degree enjoy the highest average annual earnings of $48,895, while those with less than high school education earn the least with $27,813. Women with an educational attainment of graduate degree earn the most with the average annual earnings of $50,302, while those with high school diploma education have the smallest earnings of $27,559.
| Educational Attainment | Male Income | Female Income |
| Less than High School | $27,813 | $28,039 |
| High School Diploma | $40,605 | $27,559 |
| College or Associate's Degree | $48,895 | $32,805 |
| Bachelor's Degree | $32,731 | $44,712 |
| Graduate Degree | - | - |
| Total | $42,320 | $31,441 |
Family Income in Hardeman County
Family Income Brackets in Hardeman County
According to the Hardeman County family income data, there are 1,043 families falling into the $50,000 to $74,999 income range, which is the most common income bracket and makes up 18.8% of all families. Conversely, the $200,000+ income bracket is the least frequent group with only 189 families (3.4%) belonging to this category.
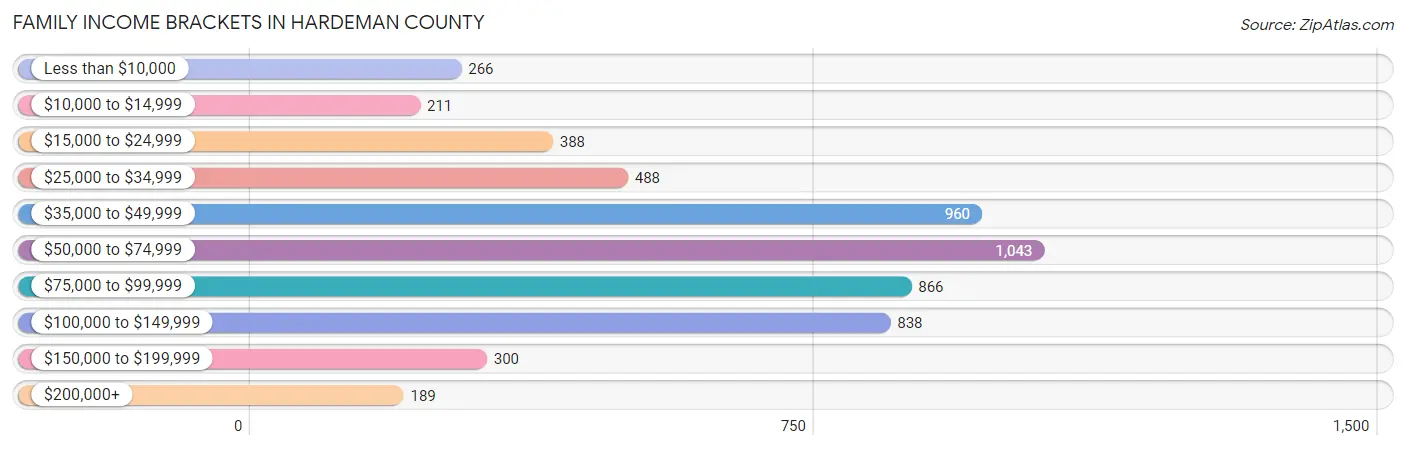
| Income Bracket | # Families | % Families |
| Less than $10,000 | 266 | 4.8% |
| $10,000 to $14,999 | 211 | 3.8% |
| $15,000 to $24,999 | 388 | 7.0% |
| $25,000 to $34,999 | 488 | 8.8% |
| $35,000 to $49,999 | 960 | 17.3% |
| $50,000 to $74,999 | 1,043 | 18.8% |
| $75,000 to $99,999 | 866 | 15.6% |
| $100,000 to $149,999 | 838 | 15.1% |
| $150,000 to $199,999 | 300 | 5.4% |
| $200,000+ | 189 | 3.4% |
Family Income by Famaliy Size in Hardeman County
6-person families (31 | 0.6%) account for the highest median family income in Hardeman County with $163,750 per family, while 2-person families (3,148 | 56.7%) have the highest median income of $28,938 per family member.
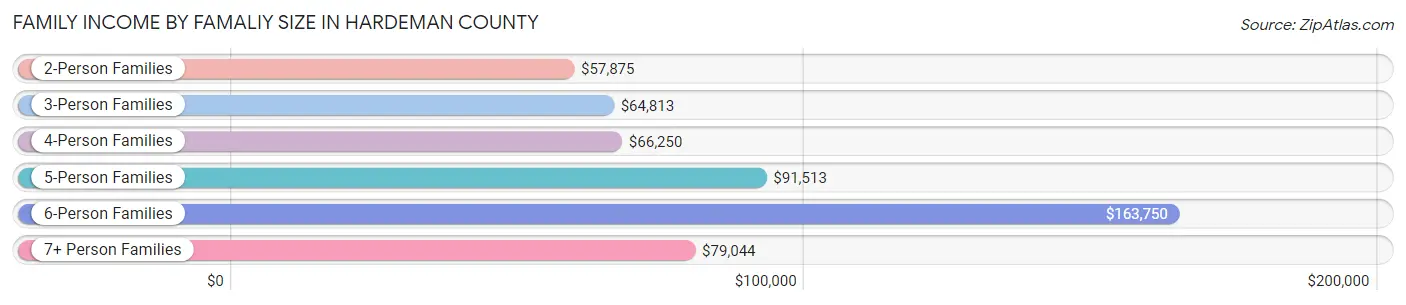
| Income Bracket | # Families | Median Income |
| 2-Person Families | 3,148 (56.7%) | $57,875 |
| 3-Person Families | 955 (17.2%) | $64,813 |
| 4-Person Families | 948 (17.1%) | $66,250 |
| 5-Person Families | 404 (7.3%) | $91,513 |
| 6-Person Families | 31 (0.6%) | $163,750 |
| 7+ Person Families | 63 (1.1%) | $79,044 |
| Total | 5,549 (100.0%) | $62,422 |
Family Income by Number of Earners in Hardeman County
The median family income in Hardeman County is $62,422, with families comprising 3+ earners (438) having the highest median family income of $141,667, while families with no earners (1,077) have the lowest median family income of $38,607, accounting for 7.9% and 19.4% of families, respectively.
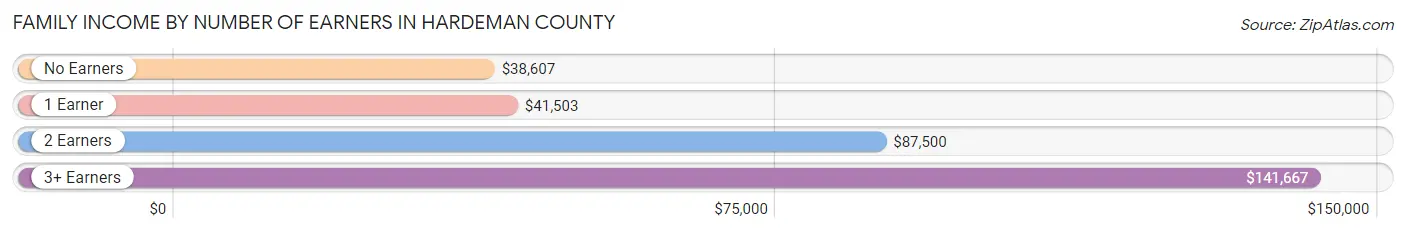
| Number of Earners | # Families | Median Income |
| No Earners | 1,077 (19.4%) | $38,607 |
| 1 Earner | 2,088 (37.6%) | $41,503 |
| 2 Earners | 1,946 (35.1%) | $87,500 |
| 3+ Earners | 438 (7.9%) | $141,667 |
| Total | 5,549 (100.0%) | $62,422 |
Household Income in Hardeman County
Household Income Brackets in Hardeman County
With 1,658 households falling in the category, the $35,000 to $49,999 income range is the most frequent in Hardeman County, accounting for 18.4% of all households. In contrast, only 189 households (2.1%) fall into the $200,000+ income bracket, making it the least populous group.
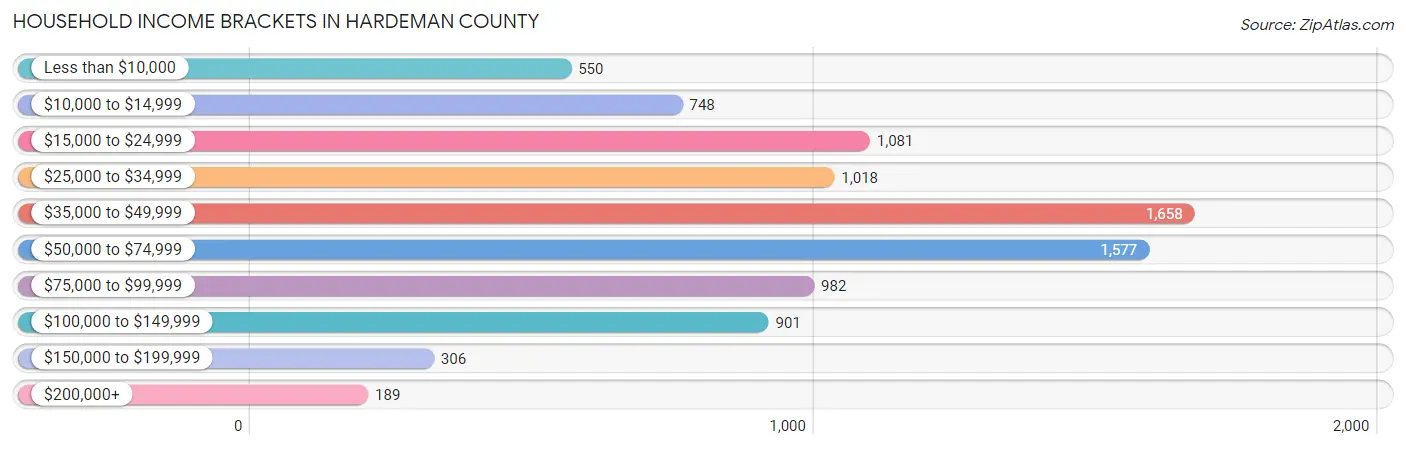
| Income Bracket | # Households | % Households |
| Less than $10,000 | 550 | 6.1% |
| $10,000 to $14,999 | 748 | 8.3% |
| $15,000 to $24,999 | 1,081 | 12.0% |
| $25,000 to $34,999 | 1,018 | 11.3% |
| $35,000 to $49,999 | 1,658 | 18.4% |
| $50,000 to $74,999 | 1,577 | 17.5% |
| $75,000 to $99,999 | 982 | 10.9% |
| $100,000 to $149,999 | 901 | 10.0% |
| $150,000 to $199,999 | 306 | 3.4% |
| $200,000+ | 189 | 2.1% |
Household Income by Householder Age in Hardeman County
The median household income in Hardeman County is $43,566, with the highest median household income of $46,558 found in the 45 to 64 years age bracket for the primary householder. A total of 3,772 households (41.9%) fall into this category. Meanwhile, the 15 to 24 years age bracket for the primary householder has the lowest median household income of $30,500, with 164 households (1.8%) in this group.
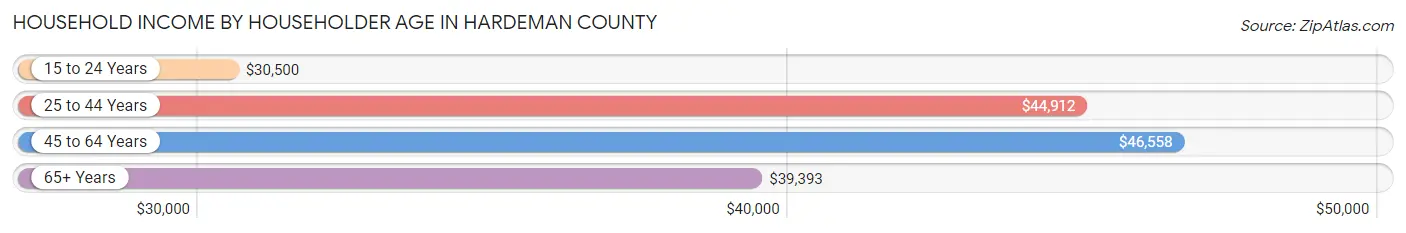
| Income Bracket | # Households | Median Income |
| 15 to 24 Years | 164 (1.8%) | $30,500 |
| 25 to 44 Years | 2,249 (25.0%) | $44,912 |
| 45 to 64 Years | 3,772 (41.9%) | $46,558 |
| 65+ Years | 2,824 (31.4%) | $39,393 |
| Total | 9,009 (100.0%) | $43,566 |
Poverty in Hardeman County
Income Below Poverty by Sex and Age in Hardeman County
With 13.7% poverty level for males and 18.3% for females among the residents of Hardeman County, 6 to 11 year old males and 15 year old females are the most vulnerable to poverty, with 268 males (32.2%) and 82 females (57.3%) in their respective age groups living below the poverty level.
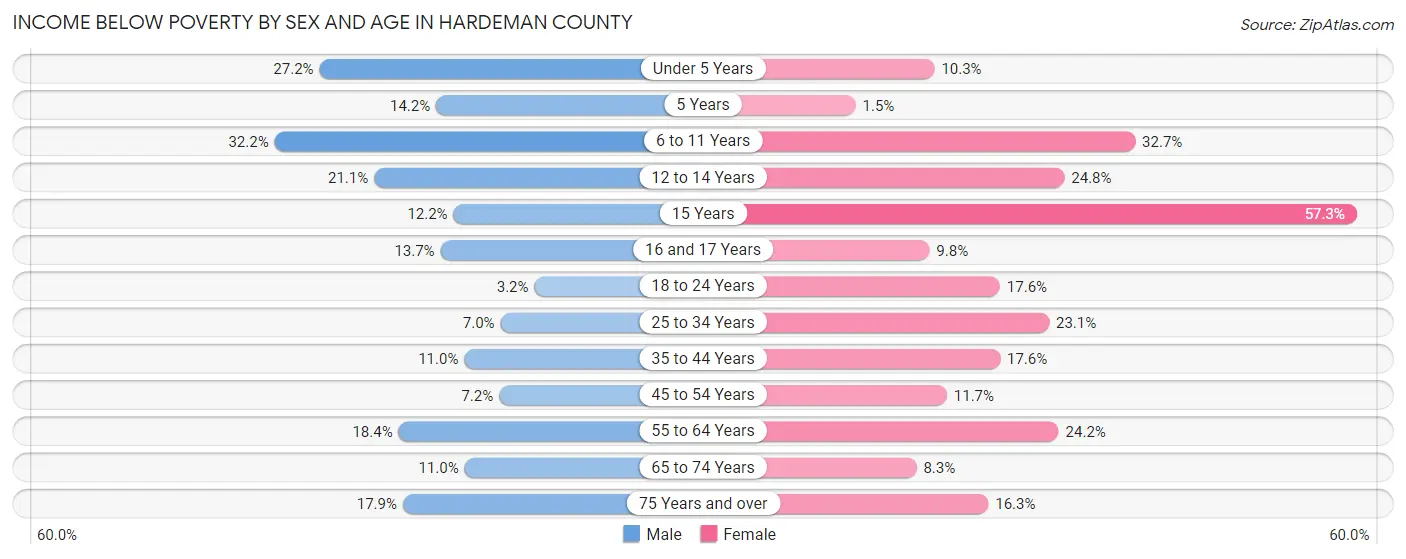
| Age Bracket | Male | Female |
| Under 5 Years | 166 (27.2%) | 55 (10.3%) |
| 5 Years | 19 (14.2%) | 1 (1.5%) |
| 6 to 11 Years | 268 (32.2%) | 212 (32.7%) |
| 12 to 14 Years | 78 (21.1%) | 151 (24.8%) |
| 15 Years | 12 (12.2%) | 82 (57.3%) |
| 16 and 17 Years | 49 (13.7%) | 29 (9.8%) |
| 18 to 24 Years | 36 (3.2%) | 149 (17.6%) |
| 25 to 34 Years | 114 (7.0%) | 291 (23.1%) |
| 35 to 44 Years | 83 (11.0%) | 225 (17.6%) |
| 45 to 54 Years | 85 (7.2%) | 152 (11.7%) |
| 55 to 64 Years | 278 (18.4%) | 405 (24.1%) |
| 65 to 74 Years | 144 (11.0%) | 122 (8.3%) |
| 75 Years and over | 128 (17.9%) | 181 (16.3%) |
| Total | 1,460 (13.7%) | 2,055 (18.3%) |
Income Above Poverty by Sex and Age in Hardeman County
According to the poverty statistics in Hardeman County, males aged 18 to 24 years and females aged 5 years are the age groups that are most secure financially, with 96.8% of males and 98.5% of females in these age groups living above the poverty line.
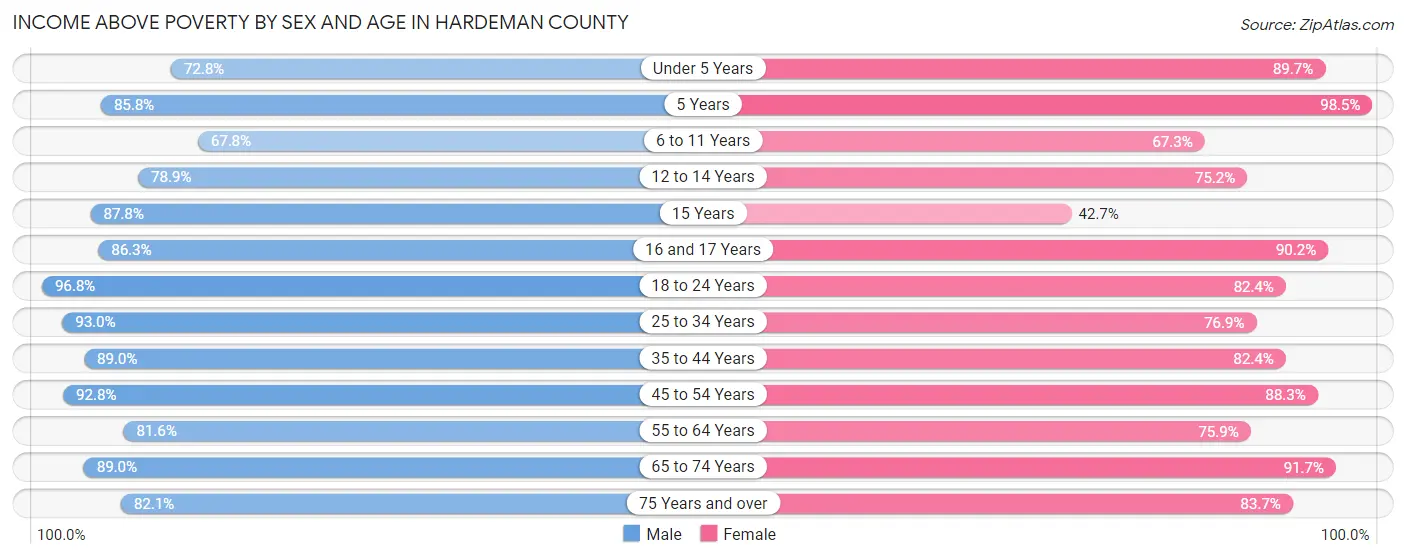
| Age Bracket | Male | Female |
| Under 5 Years | 445 (72.8%) | 478 (89.7%) |
| 5 Years | 115 (85.8%) | 64 (98.5%) |
| 6 to 11 Years | 565 (67.8%) | 437 (67.3%) |
| 12 to 14 Years | 292 (78.9%) | 458 (75.2%) |
| 15 Years | 86 (87.8%) | 61 (42.7%) |
| 16 and 17 Years | 309 (86.3%) | 268 (90.2%) |
| 18 to 24 Years | 1,079 (96.8%) | 697 (82.4%) |
| 25 to 34 Years | 1,513 (93.0%) | 970 (76.9%) |
| 35 to 44 Years | 669 (89.0%) | 1,052 (82.4%) |
| 45 to 54 Years | 1,102 (92.8%) | 1,147 (88.3%) |
| 55 to 64 Years | 1,236 (81.6%) | 1,272 (75.8%) |
| 65 to 74 Years | 1,165 (89.0%) | 1,344 (91.7%) |
| 75 Years and over | 588 (82.1%) | 928 (83.7%) |
| Total | 9,164 (86.3%) | 9,176 (81.7%) |
Income Below Poverty Among Married-Couple Families in Hardeman County
The poverty statistics for married-couple families in Hardeman County show that 4.6% or 168 of the total 3,674 families live below the poverty line. Families with 5 or more children have the highest poverty rate of 47.6%, comprising of 10 families. On the other hand, families with 3 or 4 children have the lowest poverty rate of 2.7%, which includes 5 families.
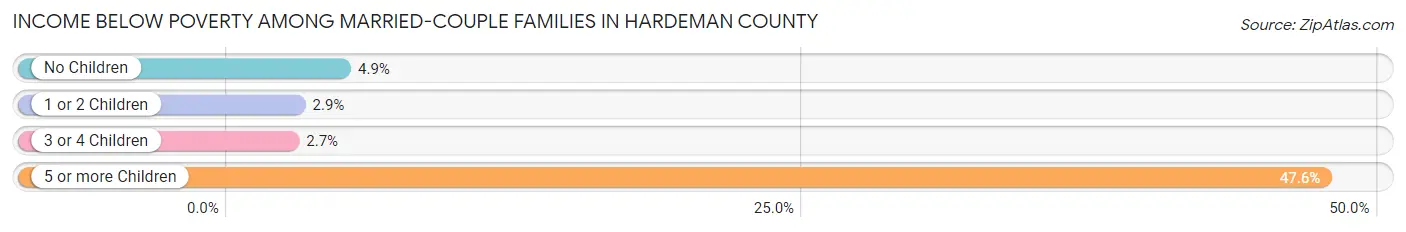
| Children | Above Poverty | Below Poverty |
| No Children | 2,454 (95.1%) | 127 (4.9%) |
| 1 or 2 Children | 859 (97.1%) | 26 (2.9%) |
| 3 or 4 Children | 182 (97.3%) | 5 (2.7%) |
| 5 or more Children | 11 (52.4%) | 10 (47.6%) |
| Total | 3,506 (95.4%) | 168 (4.6%) |
Income Below Poverty Among Single-Parent Households in Hardeman County
According to the poverty data in Hardeman County, 24.3% or 75 single-father households and 33.2% or 520 single-mother households are living below the poverty line. Among single-father households, those with 1 or 2 children have the highest poverty rate, with 35 households (38.5%) experiencing poverty. Likewise, among single-mother households, those with 5 or more children have the highest poverty rate, with 13 households (100.0%) falling below the poverty line.
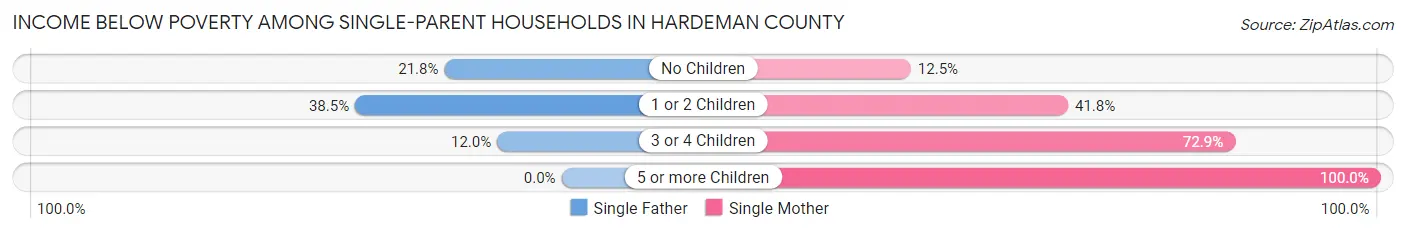
| Children | Single Father | Single Mother |
| No Children | 31 (21.8%) | 83 (12.5%) |
| 1 or 2 Children | 35 (38.5%) | 303 (41.8%) |
| 3 or 4 Children | 9 (12.0%) | 121 (72.9%) |
| 5 or more Children | 0 (0.0%) | 13 (100.0%) |
| Total | 75 (24.3%) | 520 (33.2%) |
Income Below Poverty Among Married-Couple vs Single-Parent Households in Hardeman County
The poverty data for Hardeman County shows that 168 of the married-couple family households (4.6%) and 595 of the single-parent households (31.7%) are living below the poverty level. Within the married-couple family households, those with 5 or more children have the highest poverty rate, with 10 households (47.6%) falling below the poverty line. Among the single-parent households, those with 5 or more children have the highest poverty rate, with 13 household (100.0%) living below poverty.
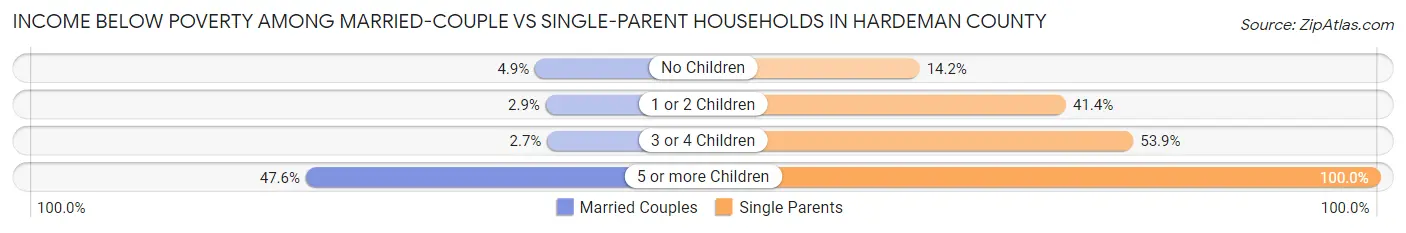
| Children | Married-Couple Families | Single-Parent Households |
| No Children | 127 (4.9%) | 114 (14.2%) |
| 1 or 2 Children | 26 (2.9%) | 338 (41.4%) |
| 3 or 4 Children | 5 (2.7%) | 130 (53.9%) |
| 5 or more Children | 10 (47.6%) | 13 (100.0%) |
| Total | 168 (4.6%) | 595 (31.7%) |
Race in Hardeman County
The most populous races in Hardeman County are White / Caucasian (13,918 | 54.5%), Black / African American (10,135 | 39.7%), and Two or more Races (1,101 | 4.3%).
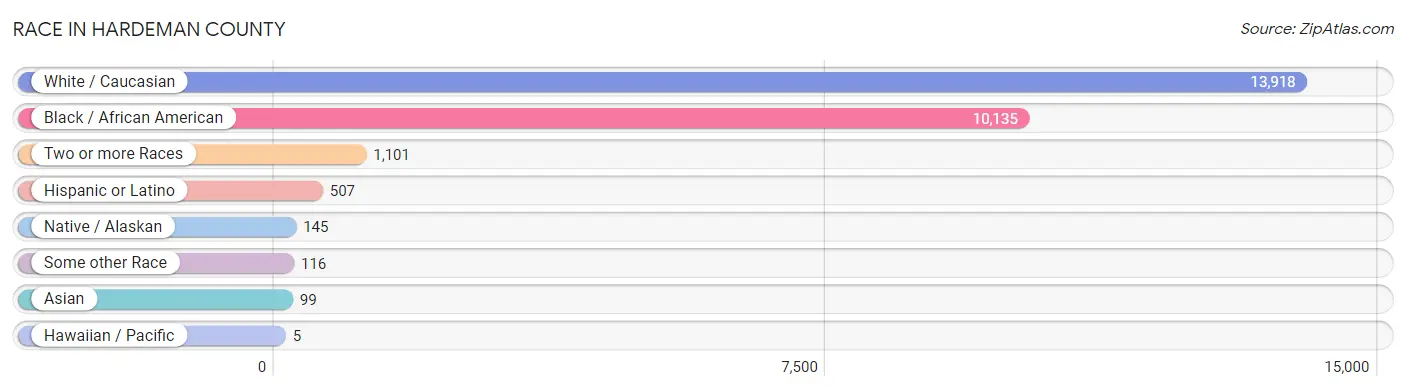
| Race | # Population | % Population |
| Asian | 99 | 0.4% |
| Black / African American | 10,135 | 39.7% |
| Hawaiian / Pacific | 5 | 0.0% |
| Hispanic or Latino | 507 | 2.0% |
| Native / Alaskan | 145 | 0.6% |
| White / Caucasian | 13,918 | 54.5% |
| Two or more Races | 1,101 | 4.3% |
| Some other Race | 116 | 0.4% |
| Total | 25,519 | 100.0% |
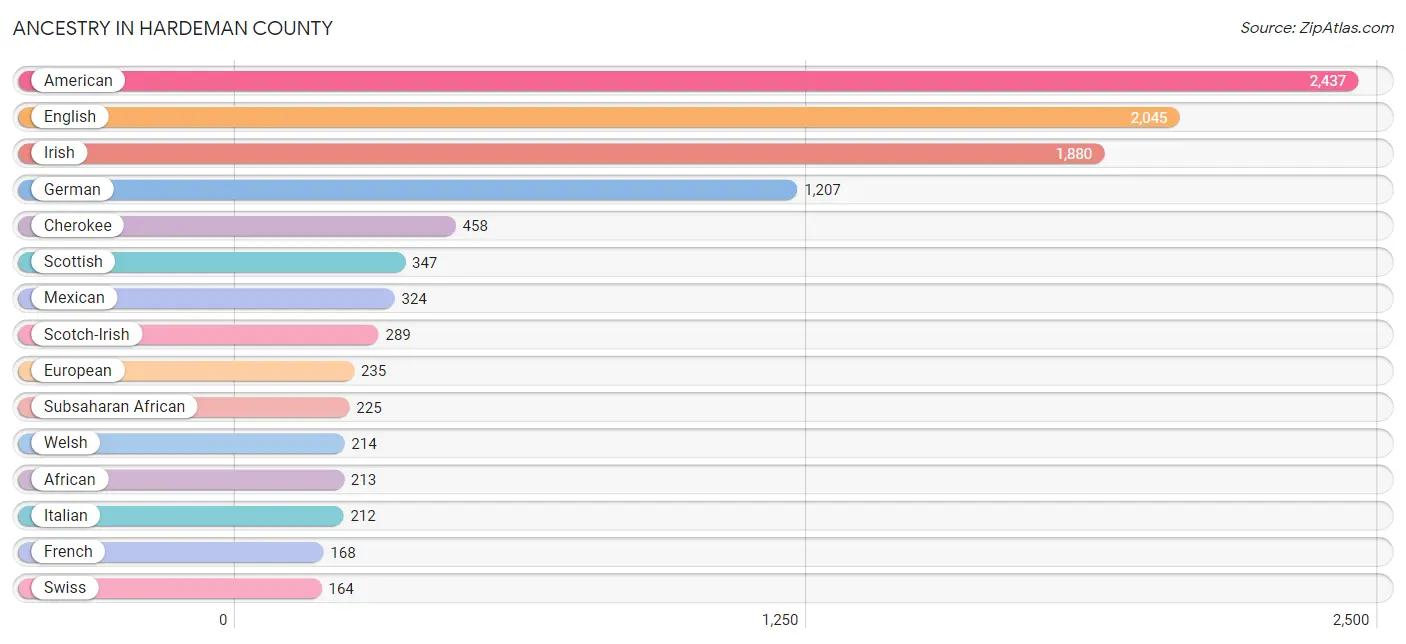
Ancestry in Hardeman County
The most populous ancestries reported in Hardeman County are American (2,437 | 9.6%), English (2,045 | 8.0%), Irish (1,880 | 7.4%), German (1,207 | 4.7%), and Cherokee (458 | 1.8%), together accounting for 31.5% of all Hardeman County residents.
| Ancestry | # Population | % Population |
| African | 213 | 0.8% |
| American | 2,437 | 9.6% |
| Apache | 6 | 0.0% |
| Arab | 7 | 0.0% |
| Australian | 11 | 0.0% |
| Austrian | 8 | 0.0% |
| Blackfeet | 76 | 0.3% |
| British | 43 | 0.2% |
| Burmese | 4 | 0.0% |
| Cajun | 6 | 0.0% |
| Central American | 26 | 0.1% |
| Cherokee | 458 | 1.8% |
| Chickasaw | 1 | 0.0% |
| Choctaw | 48 | 0.2% |
| Colombian | 14 | 0.1% |
| Comanche | 19 | 0.1% |
| Cuban | 5 | 0.0% |
| Danish | 11 | 0.0% |
| Dutch | 90 | 0.4% |
| Egyptian | 7 | 0.0% |
| English | 2,045 | 8.0% |
| European | 235 | 0.9% |
| Finnish | 8 | 0.0% |
| French | 168 | 0.7% |
| French Canadian | 26 | 0.1% |
| German | 1,207 | 4.7% |
| Greek | 18 | 0.1% |
| Guatemalan | 13 | 0.1% |
| Haitian | 16 | 0.1% |
| Hungarian | 6 | 0.0% |
| Icelander | 6 | 0.0% |
| Indian (Asian) | 16 | 0.1% |
| Irish | 1,880 | 7.4% |
| Iroquois | 6 | 0.0% |
| Italian | 212 | 0.8% |
| Jamaican | 56 | 0.2% |
| Latvian | 1 | 0.0% |
| Malaysian | 7 | 0.0% |
| Mexican | 324 | 1.3% |
| Mexican American Indian | 5 | 0.0% |
| Nigerian | 12 | 0.1% |
| Northern European | 17 | 0.1% |
| Norwegian | 6 | 0.0% |
| Pakistani | 129 | 0.5% |
| Peruvian | 37 | 0.1% |
| Polish | 34 | 0.1% |
| Portuguese | 12 | 0.1% |
| Puerto Rican | 82 | 0.3% |
| Romanian | 6 | 0.0% |
| Russian | 14 | 0.1% |
| Scandinavian | 40 | 0.2% |
| Scotch-Irish | 289 | 1.1% |
| Scottish | 347 | 1.4% |
| Sioux | 43 | 0.2% |
| Slovak | 4 | 0.0% |
| South American | 51 | 0.2% |
| Spanish | 11 | 0.0% |
| Subsaharan African | 225 | 0.9% |
| Swedish | 51 | 0.2% |
| Swiss | 164 | 0.6% |
| Welsh | 214 | 0.8% |
| Yugoslavian | 3 | 0.0% | View All 62 Rows |
Immigrants in Hardeman County
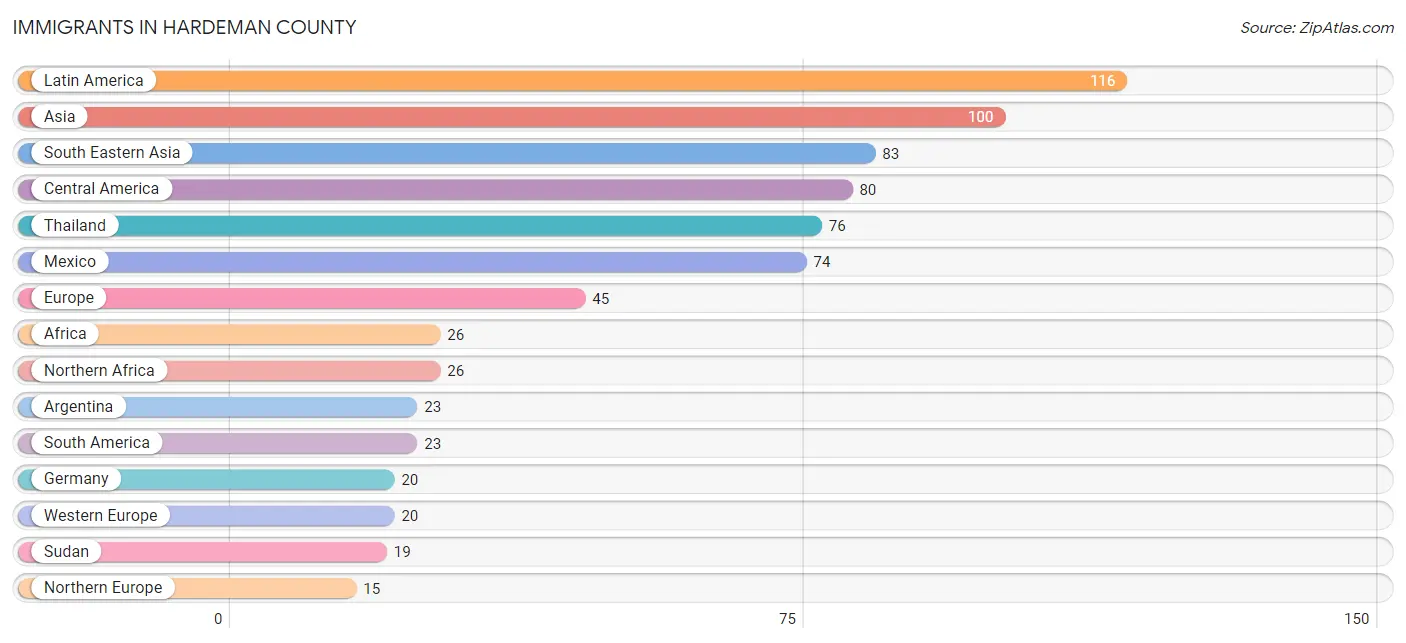
The most numerous immigrant groups reported in Hardeman County came from Latin America (116 | 0.4%), Asia (100 | 0.4%), South Eastern Asia (83 | 0.3%), Central America (80 | 0.3%), and Thailand (76 | 0.3%), together accounting for 1.8% of all Hardeman County residents.
| Immigration Origin | # Population | % Population |
| Africa | 26 | 0.1% |
| Argentina | 23 | 0.1% |
| Asia | 100 | 0.4% |
| Australia | 3 | 0.0% |
| Bosnia and Herzegovina | 9 | 0.0% |
| Caribbean | 13 | 0.1% |
| Central America | 80 | 0.3% |
| China | 10 | 0.0% |
| Cuba | 5 | 0.0% |
| Eastern Asia | 10 | 0.0% |
| Eastern Europe | 9 | 0.0% |
| Egypt | 7 | 0.0% |
| England | 14 | 0.1% |
| Europe | 45 | 0.2% |
| Germany | 20 | 0.1% |
| Greece | 1 | 0.0% |
| Guatemala | 6 | 0.0% |
| India | 7 | 0.0% |
| Laos | 7 | 0.0% |
| Latin America | 116 | 0.4% |
| Mexico | 74 | 0.3% |
| Northern Africa | 26 | 0.1% |
| Northern Europe | 15 | 0.1% |
| Oceania | 3 | 0.0% |
| South America | 23 | 0.1% |
| South Central Asia | 7 | 0.0% |
| South Eastern Asia | 83 | 0.3% |
| Southern Europe | 1 | 0.0% |
| Sudan | 19 | 0.1% |
| Taiwan | 10 | 0.0% |
| Thailand | 76 | 0.3% |
| Western Europe | 20 | 0.1% | View All 32 Rows |
Sex and Age in Hardeman County
Sex and Age in Hardeman County
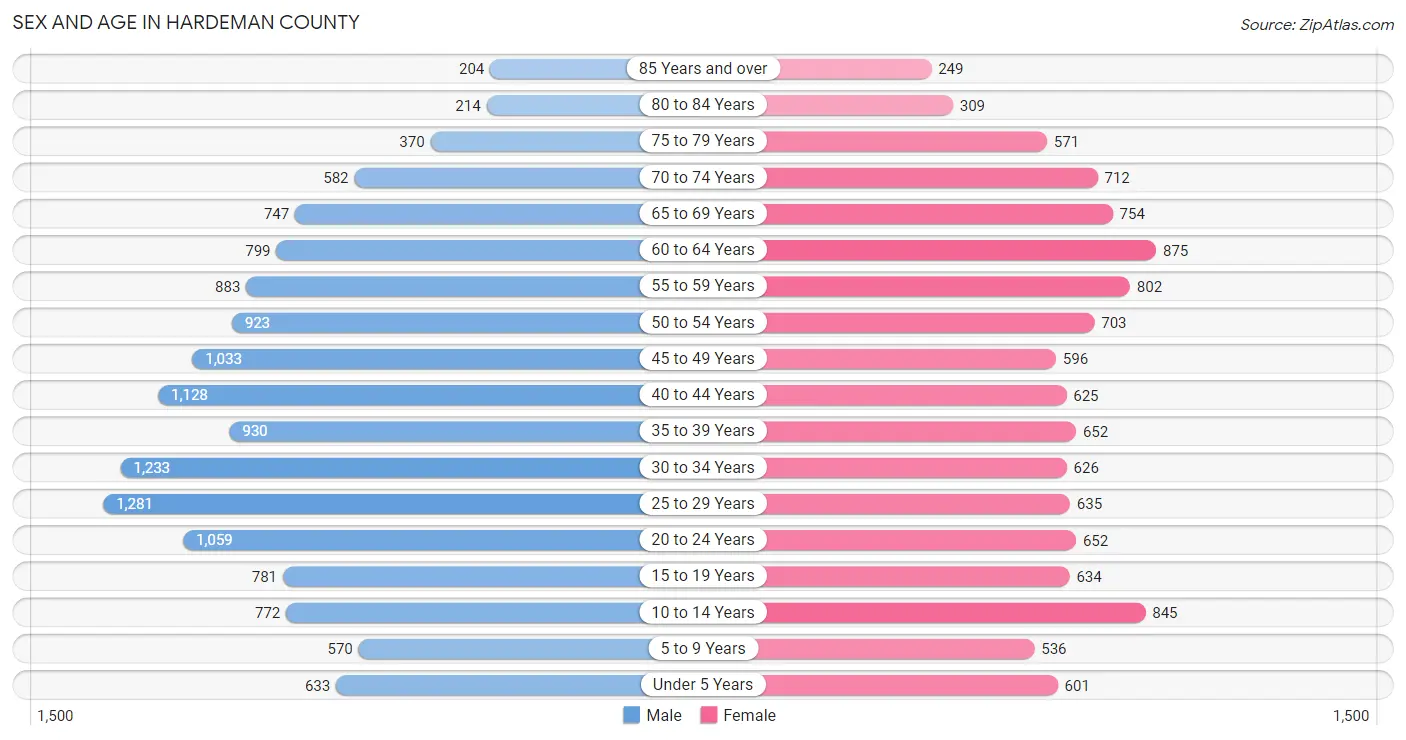
The most populous age groups in Hardeman County are 25 to 29 Years (1,281 | 9.1%) for men and 60 to 64 Years (875 | 7.7%) for women.
| Age Bracket | Male | Female |
| Under 5 Years | 633 (4.5%) | 601 (5.3%) |
| 5 to 9 Years | 570 (4.0%) | 536 (4.7%) |
| 10 to 14 Years | 772 (5.5%) | 845 (7.4%) |
| 15 to 19 Years | 781 (5.5%) | 634 (5.6%) |
| 20 to 24 Years | 1,059 (7.5%) | 652 (5.7%) |
| 25 to 29 Years | 1,281 (9.1%) | 635 (5.6%) |
| 30 to 34 Years | 1,233 (8.7%) | 626 (5.5%) |
| 35 to 39 Years | 930 (6.6%) | 652 (5.7%) |
| 40 to 44 Years | 1,128 (8.0%) | 625 (5.5%) |
| 45 to 49 Years | 1,033 (7.3%) | 596 (5.2%) |
| 50 to 54 Years | 923 (6.5%) | 703 (6.2%) |
| 55 to 59 Years | 883 (6.2%) | 802 (7.0%) |
| 60 to 64 Years | 799 (5.7%) | 875 (7.7%) |
| 65 to 69 Years | 747 (5.3%) | 754 (6.6%) |
| 70 to 74 Years | 582 (4.1%) | 712 (6.3%) |
| 75 to 79 Years | 370 (2.6%) | 571 (5.0%) |
| 80 to 84 Years | 214 (1.5%) | 309 (2.7%) |
| 85 Years and over | 204 (1.4%) | 249 (2.2%) |
| Total | 14,142 (100.0%) | 11,377 (100.0%) |
Families and Households in Hardeman County
Median Family Size in Hardeman County
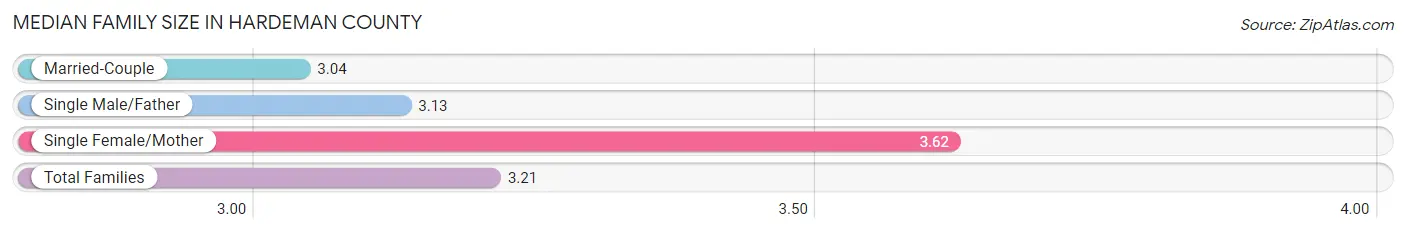
The median family size in Hardeman County is 3.21 persons per family, with single female/mother families (1,567 | 28.2%) accounting for the largest median family size of 3.62 persons per family. On the other hand, married-couple families (3,674 | 66.2%) represent the smallest median family size with 3.04 persons per family.
| Family Type | # Families | Family Size |
| Married-Couple | 3,674 (66.2%) | 3.04 |
| Single Male/Father | 308 (5.6%) | 3.13 |
| Single Female/Mother | 1,567 (28.2%) | 3.62 |
| Total Families | 5,549 (100.0%) | 3.21 |
Median Household Size in Hardeman County
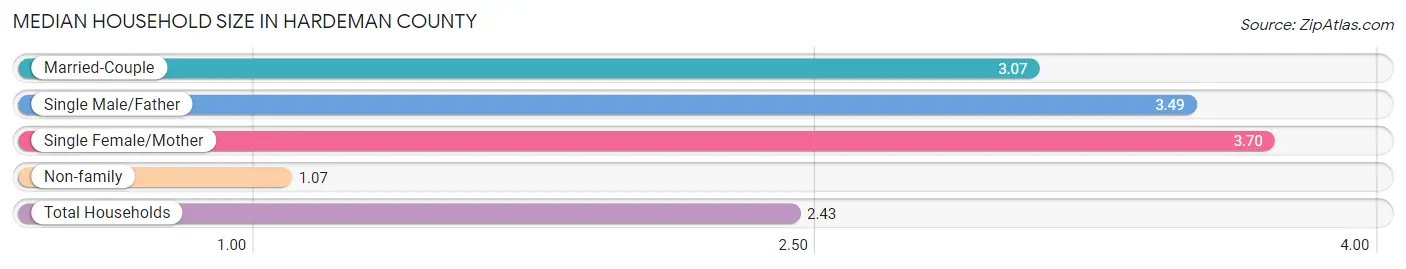
The median household size in Hardeman County is 2.43 persons per household, with single female/mother households (1,567 | 17.4%) accounting for the largest median household size of 3.7 persons per household. non-family households (3,460 | 38.4%) represent the smallest median household size with 1.07 persons per household.
| Household Type | # Households | Household Size |
| Married-Couple | 3,674 (40.8%) | 3.07 |
| Single Male/Father | 308 (3.4%) | 3.49 |
| Single Female/Mother | 1,567 (17.4%) | 3.70 |
| Non-family | 3,460 (38.4%) | 1.07 |
| Total Households | 9,009 (100.0%) | 2.43 |
Household Size by Marriage Status in Hardeman County
Out of a total of 9,009 households in Hardeman County, 5,549 (61.6%) are family households, while 3,460 (38.4%) are nonfamily households. The most numerous type of family households are 2-person households, comprising 3,038, and the most common type of nonfamily households are 1-person households, comprising 3,277.
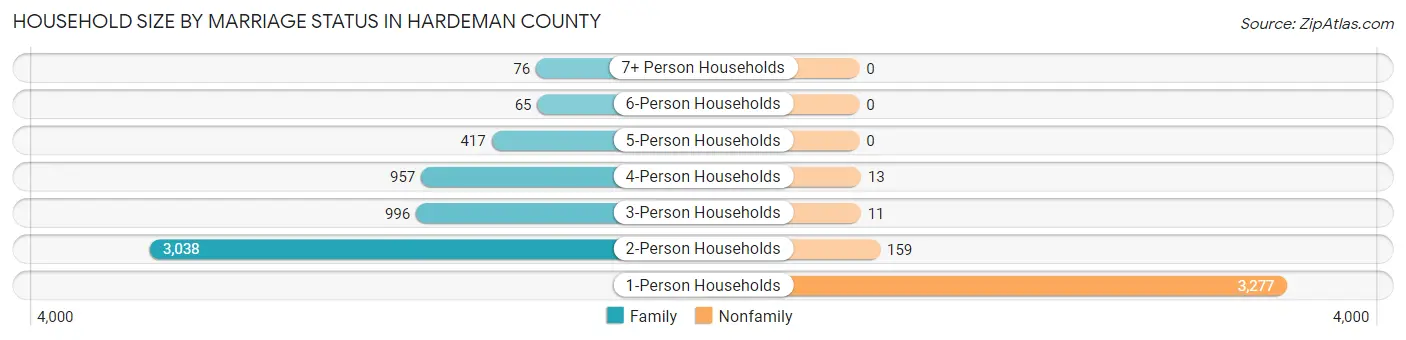
| Household Size | Family Households | Nonfamily Households |
| 1-Person Households | - | 3,277 (36.4%) |
| 2-Person Households | 3,038 (33.7%) | 159 (1.8%) |
| 3-Person Households | 996 (11.1%) | 11 (0.1%) |
| 4-Person Households | 957 (10.6%) | 13 (0.1%) |
| 5-Person Households | 417 (4.6%) | 0 (0.0%) |
| 6-Person Households | 65 (0.7%) | 0 (0.0%) |
| 7+ Person Households | 76 (0.8%) | 0 (0.0%) |
| Total | 5,549 (61.6%) | 3,460 (38.4%) |
Female Fertility in Hardeman County
Fertility by Age in Hardeman County
Average fertility rate in Hardeman County is 75.0 births per 1,000 women. Women in the age bracket of 20 to 34 years have the highest fertility rate with 118.0 births per 1,000 women. Women in the age bracket of 20 to 34 years acount for 64.9% of all women with births.
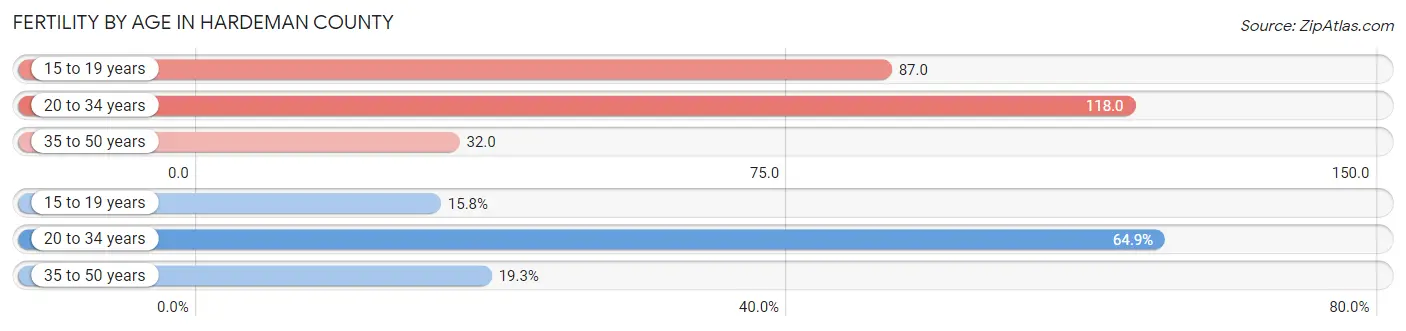
| Age Bracket | Women with Births | Births / 1,000 Women |
| 15 to 19 years | 55 (15.8%) | 87.0 |
| 20 to 34 years | 226 (64.9%) | 118.0 |
| 35 to 50 years | 67 (19.3%) | 32.0 |
| Total | 348 (100.0%) | 75.0 |
Fertility by Age by Marriage Status in Hardeman County
50.6% of women with births (348) in Hardeman County are married. The highest percentage of unmarried women with births falls into 15 to 19 years age bracket with 100.0% of them unmarried at the time of birth, while the lowest percentage of unmarried women with births belong to 35 to 50 years age bracket with 0.0% of them unmarried.
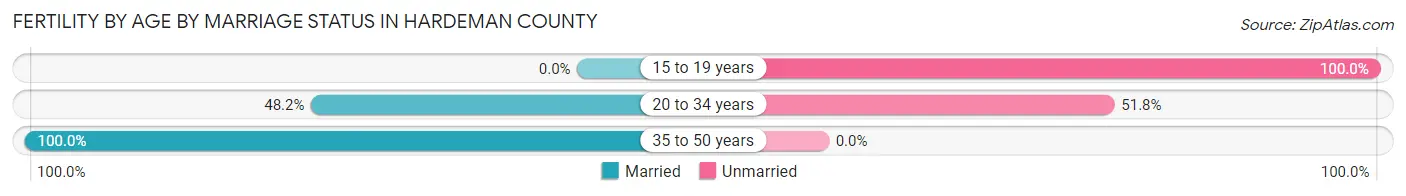
| Age Bracket | Married | Unmarried |
| 15 to 19 years | 0 (0.0%) | 55 (100.0%) |
| 20 to 34 years | 109 (48.2%) | 117 (51.8%) |
| 35 to 50 years | 67 (100.0%) | 0 (0.0%) |
| Total | 176 (50.6%) | 172 (49.4%) |
Fertility by Education in Hardeman County
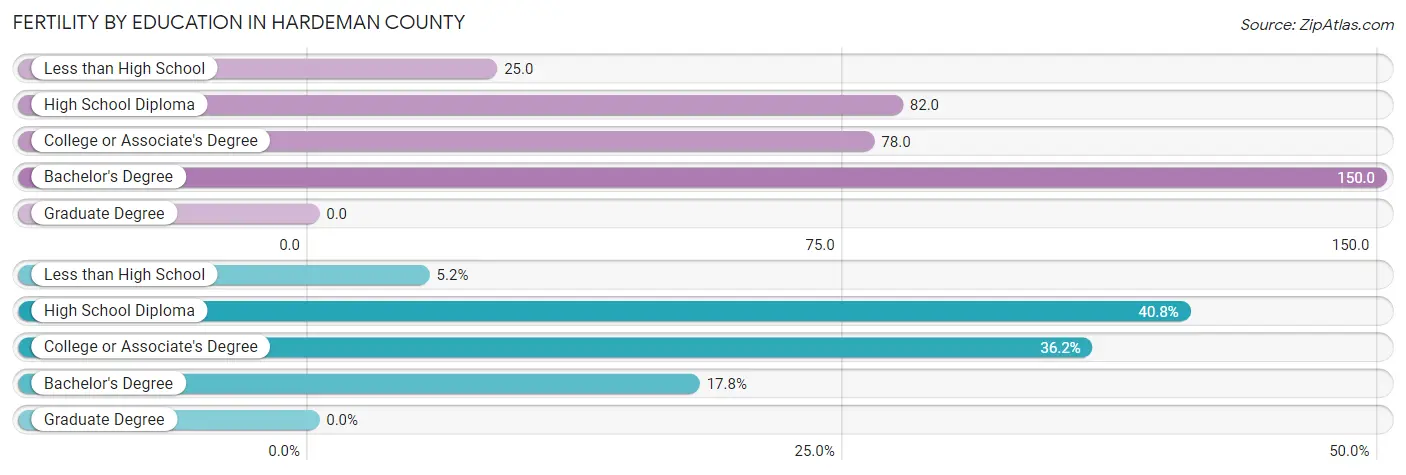
| Educational Attainment | Women with Births | Births / 1,000 Women |
| Less than High School | 18 (5.2%) | 25.0 |
| High School Diploma | 142 (40.8%) | 82.0 |
| College or Associate's Degree | 126 (36.2%) | 78.0 |
| Bachelor's Degree | 62 (17.8%) | 150.0 |
| Graduate Degree | 0 (0.0%) | 0.0 |
| Total | 348 (100.0%) | 75.0 |
Fertility by Education by Marriage Status in Hardeman County
49.4% of women with births in Hardeman County are unmarried. Women with the educational attainment of bachelor's degree are most likely to be married with 100.0% of them married at childbirth, while women with the educational attainment of less than high school are least likely to be married with 100.0% of them unmarried at childbirth.
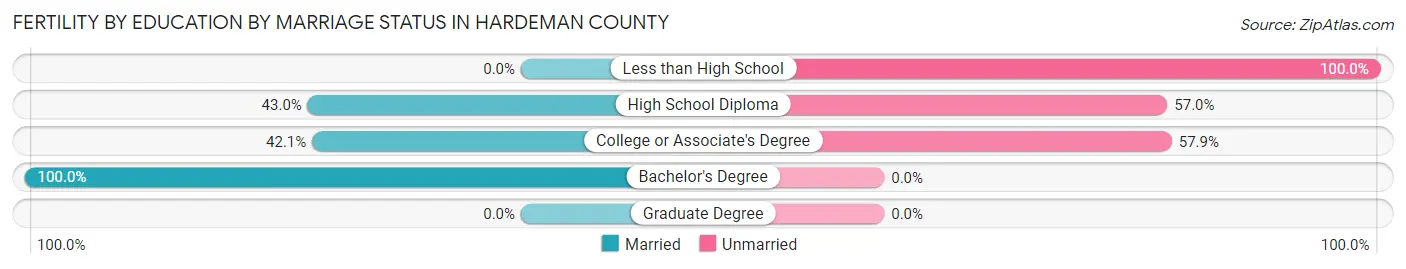
| Educational Attainment | Married | Unmarried |
| Less than High School | 0 (0.0%) | 18 (100.0%) |
| High School Diploma | 61 (43.0%) | 81 (57.0%) |
| College or Associate's Degree | 53 (42.1%) | 73 (57.9%) |
| Bachelor's Degree | 62 (100.0%) | 0 (0.0%) |
| Graduate Degree | 0 (0.0%) | 0 (0.0%) |
| Total | 176 (50.6%) | 172 (49.4%) |
Employment Characteristics in Hardeman County
Employment by Class of Employer in Hardeman County
Among the 8,687 employed individuals in Hardeman County, private company employees (5,798 | 66.7%), local government employees (913 | 10.5%), and state government employees (689 | 7.9%) make up the most common classes of employment.
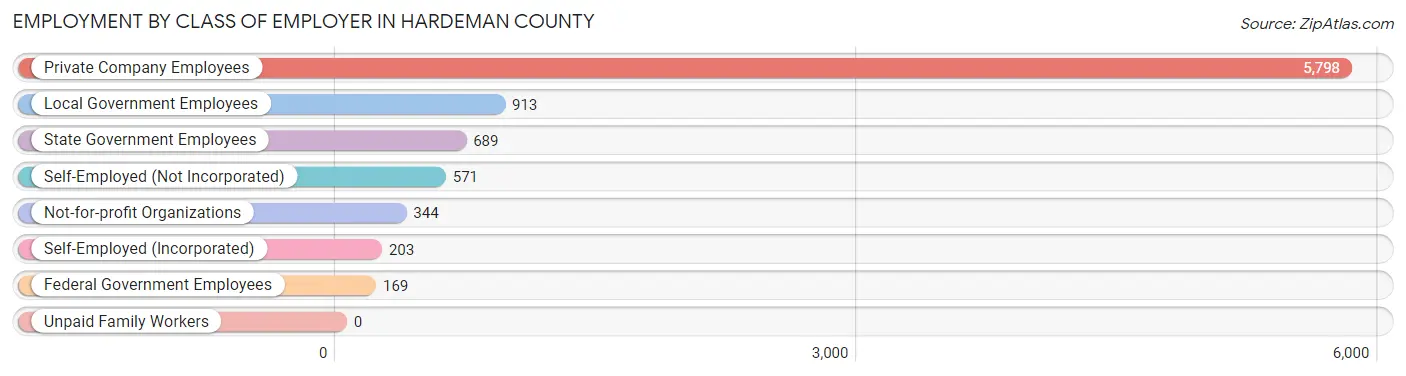
| Employer Class | # Employees | % Employees |
| Private Company Employees | 5,798 | 66.7% |
| Self-Employed (Incorporated) | 203 | 2.3% |
| Self-Employed (Not Incorporated) | 571 | 6.6% |
| Not-for-profit Organizations | 344 | 4.0% |
| Local Government Employees | 913 | 10.5% |
| State Government Employees | 689 | 7.9% |
| Federal Government Employees | 169 | 1.9% |
| Unpaid Family Workers | 0 | 0.0% |
| Total | 8,687 | 100.0% |
Employment Status by Age in Hardeman County
According to the labor force statistics for Hardeman County, out of the total population over 16 years of age (21,321), 48.7% or 10,383 individuals are in the labor force, with 12.8% or 1,329 of them unemployed. The age group with the highest labor force participation rate is 20 to 24 years, with 74.2% or 1,270 individuals in the labor force. Within the labor force, the 25 to 29 years age range has the highest percentage of unemployed individuals, with 37.8% or 424 of them being unemployed.
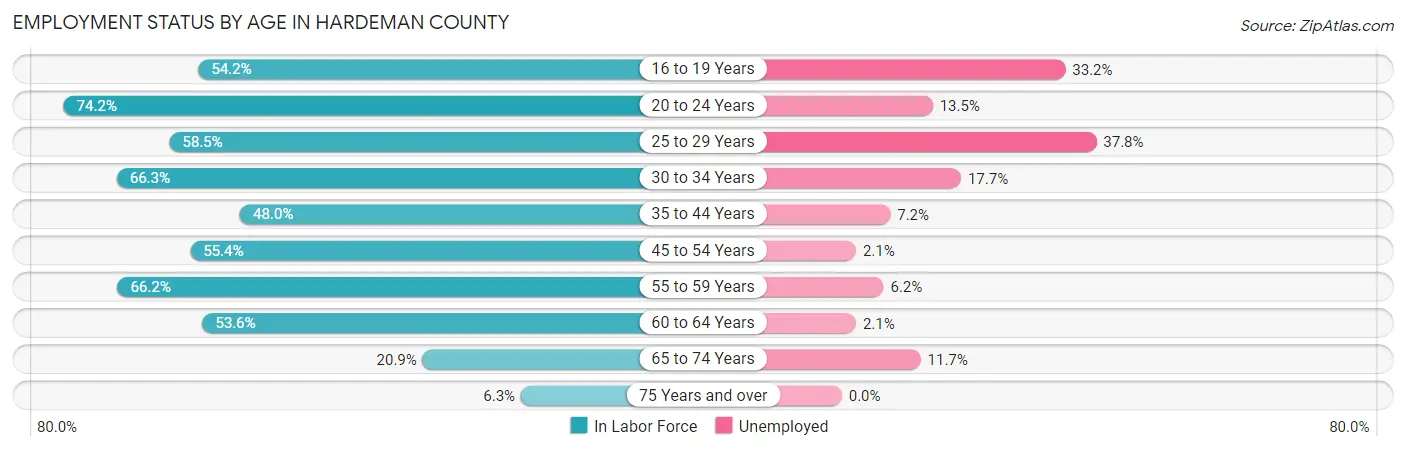
| Age Bracket | In Labor Force | Unemployed |
| 16 to 19 Years | 636 (54.2%) | 211 (33.2%) |
| 20 to 24 Years | 1,270 (74.2%) | 171 (13.5%) |
| 25 to 29 Years | 1,121 (58.5%) | 424 (37.8%) |
| 30 to 34 Years | 1,233 (66.3%) | 218 (17.7%) |
| 35 to 44 Years | 1,601 (48.0%) | 115 (7.2%) |
| 45 to 54 Years | 1,803 (55.4%) | 38 (2.1%) |
| 55 to 59 Years | 1,115 (66.2%) | 69 (6.2%) |
| 60 to 64 Years | 897 (53.6%) | 19 (2.1%) |
| 65 to 74 Years | 584 (20.9%) | 68 (11.7%) |
| 75 Years and over | 121 (6.3%) | 0 (0.0%) |
| Total | 10,383 (48.7%) | 1,329 (12.8%) |
Employment Status by Educational Attainment in Hardeman County
According to labor force statistics for Hardeman County, 56.6% of individuals (7,768) out of the total population between 25 and 64 years of age (13,724) are in the labor force, with 11.4% or 886 of them being unemployed. The group with the highest labor force participation rate are those with the educational attainment of bachelor's degree or higher, with 85.8% or 1,085 individuals in the labor force. Within the labor force, individuals with less than high school education have the highest percentage of unemployment, with 34.7% or 312 of them being unemployed.
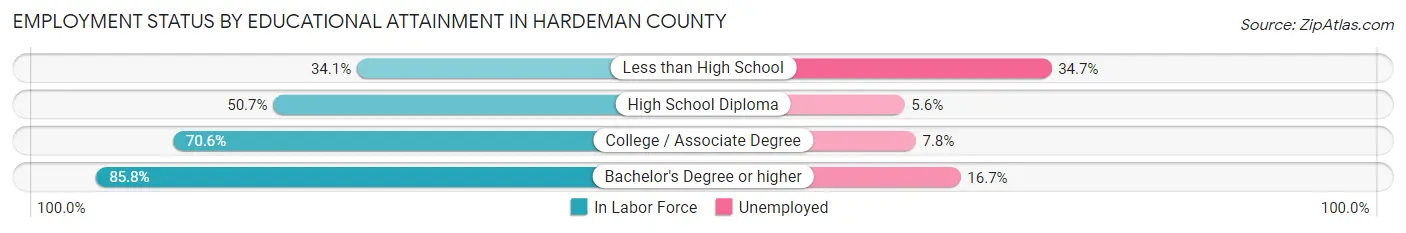
| Educational Attainment | In Labor Force | Unemployed |
| Less than High School | 900 (34.1%) | 916 (34.7%) |
| High School Diploma | 2,923 (50.7%) | 323 (5.6%) |
| College / Associate Degree | 2,862 (70.6%) | 316 (7.8%) |
| Bachelor's Degree or higher | 1,085 (85.8%) | 211 (16.7%) |
| Total | 7,768 (56.6%) | 1,565 (11.4%) |
Employment Occupations by Sex in Hardeman County
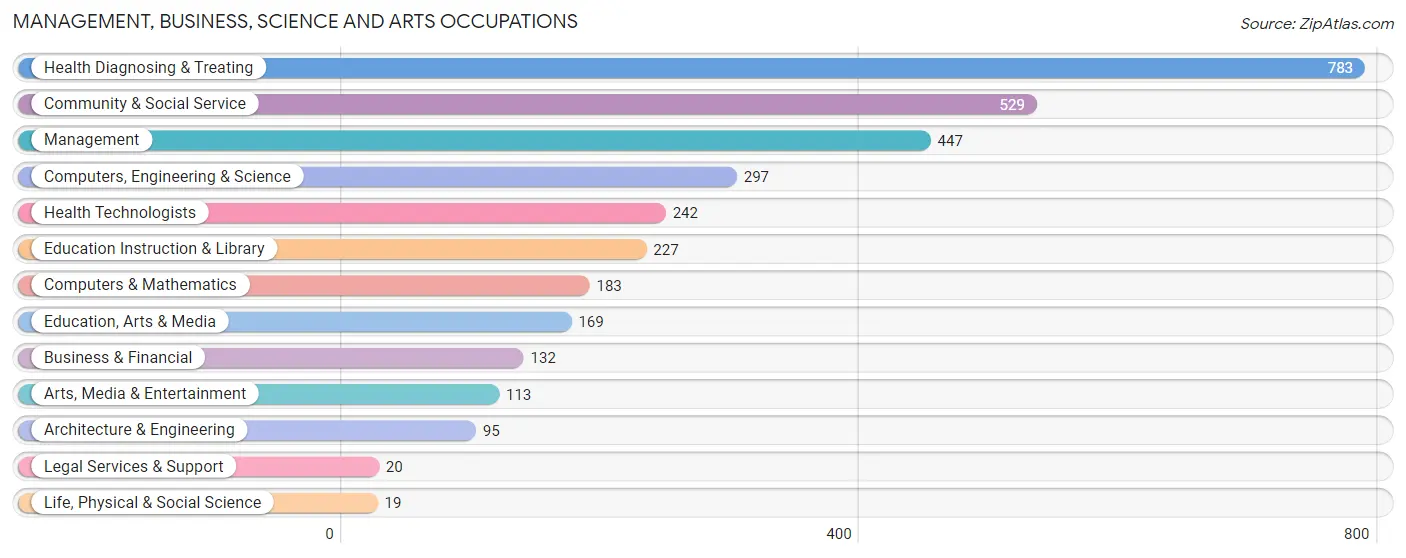
Management, Business, Science and Arts Occupations
The most common Management, Business, Science and Arts occupations in Hardeman County are Health Diagnosing & Treating (783 | 8.7%), Community & Social Service (529 | 5.9%), Management (447 | 4.9%), Computers, Engineering & Science (297 | 3.3%), and Health Technologists (242 | 2.7%).
Management, Business, Science and Arts Occupations by Sex
Within the Management, Business, Science and Arts occupations in Hardeman County, the most male-oriented occupations are Life, Physical & Social Science (100.0%), Computers & Mathematics (80.3%), and Computers, Engineering & Science (80.1%), while the most female-oriented occupations are Legal Services & Support (100.0%), Health Technologists (95.5%), and Education, Arts & Media (88.8%).
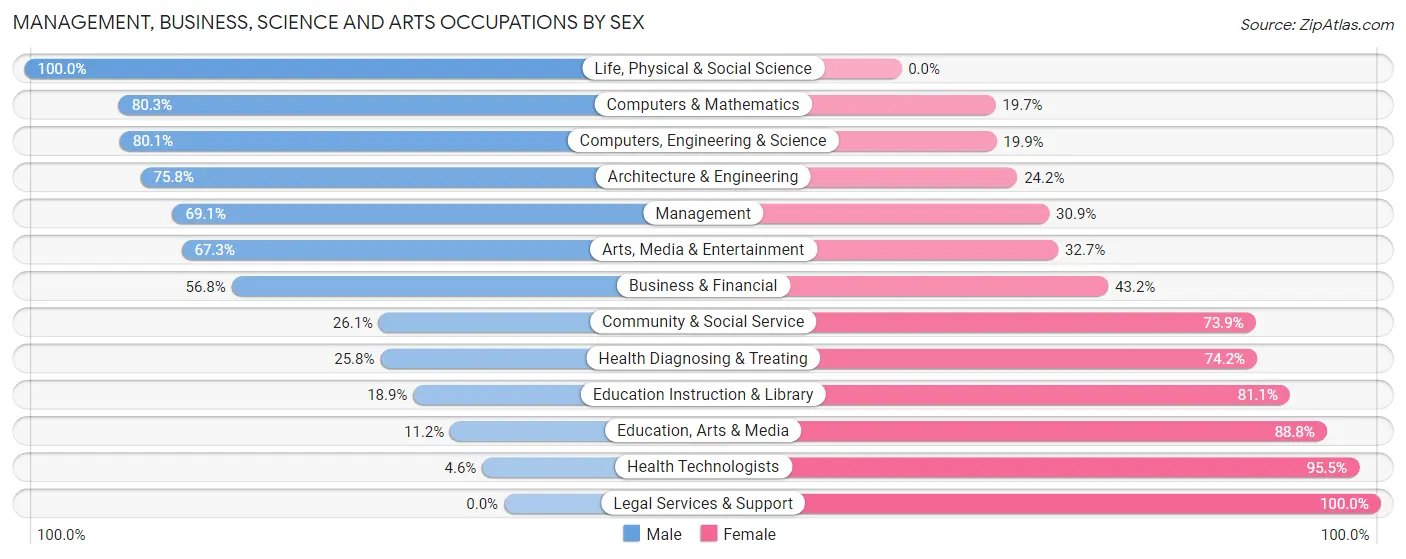
| Occupation | Male | Female |
| Management | 309 (69.1%) | 138 (30.9%) |
| Business & Financial | 75 (56.8%) | 57 (43.2%) |
| Computers, Engineering & Science | 238 (80.1%) | 59 (19.9%) |
| Computers & Mathematics | 147 (80.3%) | 36 (19.7%) |
| Architecture & Engineering | 72 (75.8%) | 23 (24.2%) |
| Life, Physical & Social Science | 19 (100.0%) | 0 (0.0%) |
| Community & Social Service | 138 (26.1%) | 391 (73.9%) |
| Education, Arts & Media | 19 (11.2%) | 150 (88.8%) |
| Legal Services & Support | 0 (0.0%) | 20 (100.0%) |
| Education Instruction & Library | 43 (18.9%) | 184 (81.1%) |
| Arts, Media & Entertainment | 76 (67.3%) | 37 (32.7%) |
| Health Diagnosing & Treating | 202 (25.8%) | 581 (74.2%) |
| Health Technologists | 11 (4.5%) | 231 (95.5%) |
| Total (Category) | 962 (44.0%) | 1,226 (56.0%) |
| Total (Overall) | 4,625 (51.1%) | 4,420 (48.9%) |
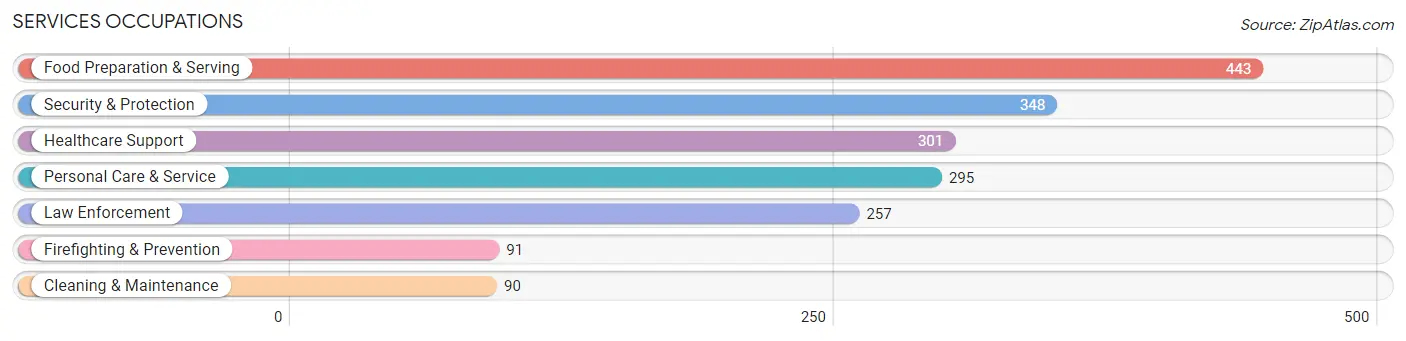
Services Occupations
The most common Services occupations in Hardeman County are Food Preparation & Serving (443 | 4.9%), Security & Protection (348 | 3.8%), Healthcare Support (301 | 3.3%), Personal Care & Service (295 | 3.3%), and Law Enforcement (257 | 2.8%).
Services Occupations by Sex
Within the Services occupations in Hardeman County, the most male-oriented occupations are Firefighting & Prevention (79.1%), Cleaning & Maintenance (60.0%), and Security & Protection (56.3%), while the most female-oriented occupations are Personal Care & Service (85.8%), Healthcare Support (83.7%), and Food Preparation & Serving (82.2%).
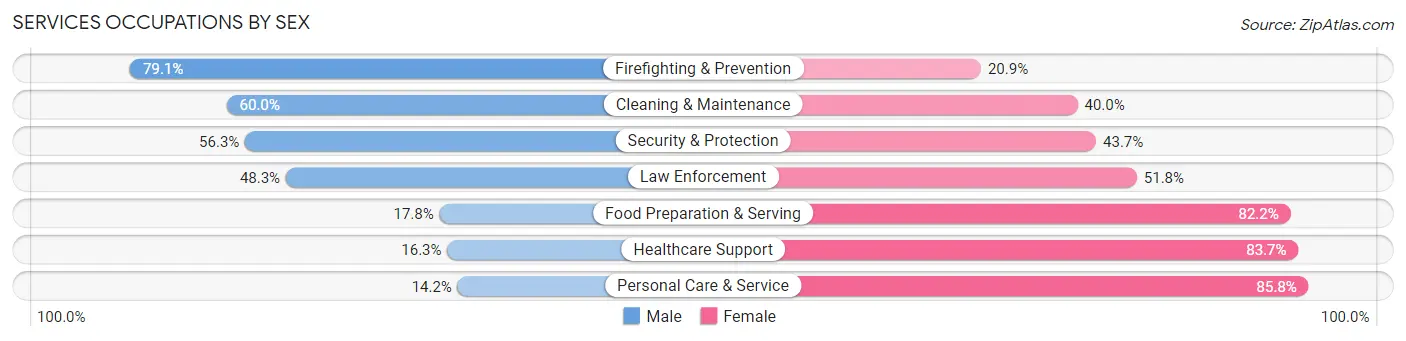
| Occupation | Male | Female |
| Healthcare Support | 49 (16.3%) | 252 (83.7%) |
| Security & Protection | 196 (56.3%) | 152 (43.7%) |
| Firefighting & Prevention | 72 (79.1%) | 19 (20.9%) |
| Law Enforcement | 124 (48.2%) | 133 (51.7%) |
| Food Preparation & Serving | 79 (17.8%) | 364 (82.2%) |
| Cleaning & Maintenance | 54 (60.0%) | 36 (40.0%) |
| Personal Care & Service | 42 (14.2%) | 253 (85.8%) |
| Total (Category) | 420 (28.4%) | 1,057 (71.6%) |
| Total (Overall) | 4,625 (51.1%) | 4,420 (48.9%) |
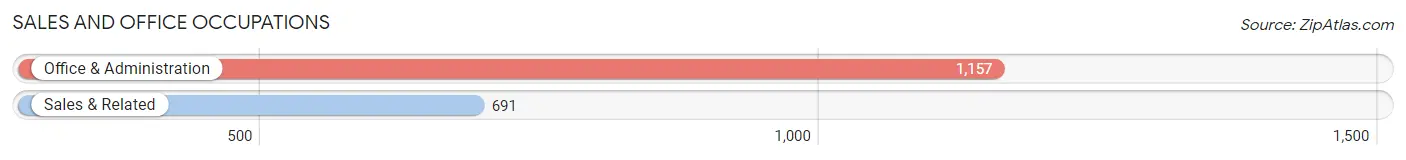
Sales and Office Occupations
The most common Sales and Office occupations in Hardeman County are Office & Administration (1,157 | 12.8%), and Sales & Related (691 | 7.6%).
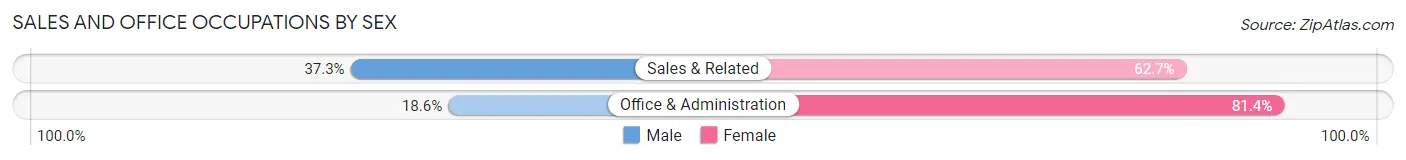
Sales and Office Occupations by Sex
| Occupation | Male | Female |
| Sales & Related | 258 (37.3%) | 433 (62.7%) |
| Office & Administration | 215 (18.6%) | 942 (81.4%) |
| Total (Category) | 473 (25.6%) | 1,375 (74.4%) |
| Total (Overall) | 4,625 (51.1%) | 4,420 (48.9%) |
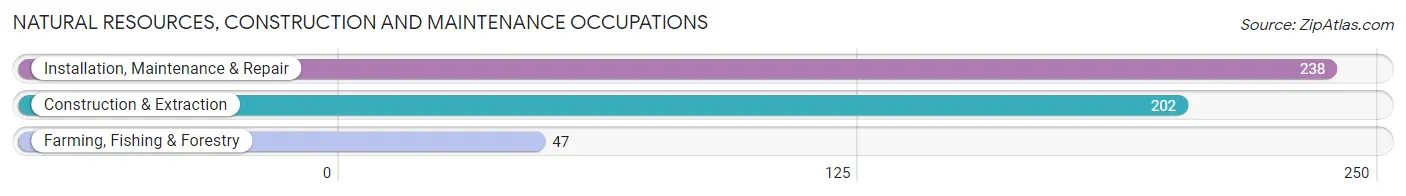
Natural Resources, Construction and Maintenance Occupations
The most common Natural Resources, Construction and Maintenance occupations in Hardeman County are Installation, Maintenance & Repair (238 | 2.6%), Construction & Extraction (202 | 2.2%), and Farming, Fishing & Forestry (47 | 0.5%).
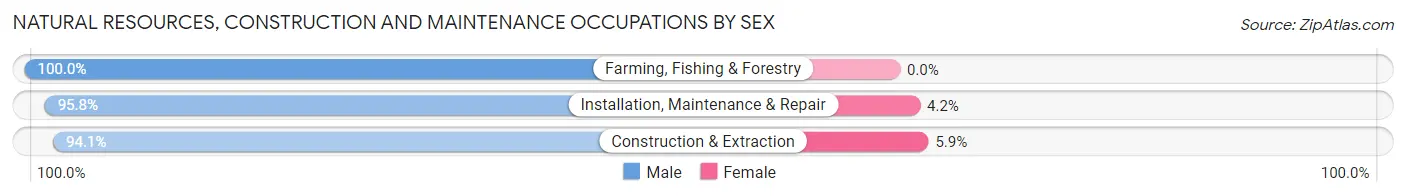
Natural Resources, Construction and Maintenance Occupations by Sex
| Occupation | Male | Female |
| Farming, Fishing & Forestry | 47 (100.0%) | 0 (0.0%) |
| Construction & Extraction | 190 (94.1%) | 12 (5.9%) |
| Installation, Maintenance & Repair | 228 (95.8%) | 10 (4.2%) |
| Total (Category) | 465 (95.5%) | 22 (4.5%) |
| Total (Overall) | 4,625 (51.1%) | 4,420 (48.9%) |
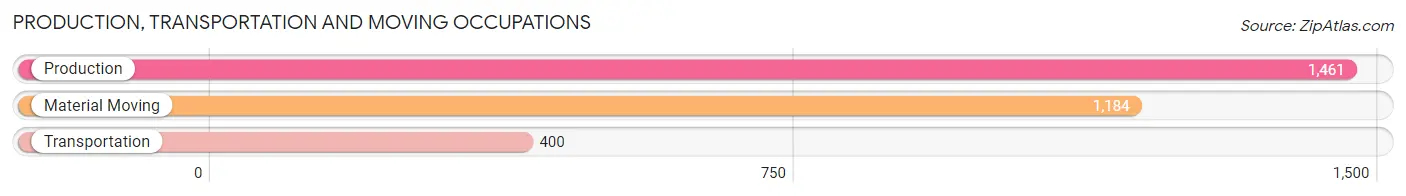
Production, Transportation and Moving Occupations
The most common Production, Transportation and Moving occupations in Hardeman County are Production (1,461 | 16.2%), Material Moving (1,184 | 13.1%), and Transportation (400 | 4.4%).
Production, Transportation and Moving Occupations by Sex
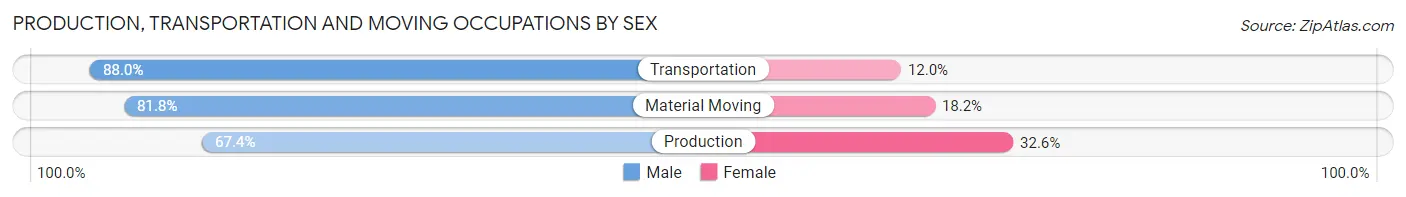
| Occupation | Male | Female |
| Production | 985 (67.4%) | 476 (32.6%) |
| Transportation | 352 (88.0%) | 48 (12.0%) |
| Material Moving | 968 (81.8%) | 216 (18.2%) |
| Total (Category) | 2,305 (75.7%) | 740 (24.3%) |
| Total (Overall) | 4,625 (51.1%) | 4,420 (48.9%) |
Employment Industries by Sex in Hardeman County
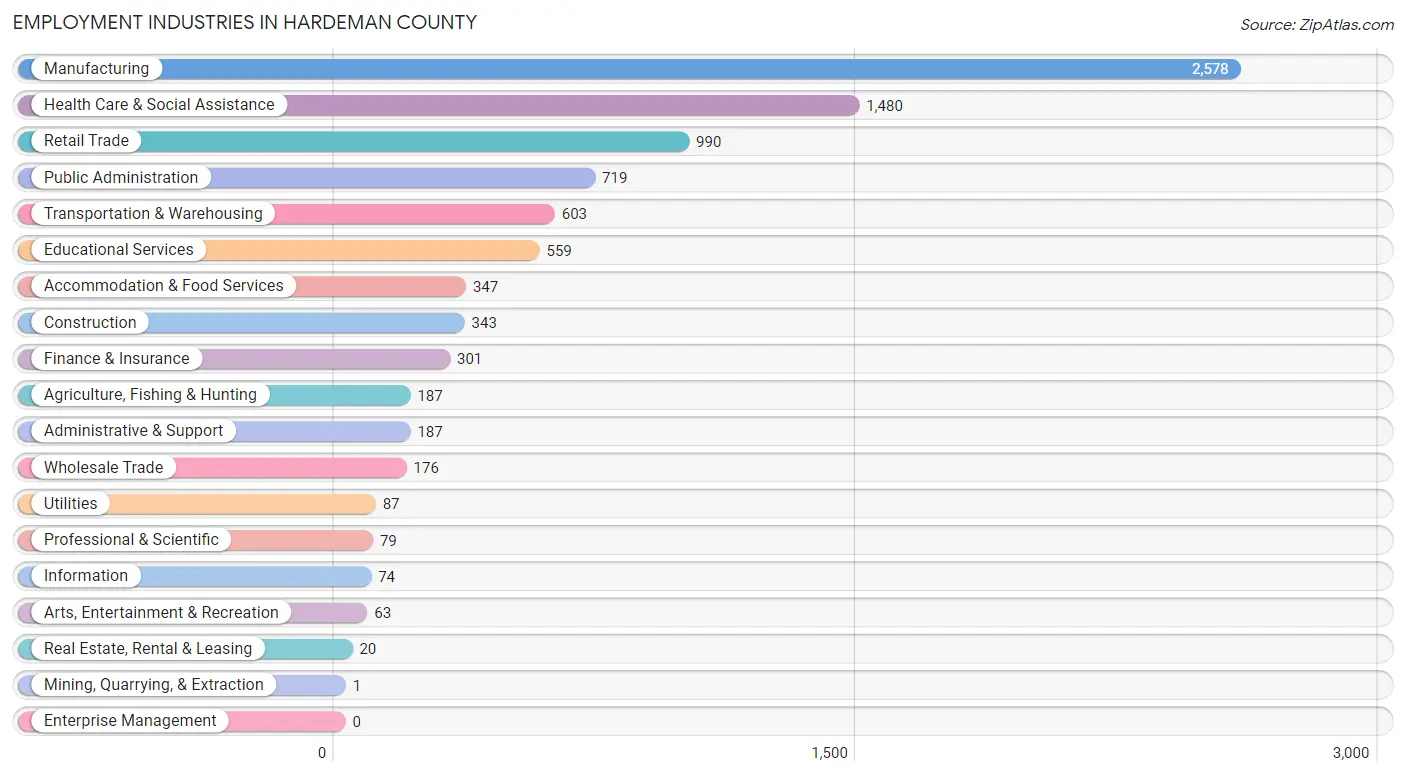
Employment Industries in Hardeman County
The major employment industries in Hardeman County include Manufacturing (2,578 | 28.5%), Health Care & Social Assistance (1,480 | 16.4%), Retail Trade (990 | 11.0%), Public Administration (719 | 8.0%), and Transportation & Warehousing (603 | 6.7%).
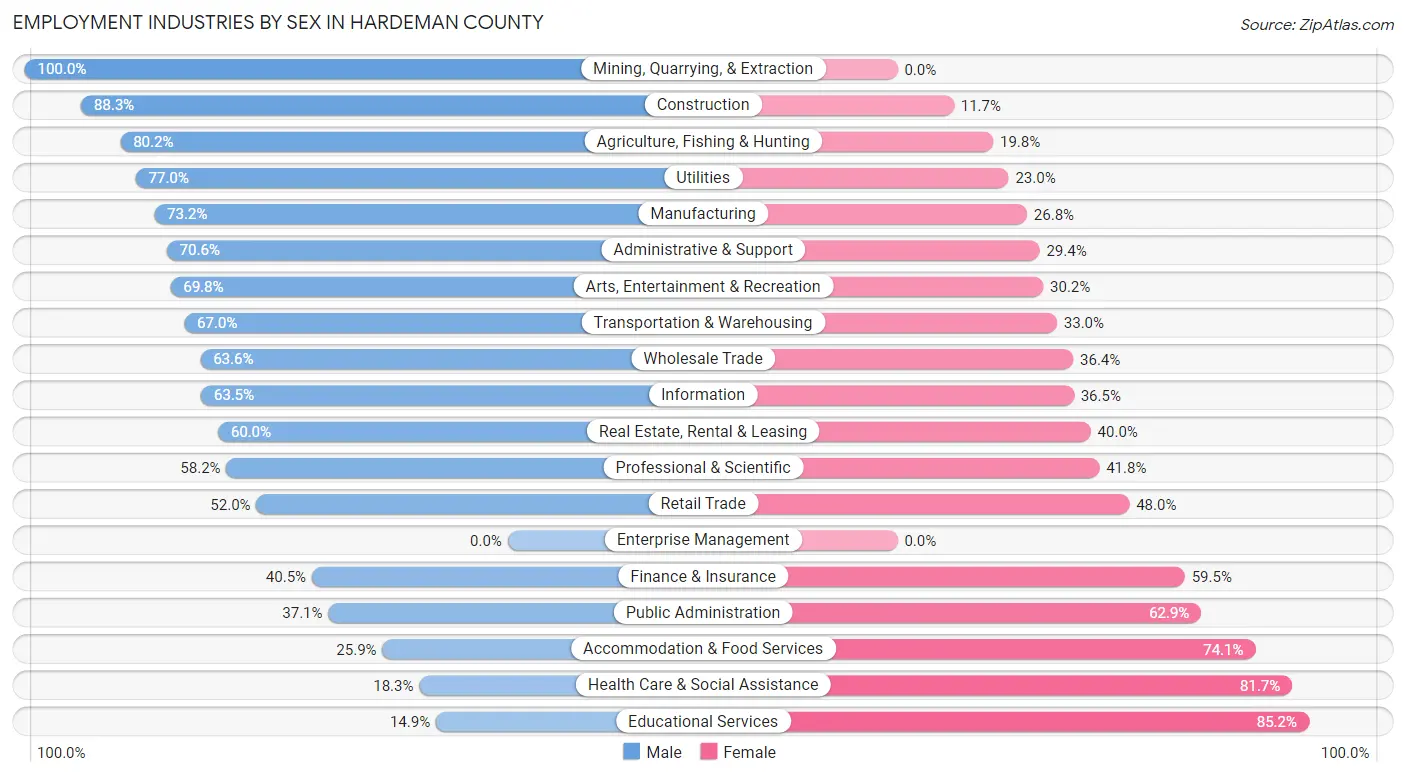
Employment Industries by Sex in Hardeman County
The Hardeman County industries that see more men than women are Mining, Quarrying, & Extraction (100.0%), Construction (88.3%), and Agriculture, Fishing & Hunting (80.2%), whereas the industries that tend to have a higher number of women are Educational Services (85.2%), Health Care & Social Assistance (81.7%), and Accommodation & Food Services (74.1%).
| Industry | Male | Female |
| Agriculture, Fishing & Hunting | 150 (80.2%) | 37 (19.8%) |
| Mining, Quarrying, & Extraction | 1 (100.0%) | 0 (0.0%) |
| Construction | 303 (88.3%) | 40 (11.7%) |
| Manufacturing | 1,887 (73.2%) | 691 (26.8%) |
| Wholesale Trade | 112 (63.6%) | 64 (36.4%) |
| Retail Trade | 515 (52.0%) | 475 (48.0%) |
| Transportation & Warehousing | 404 (67.0%) | 199 (33.0%) |
| Utilities | 67 (77.0%) | 20 (23.0%) |
| Information | 47 (63.5%) | 27 (36.5%) |
| Finance & Insurance | 122 (40.5%) | 179 (59.5%) |
| Real Estate, Rental & Leasing | 12 (60.0%) | 8 (40.0%) |
| Professional & Scientific | 46 (58.2%) | 33 (41.8%) |
| Enterprise Management | 0 (0.0%) | 0 (0.0%) |
| Administrative & Support | 132 (70.6%) | 55 (29.4%) |
| Educational Services | 83 (14.8%) | 476 (85.2%) |
| Health Care & Social Assistance | 271 (18.3%) | 1,209 (81.7%) |
| Arts, Entertainment & Recreation | 44 (69.8%) | 19 (30.2%) |
| Accommodation & Food Services | 90 (25.9%) | 257 (74.1%) |
| Public Administration | 267 (37.1%) | 452 (62.9%) |
| Total | 4,625 (51.1%) | 4,420 (48.9%) |
Education in Hardeman County
School Enrollment in Hardeman County
The most common levels of schooling among the 4,931 students in Hardeman County are high school (1,363 | 27.6%), middle school (1,113 | 22.6%), and elementary school (1,053 | 21.3%).
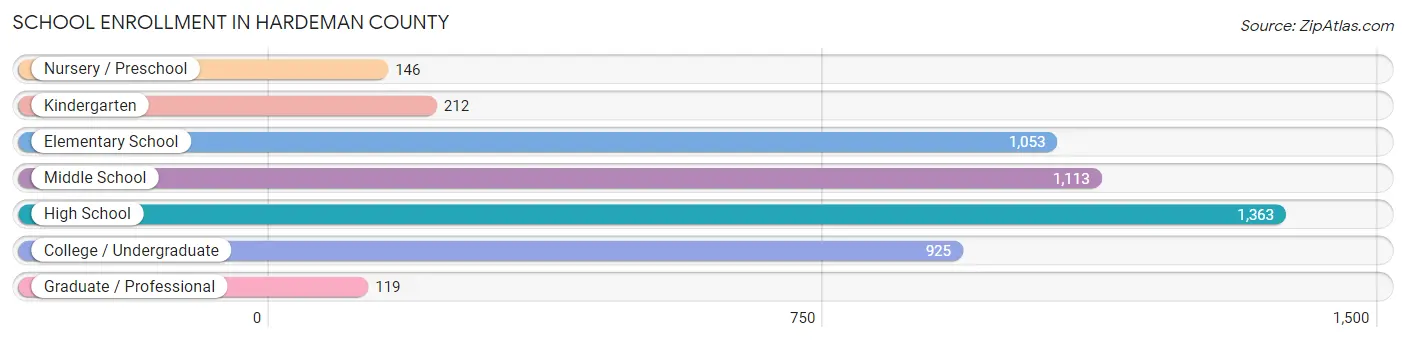
| School Level | # Students | % Students |
| Nursery / Preschool | 146 | 3.0% |
| Kindergarten | 212 | 4.3% |
| Elementary School | 1,053 | 21.3% |
| Middle School | 1,113 | 22.6% |
| High School | 1,363 | 27.6% |
| College / Undergraduate | 925 | 18.8% |
| Graduate / Professional | 119 | 2.4% |
| Total | 4,931 | 100.0% |
School Enrollment by Age by Funding Source in Hardeman County
Out of a total of 4,931 students who are enrolled in schools in Hardeman County, 725 (14.7%) attend a private institution, while the remaining 4,206 (85.3%) are enrolled in public schools. The age group of 25 to 34 year olds has the highest likelihood of being enrolled in private schools, with 136 (46.4% in the age bracket) enrolled. Conversely, the age group of 20 to 24 year olds has the lowest likelihood of being enrolled in a private school, with 358 (96.8% in the age bracket) attending a public institution.
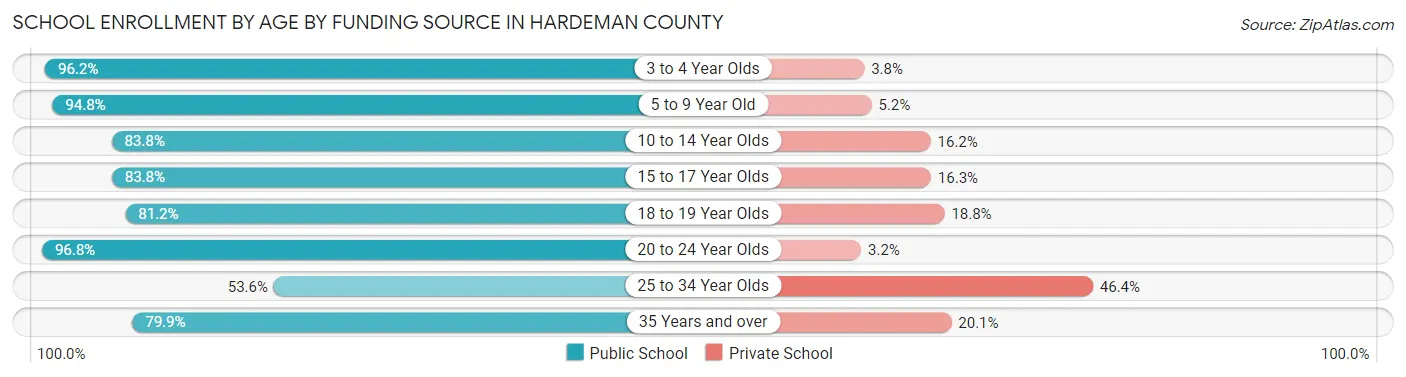
| Age Bracket | Public School | Private School |
| 3 to 4 Year Olds | 126 (96.2%) | 5 (3.8%) |
| 5 to 9 Year Old | 1,024 (94.8%) | 56 (5.2%) |
| 10 to 14 Year Olds | 1,330 (83.8%) | 257 (16.2%) |
| 15 to 17 Year Olds | 737 (83.8%) | 143 (16.3%) |
| 18 to 19 Year Olds | 212 (81.2%) | 49 (18.8%) |
| 20 to 24 Year Olds | 358 (96.8%) | 12 (3.2%) |
| 25 to 34 Year Olds | 157 (53.6%) | 136 (46.4%) |
| 35 Years and over | 263 (79.9%) | 66 (20.1%) |
| Total | 4,206 (85.3%) | 725 (14.7%) |
Educational Attainment by Field of Study in Hardeman County
Business (440 | 21.6%), education (313 | 15.4%), science & technology (250 | 12.3%), liberal arts & history (237 | 11.6%), and social sciences (158 | 7.8%) are the most common fields of study among 2,037 individuals in Hardeman County who have obtained a bachelor's degree or higher.
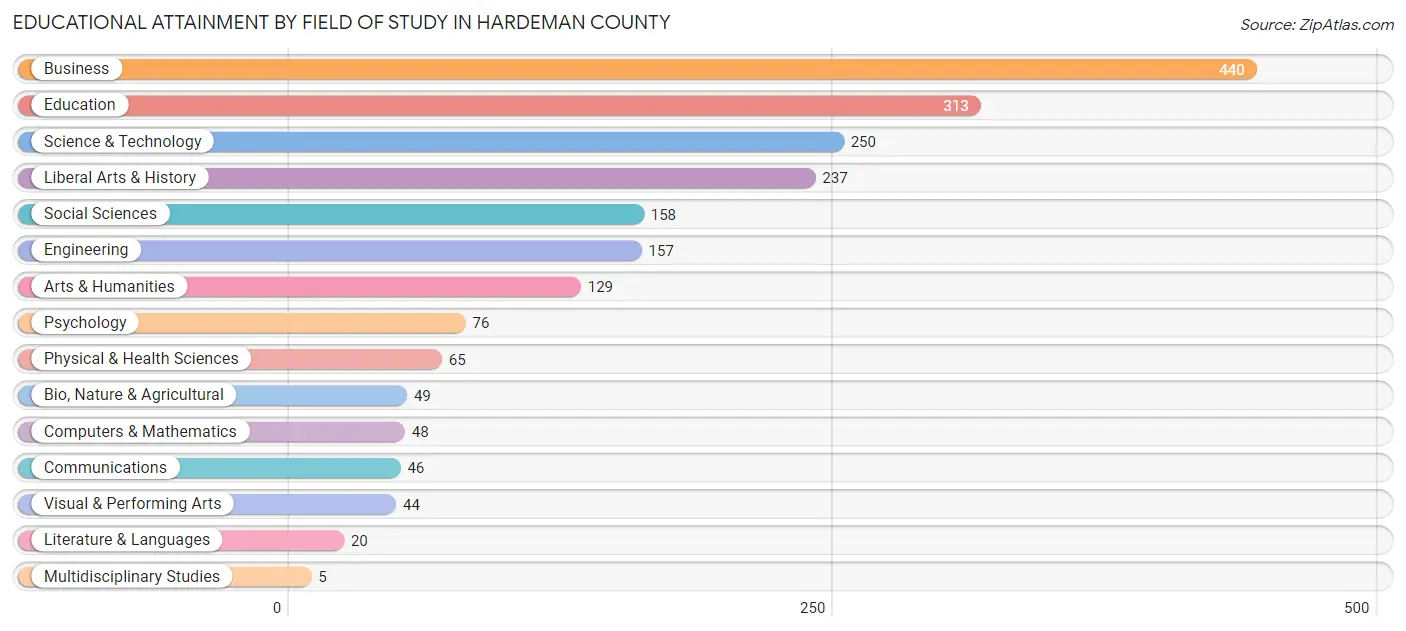
| Field of Study | # Graduates | % Graduates |
| Computers & Mathematics | 48 | 2.4% |
| Bio, Nature & Agricultural | 49 | 2.4% |
| Physical & Health Sciences | 65 | 3.2% |
| Psychology | 76 | 3.7% |
| Social Sciences | 158 | 7.8% |
| Engineering | 157 | 7.7% |
| Multidisciplinary Studies | 5 | 0.3% |
| Science & Technology | 250 | 12.3% |
| Business | 440 | 21.6% |
| Education | 313 | 15.4% |
| Literature & Languages | 20 | 1.0% |
| Liberal Arts & History | 237 | 11.6% |
| Visual & Performing Arts | 44 | 2.2% |
| Communications | 46 | 2.3% |
| Arts & Humanities | 129 | 6.3% |
| Total | 2,037 | 100.0% |
Transportation & Commute in Hardeman County
Vehicle Availability by Sex in Hardeman County
The most prevalent vehicle ownership categories in Hardeman County are males with 2 vehicles (1,355, accounting for 30.2%) and females with 2 vehicles (1,488, making up 32.3%).
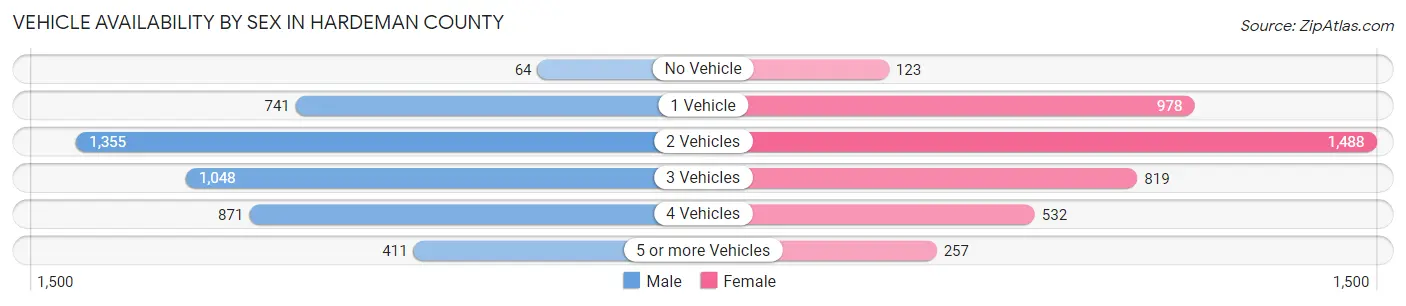
| Vehicles Available | Male | Female |
| No Vehicle | 64 (1.4%) | 123 (2.9%) |
| 1 Vehicle | 741 (16.5%) | 978 (23.3%) |
| 2 Vehicles | 1,355 (30.2%) | 1,488 (35.4%) |
| 3 Vehicles | 1,048 (23.3%) | 819 (19.5%) |
| 4 Vehicles | 871 (19.4%) | 532 (12.7%) |
| 5 or more Vehicles | 411 (9.1%) | 257 (6.1%) |
| Total | 4,490 (100.0%) | 4,197 (100.0%) |
Commute Time in Hardeman County
The most frequently occuring commute durations in Hardeman County are 45 to 59 minutes (1,164 commuters, 14.2%), 20 to 24 minutes (1,133 commuters, 13.9%), and 15 to 19 minutes (1,064 commuters, 13.0%).
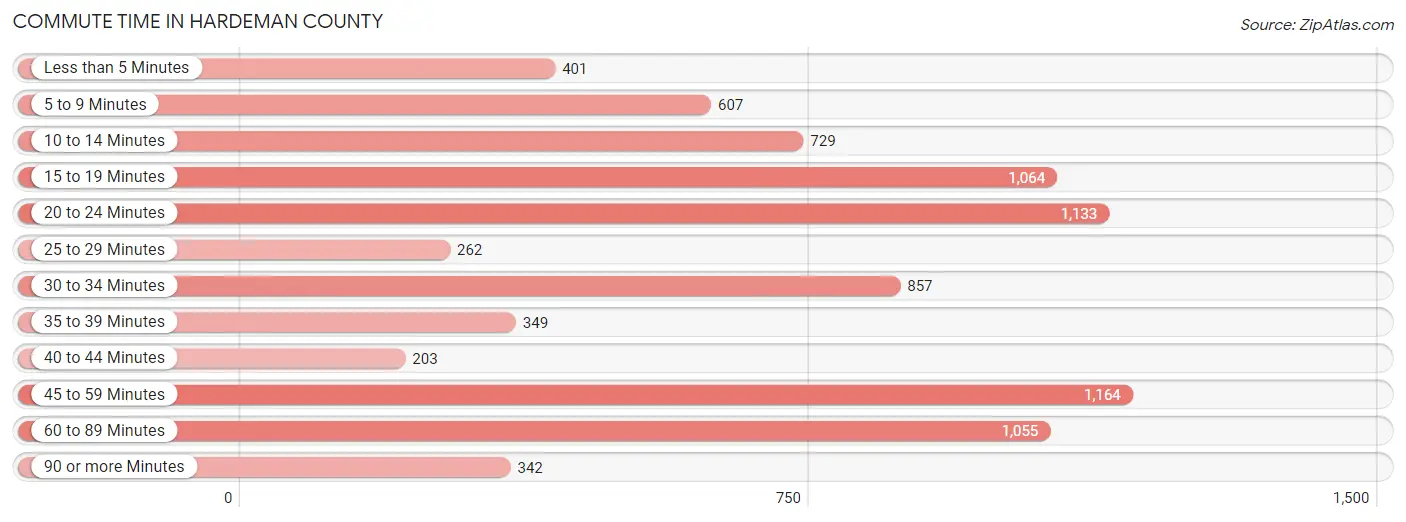
| Commute Time | # Commuters | % Commuters |
| Less than 5 Minutes | 401 | 4.9% |
| 5 to 9 Minutes | 607 | 7.4% |
| 10 to 14 Minutes | 729 | 8.9% |
| 15 to 19 Minutes | 1,064 | 13.0% |
| 20 to 24 Minutes | 1,133 | 13.9% |
| 25 to 29 Minutes | 262 | 3.2% |
| 30 to 34 Minutes | 857 | 10.5% |
| 35 to 39 Minutes | 349 | 4.3% |
| 40 to 44 Minutes | 203 | 2.5% |
| 45 to 59 Minutes | 1,164 | 14.2% |
| 60 to 89 Minutes | 1,055 | 12.9% |
| 90 or more Minutes | 342 | 4.2% |
Commute Time by Sex in Hardeman County
The most common commute times in Hardeman County are 45 to 59 minutes (624 commuters, 14.9%) for males and 15 to 19 minutes (699 commuters, 17.5%) for females.
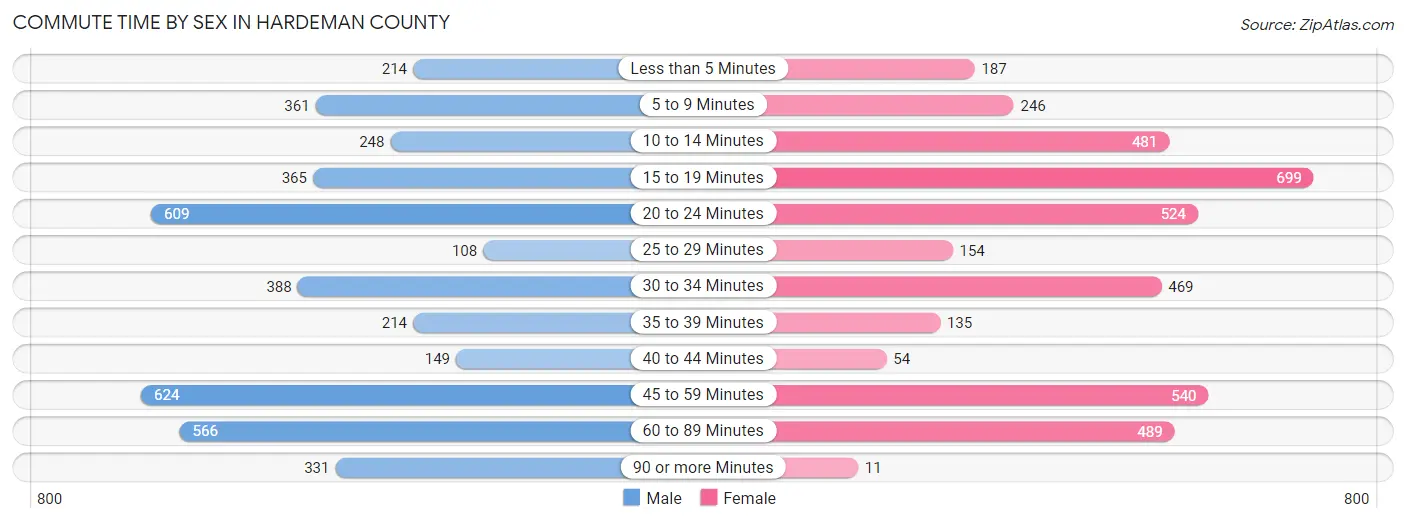
| Commute Time | Male | Female |
| Less than 5 Minutes | 214 (5.1%) | 187 (4.7%) |
| 5 to 9 Minutes | 361 (8.6%) | 246 (6.2%) |
| 10 to 14 Minutes | 248 (5.9%) | 481 (12.1%) |
| 15 to 19 Minutes | 365 (8.7%) | 699 (17.5%) |
| 20 to 24 Minutes | 609 (14.6%) | 524 (13.1%) |
| 25 to 29 Minutes | 108 (2.6%) | 154 (3.9%) |
| 30 to 34 Minutes | 388 (9.3%) | 469 (11.8%) |
| 35 to 39 Minutes | 214 (5.1%) | 135 (3.4%) |
| 40 to 44 Minutes | 149 (3.6%) | 54 (1.3%) |
| 45 to 59 Minutes | 624 (14.9%) | 540 (13.5%) |
| 60 to 89 Minutes | 566 (13.6%) | 489 (12.3%) |
| 90 or more Minutes | 331 (7.9%) | 11 (0.3%) |
Time of Departure to Work by Sex in Hardeman County
The most frequent times of departure to work in Hardeman County are 12:00 AM to 4:59 AM (771, 18.5%) for males and 6:30 AM to 6:59 AM (708, 17.7%) for females.
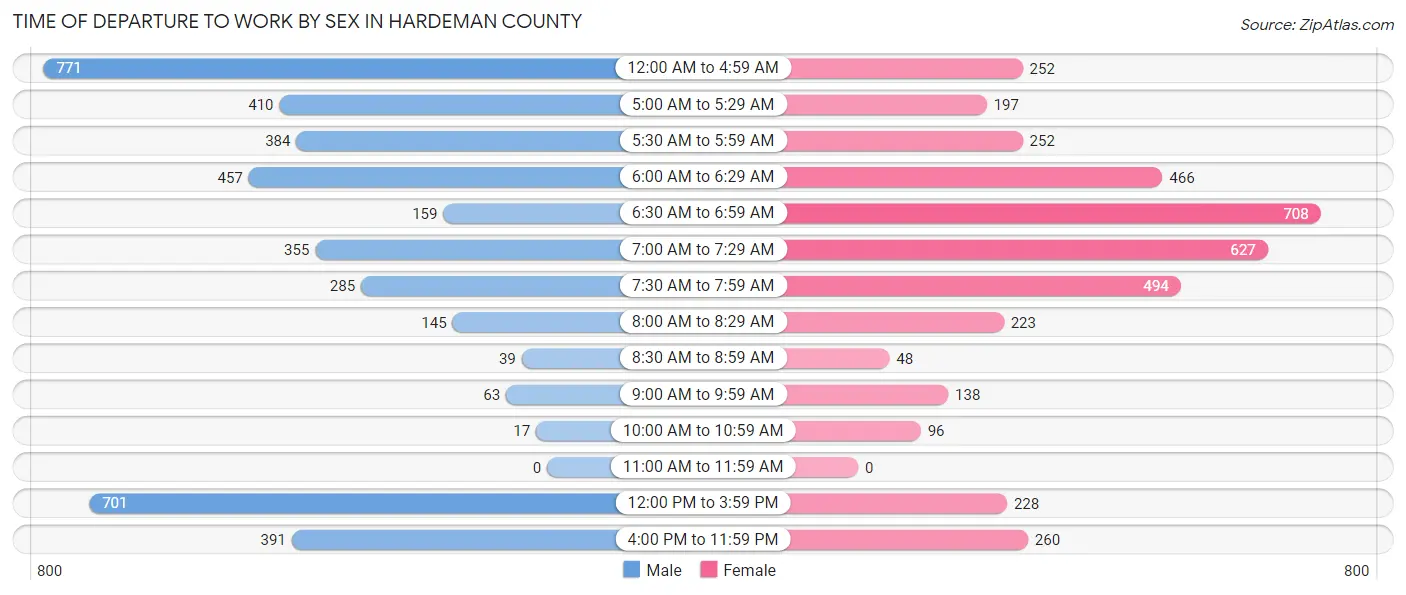
| Time of Departure | Male | Female |
| 12:00 AM to 4:59 AM | 771 (18.5%) | 252 (6.3%) |
| 5:00 AM to 5:29 AM | 410 (9.8%) | 197 (4.9%) |
| 5:30 AM to 5:59 AM | 384 (9.2%) | 252 (6.3%) |
| 6:00 AM to 6:29 AM | 457 (10.9%) | 466 (11.7%) |
| 6:30 AM to 6:59 AM | 159 (3.8%) | 708 (17.7%) |
| 7:00 AM to 7:29 AM | 355 (8.5%) | 627 (15.7%) |
| 7:30 AM to 7:59 AM | 285 (6.8%) | 494 (12.4%) |
| 8:00 AM to 8:29 AM | 145 (3.5%) | 223 (5.6%) |
| 8:30 AM to 8:59 AM | 39 (0.9%) | 48 (1.2%) |
| 9:00 AM to 9:59 AM | 63 (1.5%) | 138 (3.5%) |
| 10:00 AM to 10:59 AM | 17 (0.4%) | 96 (2.4%) |
| 11:00 AM to 11:59 AM | 0 (0.0%) | 0 (0.0%) |
| 12:00 PM to 3:59 PM | 701 (16.8%) | 228 (5.7%) |
| 4:00 PM to 11:59 PM | 391 (9.4%) | 260 (6.5%) |
| Total | 4,177 (100.0%) | 3,989 (100.0%) |
Housing Occupancy in Hardeman County
Occupancy by Ownership in Hardeman County
Of the total 9,009 dwellings in Hardeman County, owner-occupied units account for 6,364 (70.6%), while renter-occupied units make up 2,645 (29.4%).
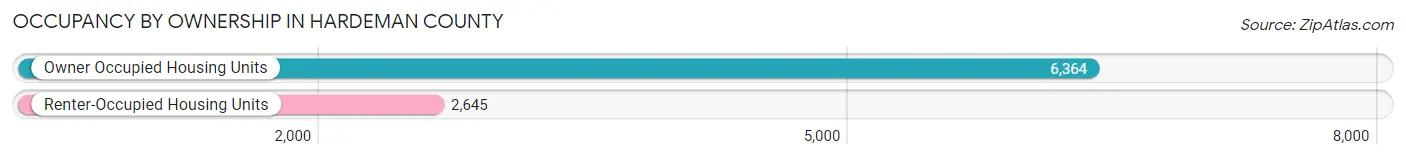
| Occupancy | # Housing Units | % Housing Units |
| Owner Occupied Housing Units | 6,364 | 70.6% |
| Renter-Occupied Housing Units | 2,645 | 29.4% |
| Total Occupied Housing Units | 9,009 | 100.0% |
Occupancy by Household Size in Hardeman County
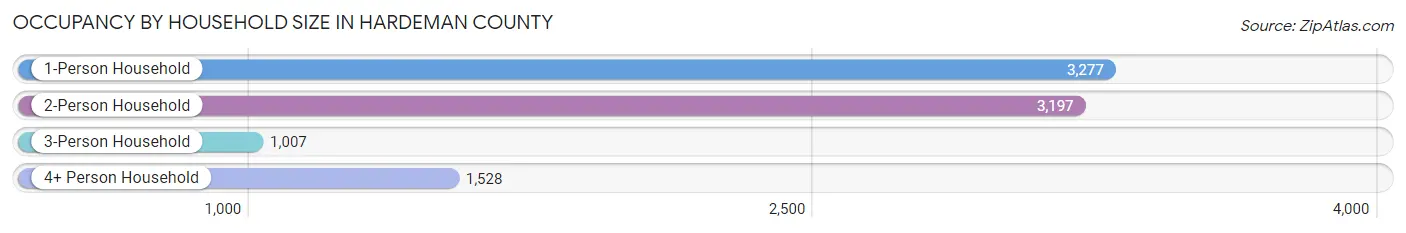
| Household Size | # Housing Units | % Housing Units |
| 1-Person Household | 3,277 | 36.4% |
| 2-Person Household | 3,197 | 35.5% |
| 3-Person Household | 1,007 | 11.2% |
| 4+ Person Household | 1,528 | 17.0% |
| Total Housing Units | 9,009 | 100.0% |
Occupancy by Ownership by Household Size in Hardeman County
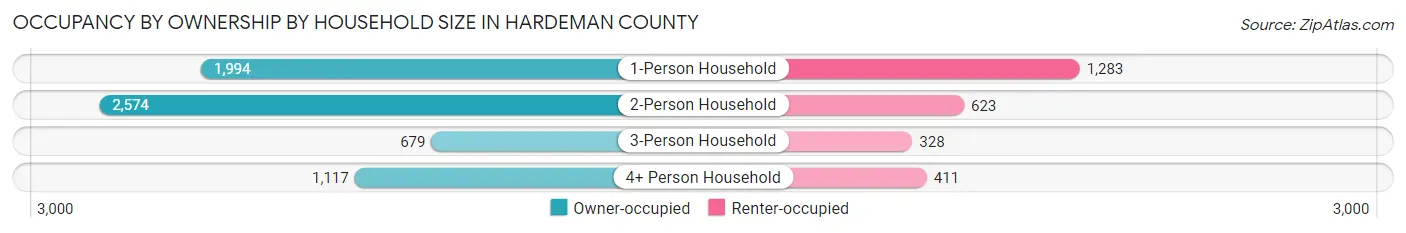
| Household Size | Owner-occupied | Renter-occupied |
| 1-Person Household | 1,994 (60.9%) | 1,283 (39.2%) |
| 2-Person Household | 2,574 (80.5%) | 623 (19.5%) |
| 3-Person Household | 679 (67.4%) | 328 (32.6%) |
| 4+ Person Household | 1,117 (73.1%) | 411 (26.9%) |
| Total Housing Units | 6,364 (70.6%) | 2,645 (29.4%) |
Occupancy by Educational Attainment in Hardeman County
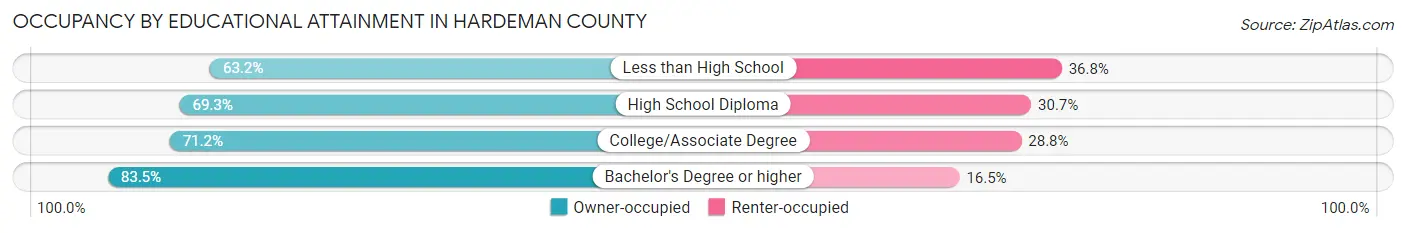
| Household Size | Owner-occupied | Renter-occupied |
| Less than High School | 751 (63.2%) | 437 (36.8%) |
| High School Diploma | 2,668 (69.3%) | 1,183 (30.7%) |
| College/Associate Degree | 2,146 (71.2%) | 867 (28.8%) |
| Bachelor's Degree or higher | 799 (83.5%) | 158 (16.5%) |
Occupancy by Age of Householder in Hardeman County
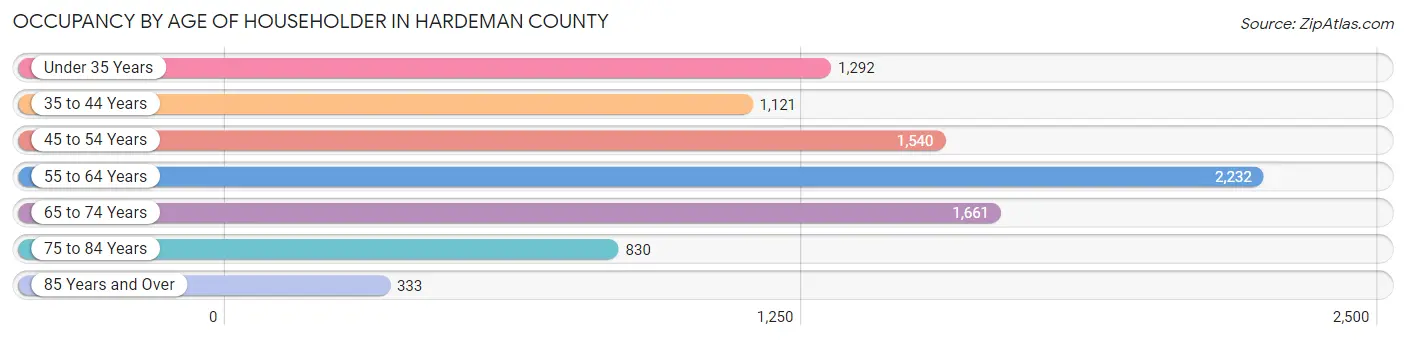
| Age Bracket | # Households | % Households |
| Under 35 Years | 1,292 | 14.3% |
| 35 to 44 Years | 1,121 | 12.4% |
| 45 to 54 Years | 1,540 | 17.1% |
| 55 to 64 Years | 2,232 | 24.8% |
| 65 to 74 Years | 1,661 | 18.4% |
| 75 to 84 Years | 830 | 9.2% |
| 85 Years and Over | 333 | 3.7% |
| Total | 9,009 | 100.0% |
Housing Finances in Hardeman County
Median Income by Occupancy in Hardeman County
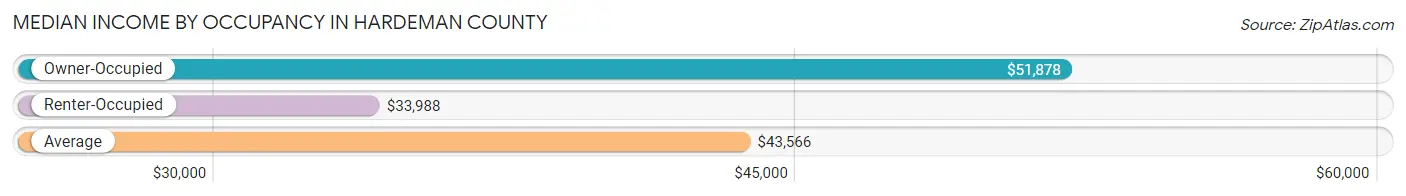
| Occupancy Type | # Households | Median Income |
| Owner-Occupied | 6,364 (70.6%) | $51,878 |
| Renter-Occupied | 2,645 (29.4%) | $33,988 |
| Average | 9,009 (100.0%) | $43,566 |
Occupancy by Householder Income Bracket in Hardeman County
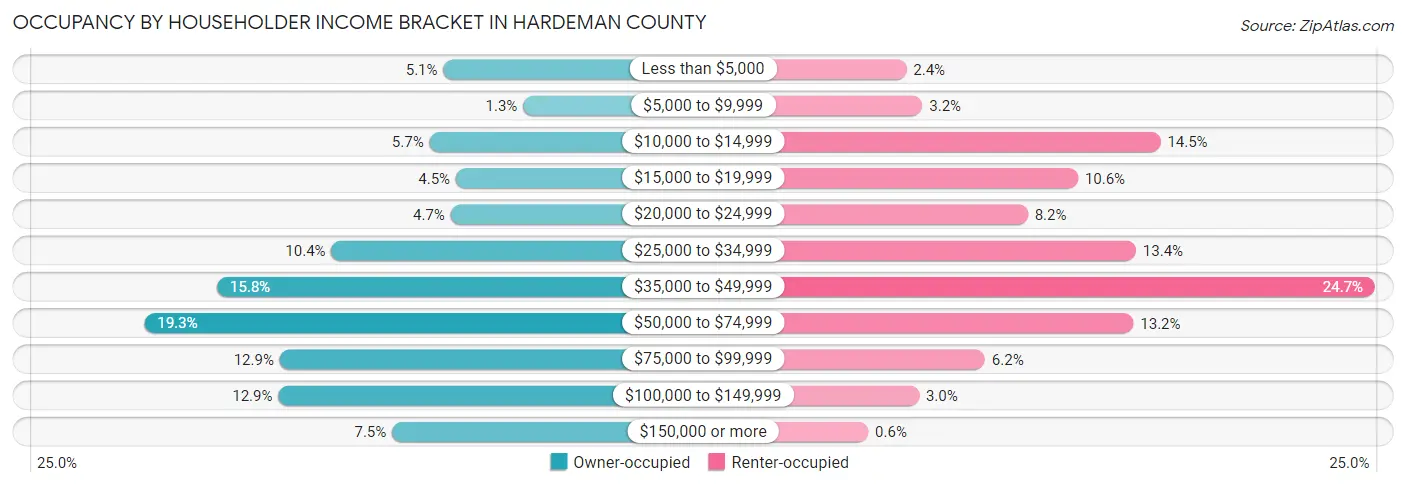
| Income Bracket | Owner-occupied | Renter-occupied |
| Less than $5,000 | 322 (5.1%) | 64 (2.4%) |
| $5,000 to $9,999 | 80 (1.3%) | 84 (3.2%) |
| $10,000 to $14,999 | 364 (5.7%) | 384 (14.5%) |
| $15,000 to $19,999 | 284 (4.5%) | 280 (10.6%) |
| $20,000 to $24,999 | 300 (4.7%) | 217 (8.2%) |
| $25,000 to $34,999 | 661 (10.4%) | 353 (13.4%) |
| $35,000 to $49,999 | 1,008 (15.8%) | 654 (24.7%) |
| $50,000 to $74,999 | 1,228 (19.3%) | 350 (13.2%) |
| $75,000 to $99,999 | 818 (12.9%) | 163 (6.2%) |
| $100,000 to $149,999 | 822 (12.9%) | 80 (3.0%) |
| $150,000 or more | 477 (7.5%) | 16 (0.6%) |
| Total | 6,364 (100.0%) | 2,645 (100.0%) |
Monthly Housing Cost Tiers in Hardeman County
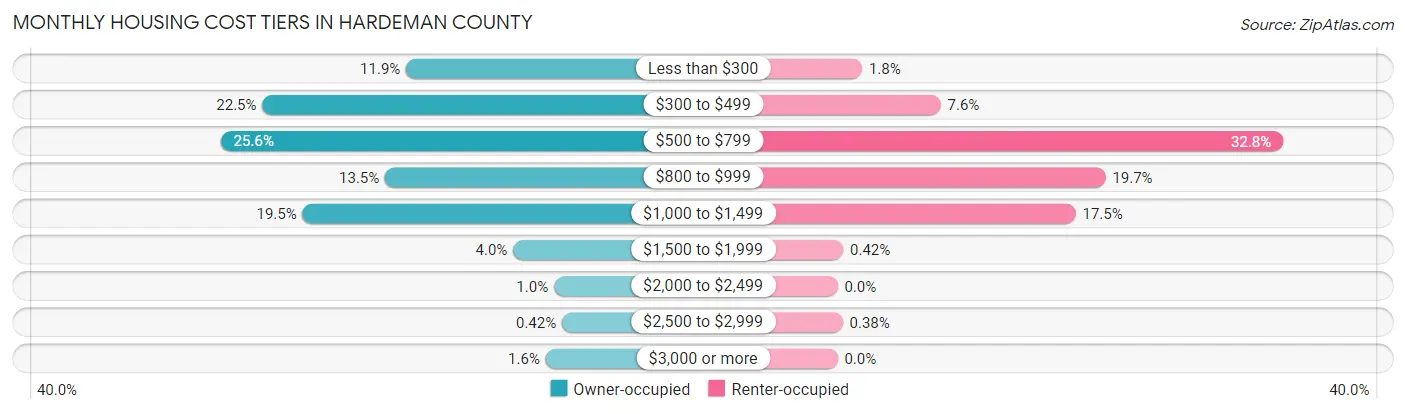
| Monthly Cost | Owner-occupied | Renter-occupied |
| Less than $300 | 757 (11.9%) | 48 (1.8%) |
| $300 to $499 | 1,431 (22.5%) | 201 (7.6%) |
| $500 to $799 | 1,627 (25.6%) | 868 (32.8%) |
| $800 to $999 | 856 (13.5%) | 522 (19.7%) |
| $1,000 to $1,499 | 1,243 (19.5%) | 464 (17.5%) |
| $1,500 to $1,999 | 256 (4.0%) | 11 (0.4%) |
| $2,000 to $2,499 | 64 (1.0%) | 0 (0.0%) |
| $2,500 to $2,999 | 27 (0.4%) | 10 (0.4%) |
| $3,000 or more | 103 (1.6%) | 0 (0.0%) |
| Total | 6,364 (100.0%) | 2,645 (100.0%) |
Physical Housing Characteristics in Hardeman County
Housing Structures in Hardeman County
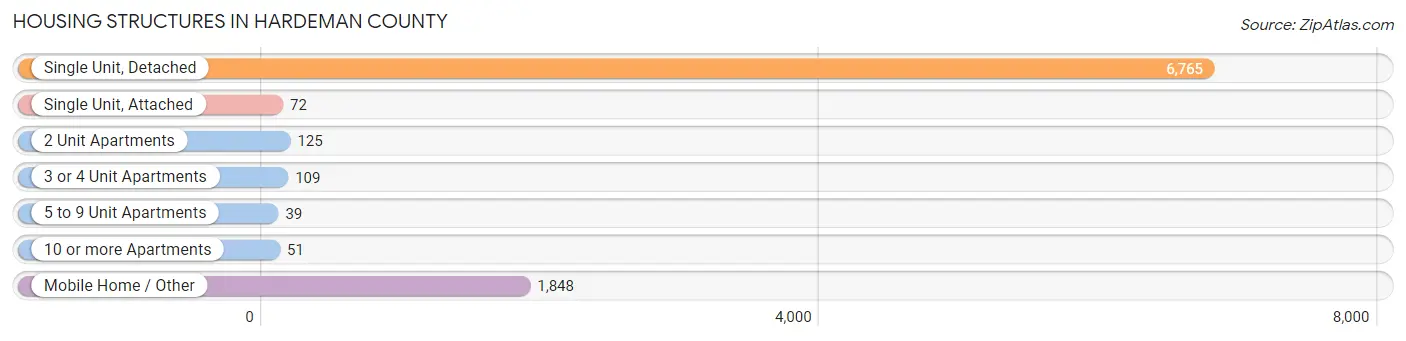
| Structure Type | # Housing Units | % Housing Units |
| Single Unit, Detached | 6,765 | 75.1% |
| Single Unit, Attached | 72 | 0.8% |
| 2 Unit Apartments | 125 | 1.4% |
| 3 or 4 Unit Apartments | 109 | 1.2% |
| 5 to 9 Unit Apartments | 39 | 0.4% |
| 10 or more Apartments | 51 | 0.6% |
| Mobile Home / Other | 1,848 | 20.5% |
| Total | 9,009 | 100.0% |
Housing Structures by Occupancy in Hardeman County
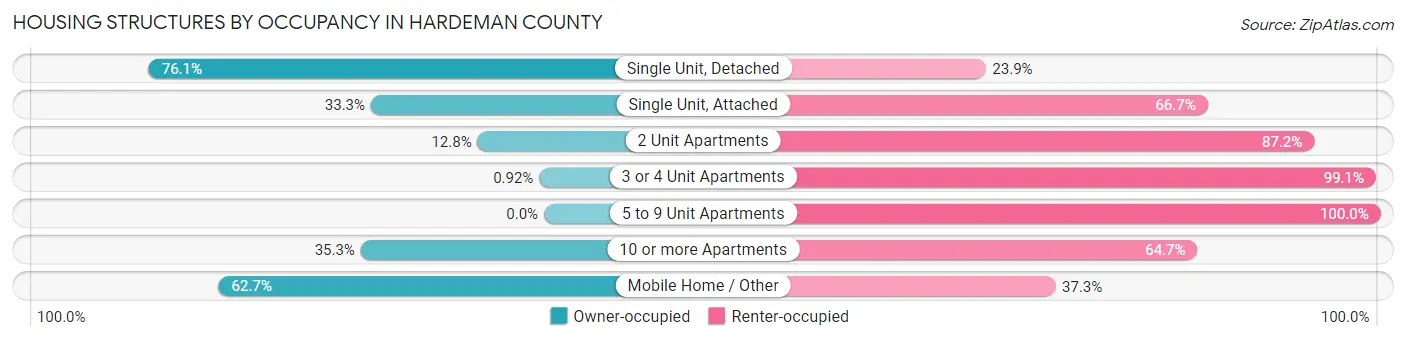
| Structure Type | Owner-occupied | Renter-occupied |
| Single Unit, Detached | 5,147 (76.1%) | 1,618 (23.9%) |
| Single Unit, Attached | 24 (33.3%) | 48 (66.7%) |
| 2 Unit Apartments | 16 (12.8%) | 109 (87.2%) |
| 3 or 4 Unit Apartments | 1 (0.9%) | 108 (99.1%) |
| 5 to 9 Unit Apartments | 0 (0.0%) | 39 (100.0%) |
| 10 or more Apartments | 18 (35.3%) | 33 (64.7%) |
| Mobile Home / Other | 1,158 (62.7%) | 690 (37.3%) |
| Total | 6,364 (70.6%) | 2,645 (29.4%) |
Housing Structures by Number of Rooms in Hardeman County
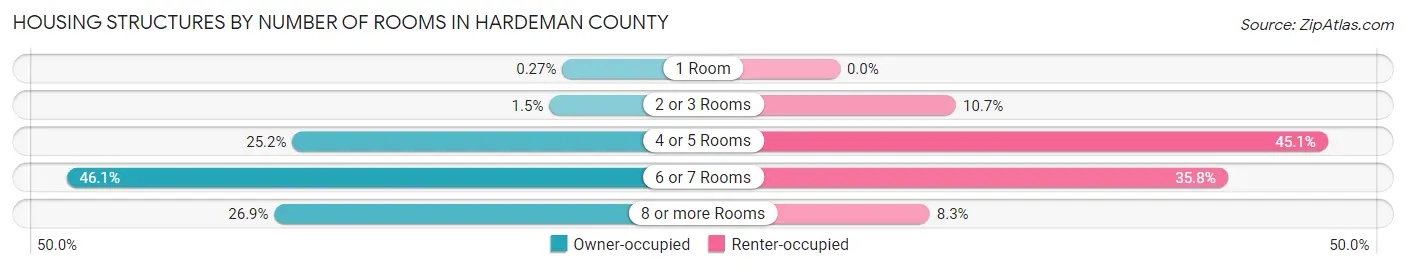
| Number of Rooms | Owner-occupied | Renter-occupied |
| 1 Room | 17 (0.3%) | 0 (0.0%) |
| 2 or 3 Rooms | 94 (1.5%) | 284 (10.7%) |
| 4 or 5 Rooms | 1,606 (25.2%) | 1,193 (45.1%) |
| 6 or 7 Rooms | 2,935 (46.1%) | 948 (35.8%) |
| 8 or more Rooms | 1,712 (26.9%) | 220 (8.3%) |
| Total | 6,364 (100.0%) | 2,645 (100.0%) |
Housing Structure by Heating Type in Hardeman County
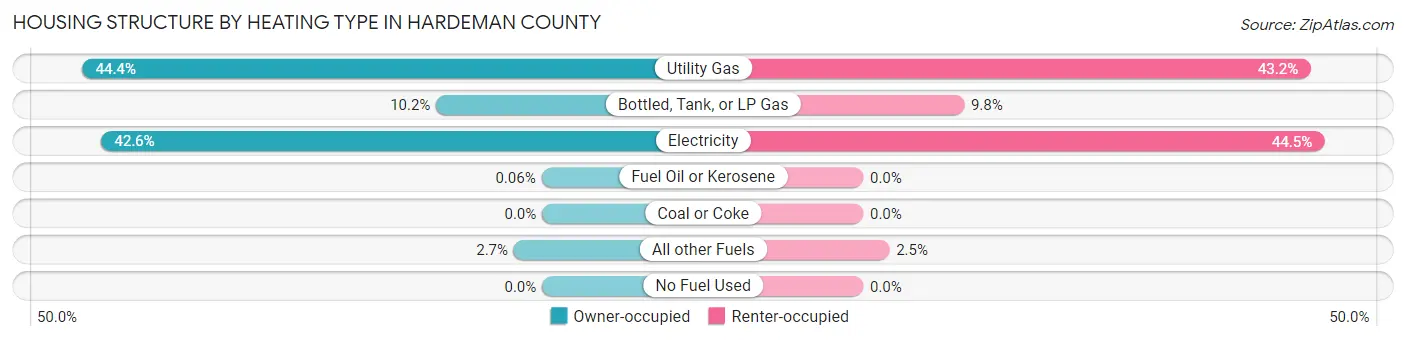
| Heating Type | Owner-occupied | Renter-occupied |
| Utility Gas | 2,825 (44.4%) | 1,142 (43.2%) |
| Bottled, Tank, or LP Gas | 651 (10.2%) | 258 (9.8%) |
| Electricity | 2,710 (42.6%) | 1,178 (44.5%) |
| Fuel Oil or Kerosene | 4 (0.1%) | 0 (0.0%) |
| Coal or Coke | 0 (0.0%) | 0 (0.0%) |
| All other Fuels | 174 (2.7%) | 67 (2.5%) |
| No Fuel Used | 0 (0.0%) | 0 (0.0%) |
| Total | 6,364 (100.0%) | 2,645 (100.0%) |
Household Vehicle Usage in Hardeman County
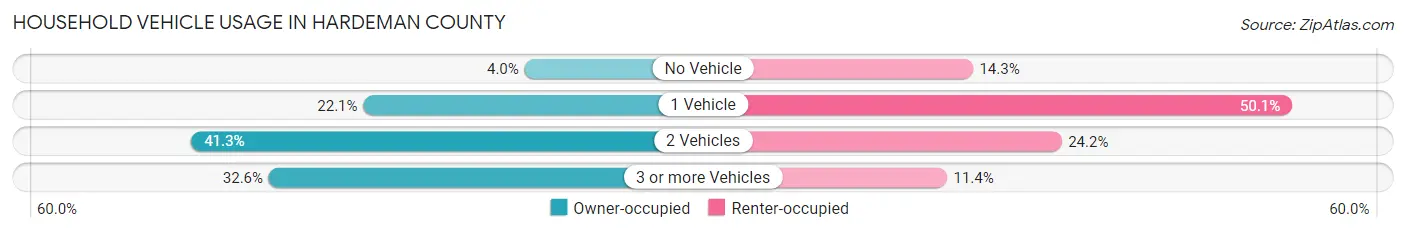
| Vehicles per Household | Owner-occupied | Renter-occupied |
| No Vehicle | 254 (4.0%) | 378 (14.3%) |
| 1 Vehicle | 1,403 (22.1%) | 1,325 (50.1%) |
| 2 Vehicles | 2,630 (41.3%) | 641 (24.2%) |
| 3 or more Vehicles | 2,077 (32.6%) | 301 (11.4%) |
| Total | 6,364 (100.0%) | 2,645 (100.0%) |
Real Estate & Mortgages in Hardeman County
Real Estate and Mortgage Overview in Hardeman County
| Characteristic | Without Mortgage | With Mortgage |
| Housing Units | 3,265 | 3,099 |
| Median Property Value | $107,800 | $118,400 |
| Median Household Income | $44,421 | $277 |
| Monthly Housing Costs | $423 | $68 |
| Real Estate Taxes | $737 | $86 |
Property Value by Mortgage Status in Hardeman County
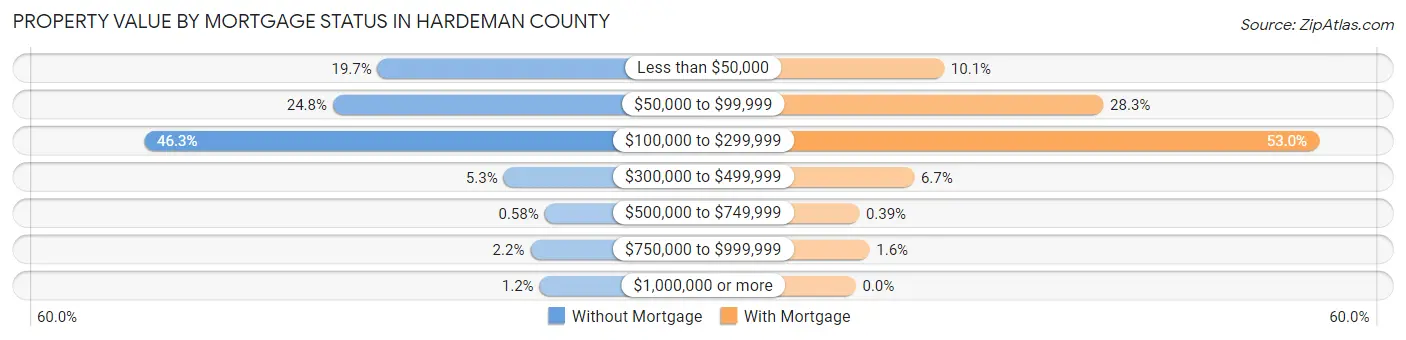
| Property Value | Without Mortgage | With Mortgage |
| Less than $50,000 | 642 (19.7%) | 313 (10.1%) |
| $50,000 to $99,999 | 809 (24.8%) | 877 (28.3%) |
| $100,000 to $299,999 | 1,513 (46.3%) | 1,641 (52.9%) |
| $300,000 to $499,999 | 172 (5.3%) | 207 (6.7%) |
| $500,000 to $749,999 | 19 (0.6%) | 12 (0.4%) |
| $750,000 to $999,999 | 72 (2.2%) | 49 (1.6%) |
| $1,000,000 or more | 38 (1.2%) | 0 (0.0%) |
| Total | 3,265 (100.0%) | 3,099 (100.0%) |
Household Income by Mortgage Status in Hardeman County
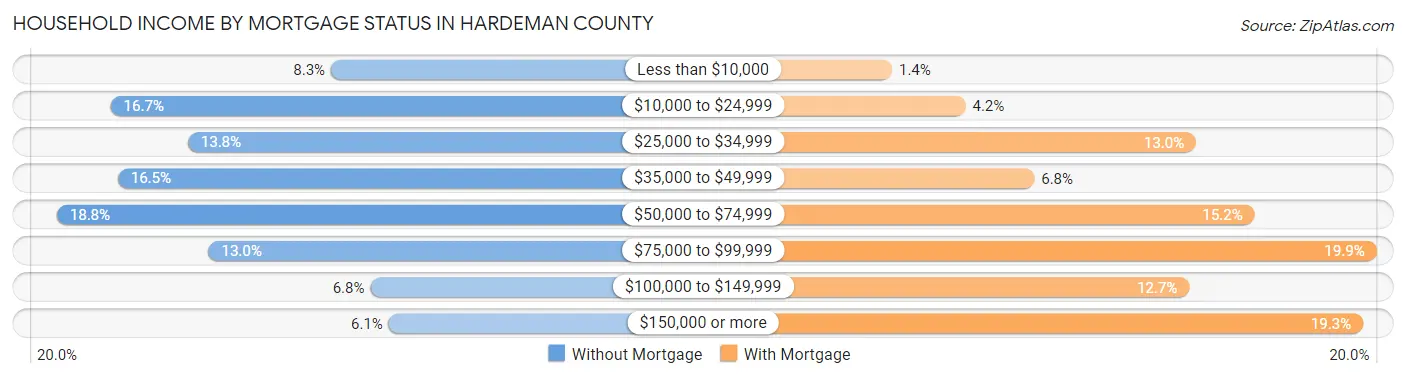
| Household Income | Without Mortgage | With Mortgage |
| Less than $10,000 | 272 (8.3%) | 43 (1.4%) |
| $10,000 to $24,999 | 546 (16.7%) | 130 (4.2%) |
| $25,000 to $34,999 | 450 (13.8%) | 402 (13.0%) |
| $35,000 to $49,999 | 537 (16.5%) | 211 (6.8%) |
| $50,000 to $74,999 | 613 (18.8%) | 471 (15.2%) |
| $75,000 to $99,999 | 424 (13.0%) | 615 (19.9%) |
| $100,000 to $149,999 | 223 (6.8%) | 394 (12.7%) |
| $150,000 or more | 200 (6.1%) | 599 (19.3%) |
| Total | 3,265 (100.0%) | 3,099 (100.0%) |
Property Value to Household Income Ratio in Hardeman County
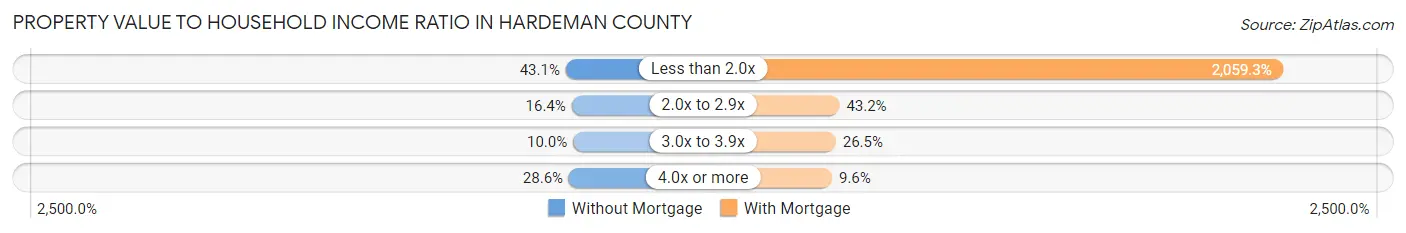
| Value-to-Income Ratio | Without Mortgage | With Mortgage |
| Less than 2.0x | 1,406 (43.1%) | 63,817 (2,059.3%) |
| 2.0x to 2.9x | 535 (16.4%) | 1,340 (43.2%) |
| 3.0x to 3.9x | 326 (10.0%) | 822 (26.5%) |
| 4.0x or more | 935 (28.6%) | 297 (9.6%) |
| Total | 3,265 (100.0%) | 3,099 (100.0%) |
Real Estate Taxes by Mortgage Status in Hardeman County
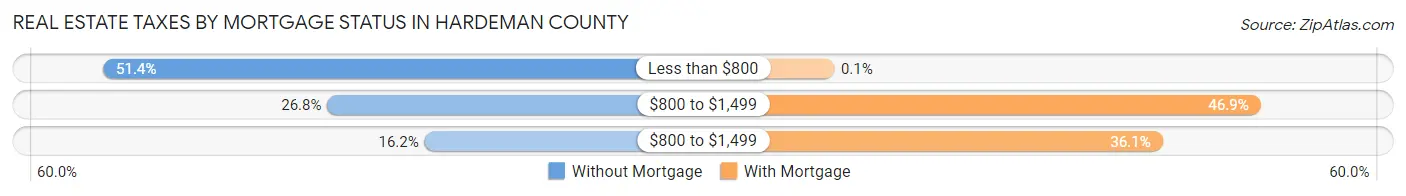
| Property Taxes | Without Mortgage | With Mortgage |
| Less than $800 | 1,678 (51.4%) | 3 (0.1%) |
| $800 to $1,499 | 876 (26.8%) | 1,452 (46.9%) |
| $800 to $1,499 | 528 (16.2%) | 1,119 (36.1%) |
| Total | 3,265 (100.0%) | 3,099 (100.0%) |
Health & Disability in Hardeman County
Health Insurance Coverage by Age in Hardeman County
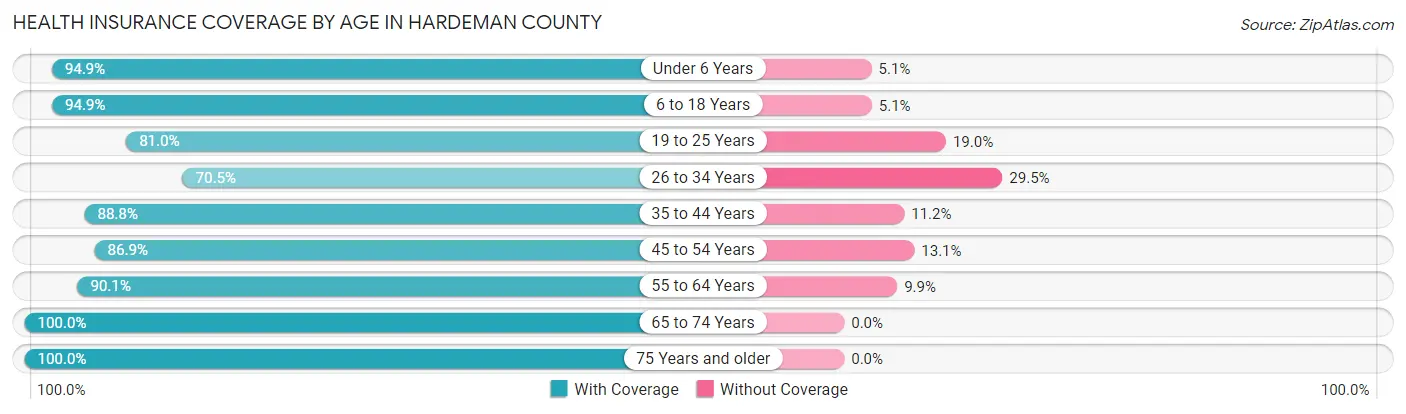
| Age Bracket | With Coverage | Without Coverage |
| Under 6 Years | 1,360 (94.9%) | 73 (5.1%) |
| 6 to 18 Years | 3,452 (94.9%) | 187 (5.1%) |
| 19 to 25 Years | 1,539 (81.0%) | 360 (19.0%) |
| 26 to 34 Years | 1,926 (70.5%) | 805 (29.5%) |
| 35 to 44 Years | 1,802 (88.8%) | 227 (11.2%) |
| 45 to 54 Years | 2,161 (86.9%) | 325 (13.1%) |
| 55 to 64 Years | 2,876 (90.1%) | 315 (9.9%) |
| 65 to 74 Years | 2,775 (100.0%) | 0 (0.0%) |
| 75 Years and older | 1,825 (100.0%) | 0 (0.0%) |
| Total | 19,716 (89.6%) | 2,292 (10.4%) |
Health Insurance Coverage by Citizenship Status in Hardeman County
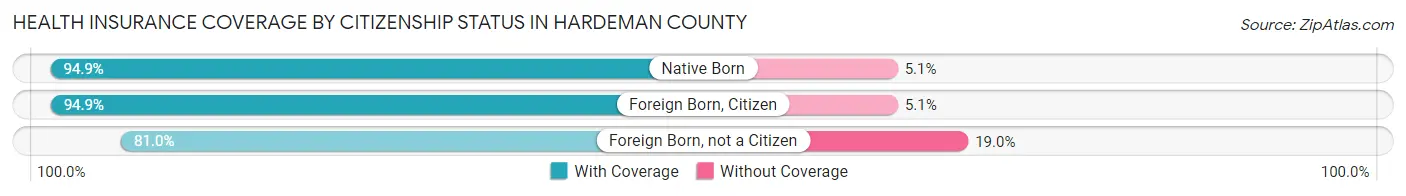
| Citizenship Status | With Coverage | Without Coverage |
| Native Born | 1,360 (94.9%) | 73 (5.1%) |
| Foreign Born, Citizen | 3,452 (94.9%) | 187 (5.1%) |
| Foreign Born, not a Citizen | 1,539 (81.0%) | 360 (19.0%) |
Health Insurance Coverage by Household Income in Hardeman County
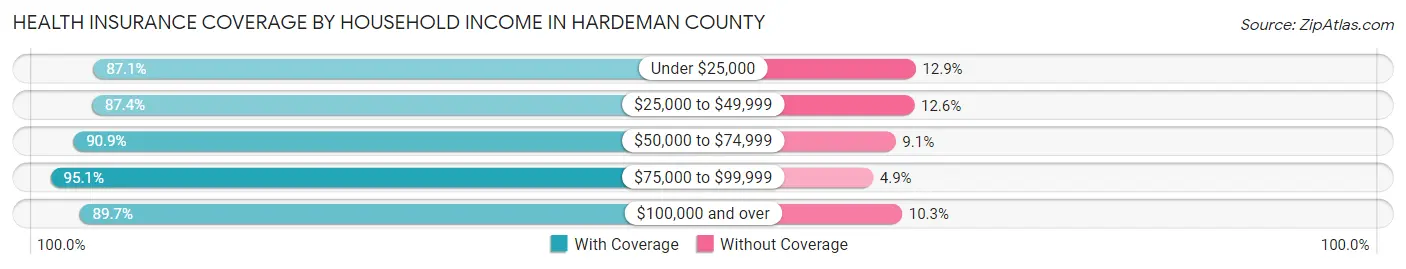
| Household Income | With Coverage | Without Coverage |
| Under $25,000 | 3,342 (87.1%) | 493 (12.9%) |
| $25,000 to $49,999 | 5,410 (87.4%) | 780 (12.6%) |
| $50,000 to $74,999 | 3,632 (90.9%) | 364 (9.1%) |
| $75,000 to $99,999 | 2,863 (95.1%) | 147 (4.9%) |
| $100,000 and over | 4,340 (89.7%) | 499 (10.3%) |
Public vs Private Health Insurance Coverage by Age in Hardeman County
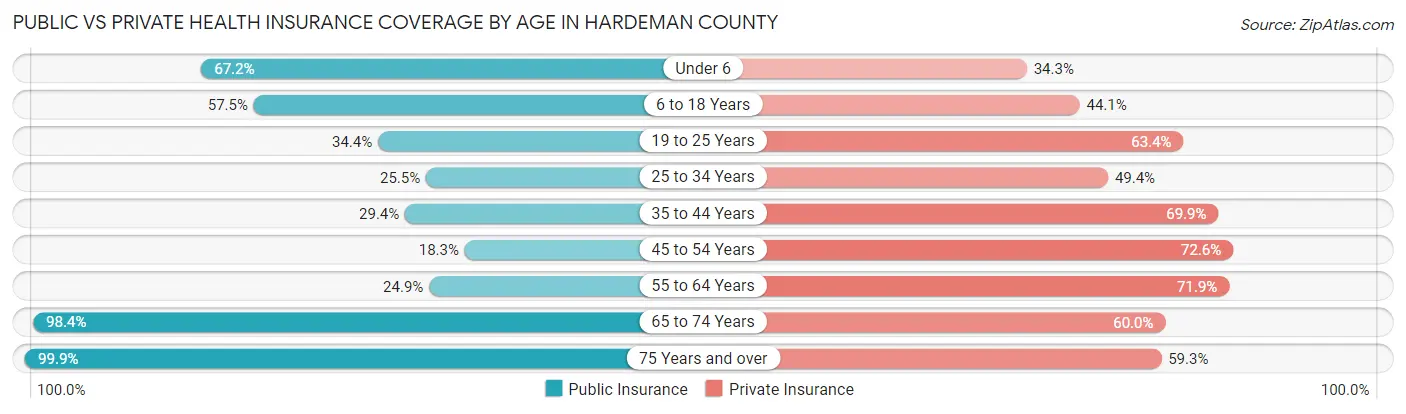
| Age Bracket | Public Insurance | Private Insurance |
| Under 6 | 963 (67.2%) | 492 (34.3%) |
| 6 to 18 Years | 2,091 (57.5%) | 1,606 (44.1%) |
| 19 to 25 Years | 653 (34.4%) | 1,204 (63.4%) |
| 25 to 34 Years | 696 (25.5%) | 1,349 (49.4%) |
| 35 to 44 Years | 596 (29.4%) | 1,418 (69.9%) |
| 45 to 54 Years | 455 (18.3%) | 1,805 (72.6%) |
| 55 to 64 Years | 795 (24.9%) | 2,294 (71.9%) |
| 65 to 74 Years | 2,731 (98.4%) | 1,666 (60.0%) |
| 75 Years and over | 1,823 (99.9%) | 1,082 (59.3%) |
| Total | 10,803 (49.1%) | 12,916 (58.7%) |
Disability Status by Sex by Age in Hardeman County
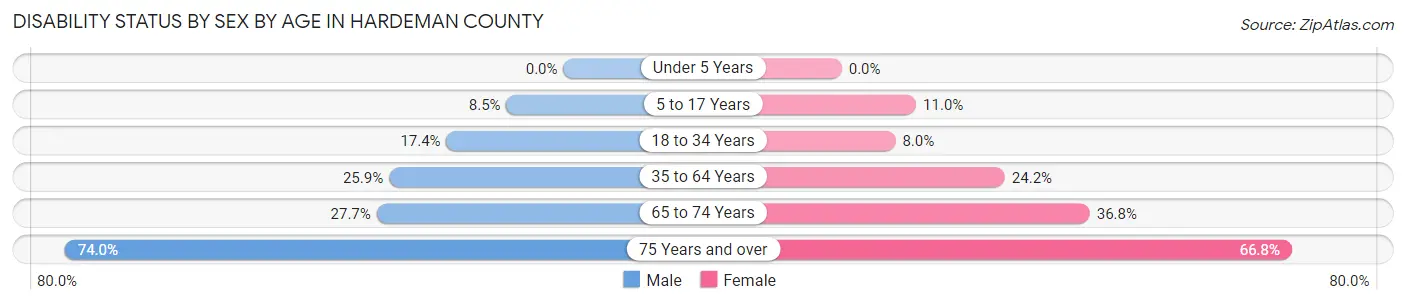
| Age Bracket | Male | Female |
| Under 5 Years | 0 (0.0%) | 0 (0.0%) |
| 5 to 17 Years | 152 (8.5%) | 201 (11.0%) |
| 18 to 34 Years | 476 (17.4%) | 168 (8.0%) |
| 35 to 64 Years | 894 (25.9%) | 1,030 (24.2%) |
| 65 to 74 Years | 363 (27.7%) | 540 (36.8%) |
| 75 Years and over | 530 (74.0%) | 741 (66.8%) |
Disability Class by Sex by Age in Hardeman County
Disability Class: Hearing Difficulty
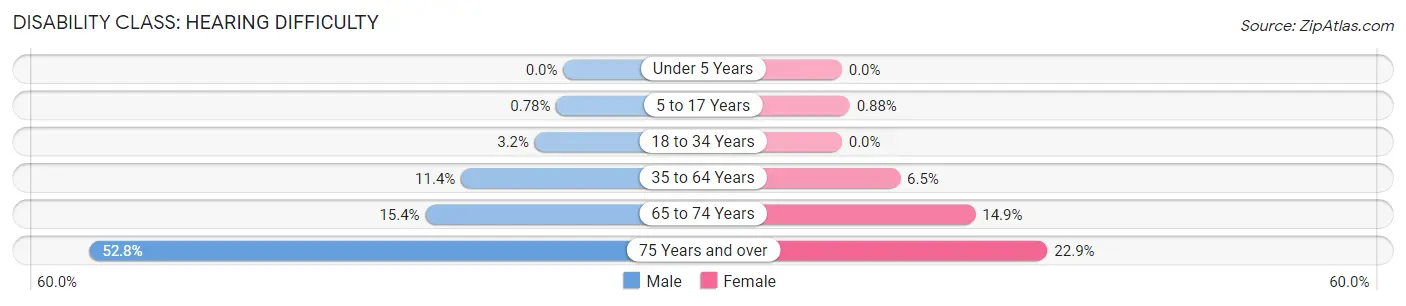
| Age Bracket | Male | Female |
| Under 5 Years | 0 (0.0%) | 0 (0.0%) |
| 5 to 17 Years | 14 (0.8%) | 16 (0.9%) |
| 18 to 34 Years | 87 (3.2%) | 0 (0.0%) |
| 35 to 64 Years | 393 (11.4%) | 276 (6.5%) |
| 65 to 74 Years | 201 (15.4%) | 218 (14.9%) |
| 75 Years and over | 378 (52.8%) | 254 (22.9%) |
Disability Class: Vision Difficulty
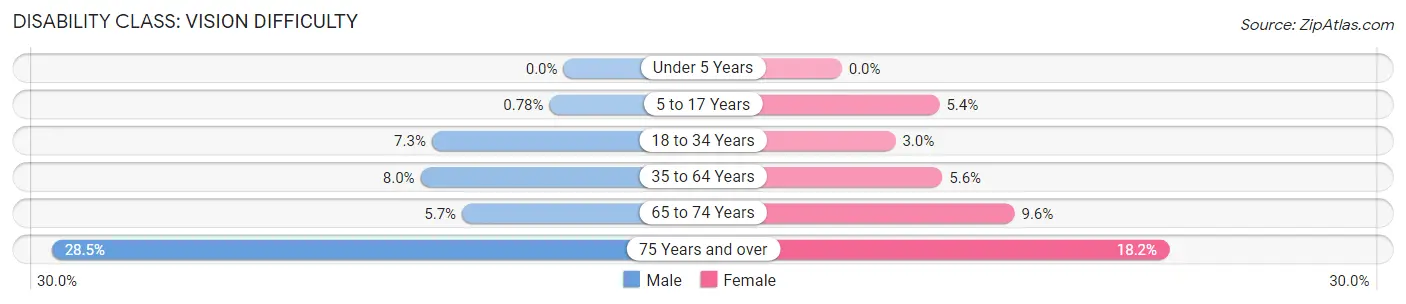
| Age Bracket | Male | Female |
| Under 5 Years | 0 (0.0%) | 0 (0.0%) |
| 5 to 17 Years | 14 (0.8%) | 99 (5.4%) |
| 18 to 34 Years | 201 (7.3%) | 63 (3.0%) |
| 35 to 64 Years | 275 (8.0%) | 238 (5.6%) |
| 65 to 74 Years | 74 (5.7%) | 141 (9.6%) |
| 75 Years and over | 204 (28.5%) | 202 (18.2%) |
Disability Class: Cognitive Difficulty
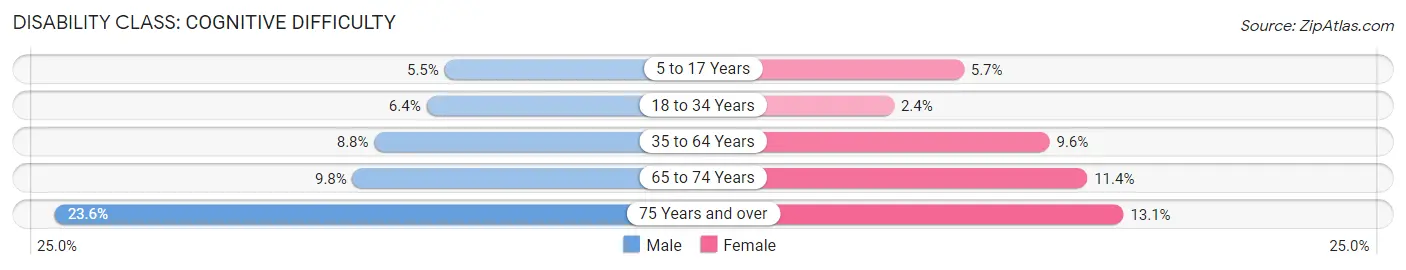
| Age Bracket | Male | Female |
| 5 to 17 Years | 99 (5.5%) | 103 (5.7%) |
| 18 to 34 Years | 174 (6.4%) | 51 (2.4%) |
| 35 to 64 Years | 303 (8.8%) | 410 (9.6%) |
| 65 to 74 Years | 128 (9.8%) | 167 (11.4%) |
| 75 Years and over | 169 (23.6%) | 145 (13.1%) |
Disability Class: Ambulatory Difficulty
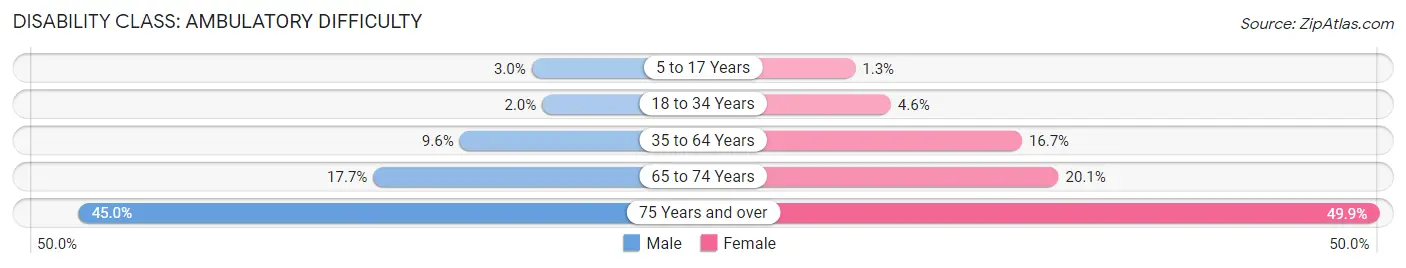
| Age Bracket | Male | Female |
| 5 to 17 Years | 53 (2.9%) | 23 (1.3%) |
| 18 to 34 Years | 54 (2.0%) | 96 (4.6%) |
| 35 to 64 Years | 333 (9.6%) | 711 (16.7%) |
| 65 to 74 Years | 231 (17.6%) | 295 (20.1%) |
| 75 Years and over | 322 (45.0%) | 553 (49.9%) |
Disability Class: Self-Care Difficulty
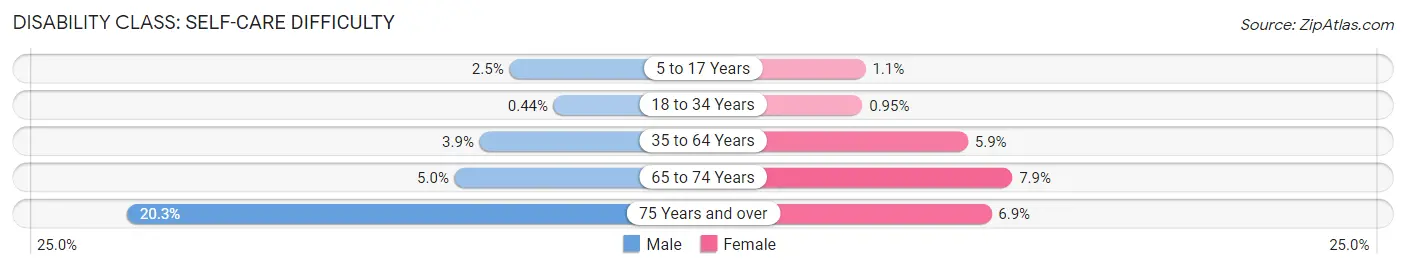
| Age Bracket | Male | Female |
| 5 to 17 Years | 45 (2.5%) | 20 (1.1%) |
| 18 to 34 Years | 12 (0.4%) | 20 (0.9%) |
| 35 to 64 Years | 134 (3.9%) | 249 (5.9%) |
| 65 to 74 Years | 66 (5.0%) | 116 (7.9%) |
| 75 Years and over | 145 (20.3%) | 77 (6.9%) |
Technology Access in Hardeman County
Computing Device Access in Hardeman County
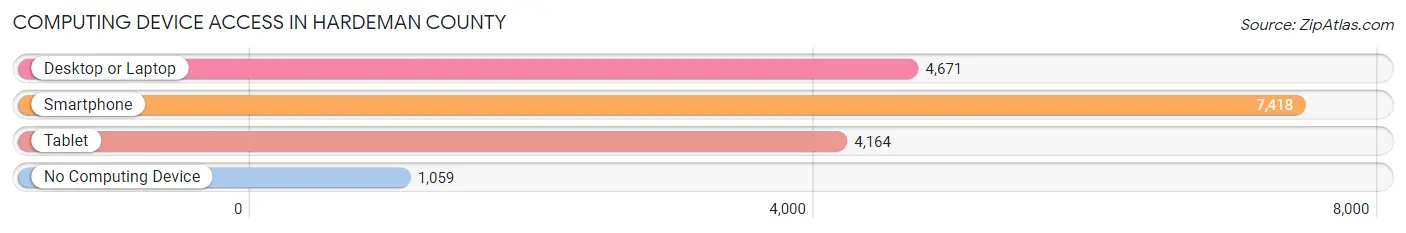
| Device Type | # Households | % Households |
| Desktop or Laptop | 4,671 | 51.8% |
| Smartphone | 7,418 | 82.3% |
| Tablet | 4,164 | 46.2% |
| No Computing Device | 1,059 | 11.7% |
| Total | 9,009 | 100.0% |
Internet Access in Hardeman County
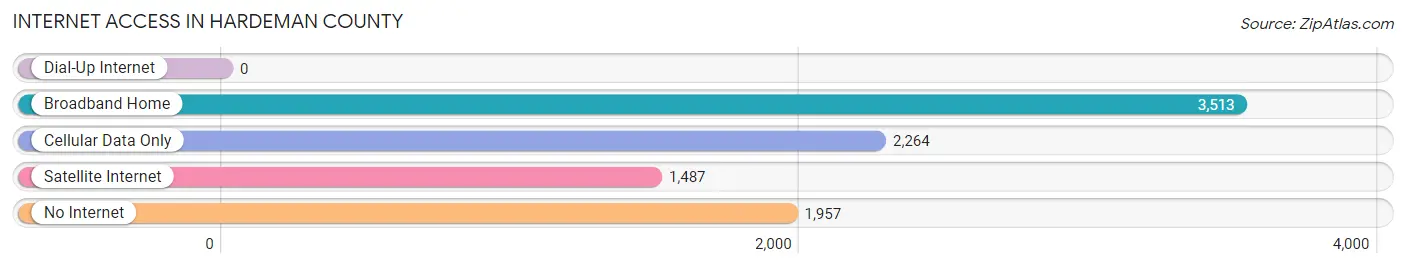
| Internet Type | # Households | % Households |
| Dial-Up Internet | 0 | 0.0% |
| Broadband Home | 3,513 | 39.0% |
| Cellular Data Only | 2,264 | 25.1% |
| Satellite Internet | 1,487 | 16.5% |
| No Internet | 1,957 | 21.7% |
| Total | 9,009 | 100.0% |
Hardeman County Summary
Hardeman County is located in the western part of the state of Tennessee, in the United States. It is bordered by Madison County to the north, Fayette County to the east, McNairy County to the south, and Hardin County to the west. The county seat is Bolivar, and the largest city is Whiteville. The county was created in 1823 and named for Thomas Jones Hardeman, a soldier in the War of 1812 and a member of the Tennessee General Assembly.
Geography
Hardeman County covers an area of 545 square miles, of which 543 square miles is land and 2 square miles is water. The county is located in the Central Basin of West Tennessee, and is part of the Mississippi Alluvial Plain. The terrain is mostly flat, with some rolling hills in the northern part of the county. The highest point in the county is located in the northwest corner, at an elevation of 590 feet. The county is drained by the Hatchie River, which flows through the center of the county.
The county is home to several state parks and wildlife management areas, including the Hatchie National Wildlife Refuge, the Chickasaw State Park, and the Natchez Trace State Park. The county also contains several lakes, including the Hatchie River Lake, the Whiteville Lake, and the Bolivar Lake.
Demographics
As of the 2010 census, there were 27,253 people, 10,541 households, and 7,541 families living in the county. The population density was 50 people per square mile. The racial makeup of the county was 73.3% White, 24.2% African American, 0.3% Native American, 0.2% Asian, 0.1% Pacific Islander, 0.7% from other races, and 1.3% from two or more races. Hispanic or Latino of any race were 1.7% of the population.
The median income for a household in the county was $35,945, and the median income for a family was $43,945. The per capita income for the county was $17,845. About 19.2% of families and 23.2% of the population were below the poverty line, including 33.2% of those under age 18 and 17.2% of those age 65 or over.
Economy
The economy of Hardeman County is largely based on agriculture. The county is home to several large farms, and the main crops grown in the county are cotton, soybeans, corn, and wheat. The county is also home to several manufacturing companies, including a furniture factory, a paper mill, and a plastics factory.
The county is also home to several tourist attractions, including the Hatchie National Wildlife Refuge, the Chickasaw State Park, and the Natchez Trace State Park. The county is also home to several historic sites, including the Bolivar Commercial Historic District, the Whiteville Historic District, and the Hardeman County Courthouse.
Conclusion
Hardeman County is a rural county located in the western part of Tennessee. It is home to several state parks and wildlife management areas, and is largely dependent on agriculture for its economy. The county is also home to several tourist attractions and historic sites, making it a popular destination for visitors.
Common Questions
What is Per Capita Income in Hardeman County?
Per Capita income in Hardeman County is $22,098.
What is the Median Family Income in Hardeman County?
Median Family Income in Hardeman County is $62,422.
What is the Median Household income in Hardeman County?
Median Household Income in Hardeman County is $43,566.
What is Income or Wage Gap in Hardeman County?
Income or Wage Gap in Hardeman County is 17.4%.
Women in Hardeman County earn 82.6 cents for every dollar earned by a man.
What is Family Income Deficit in Hardeman County?
Family Income Deficit in Hardeman County is $10,455.
Families that are below poverty line in Hardeman County earn $10,455 less on average than the poverty threshold level.
What is Inequality or Gini Index in Hardeman County?
Inequality or Gini Index in Hardeman County is 0.43.
What is the Total Population of Hardeman County?
Total Population of Hardeman County is 25,519.
What is the Total Male Population of Hardeman County?
Total Male Population of Hardeman County is 14,142.
What is the Total Female Population of Hardeman County?
Total Female Population of Hardeman County is 11,377.
What is the Ratio of Males per 100 Females in Hardeman County?
There are 124.30 Males per 100 Females in Hardeman County.
What is the Ratio of Females per 100 Males in Hardeman County?
There are 80.45 Females per 100 Males in Hardeman County.
What is the Median Population Age in Hardeman County?
Median Population Age in Hardeman County is 40.7 Years.
What is the Average Family Size in Hardeman County
Average Family Size in Hardeman County is 3.2 People.
What is the Average Household Size in Hardeman County
Average Household Size in Hardeman County is 2.4 People.
How Large is the Labor Force in Hardeman County?
There are 10,383 People in the Labor Forcein in Hardeman County.
What is the Percentage of People in the Labor Force in Hardeman County?
48.7% of People are in the Labor Force in Hardeman County.
What is the Unemployment Rate in Hardeman County?
Unemployment Rate in Hardeman County is 12.8%.