Decatur County, TN Map & Demographics
Decatur County Overview
$27,578
PER CAPITA INCOME
$63,795
AVG FAMILY INCOME
$48,466
AVG HOUSEHOLD INCOME
25.8%
WAGE / INCOME GAP [ % ]
74.2¢/ $1
WAGE / INCOME GAP [ $ ]
$10,237
FAMILY INCOME DEFICIT
0.49
INEQUALITY / GINI INDEX
11,483
TOTAL POPULATION
5,661
MALE POPULATION
5,822
FEMALE POPULATION
97.23
MALES / 100 FEMALES
102.84
FEMALES / 100 MALES
45.8
MEDIAN AGE
3.1
AVG FAMILY SIZE
2.6
AVG HOUSEHOLD SIZE
4,795
LABOR FORCE [ PEOPLE ]
50.8%
PERCENT IN LABOR FORCE
7.9%
UNEMPLOYMENT RATE
Income in Decatur County
Income Overview in Decatur County
Per Capita Income in Decatur County is $27,578, while median incomes of families and households are $63,795 and $48,466 respectively.
| Characteristic | Number | Measure |
| Per Capita Income | 11,483 | $27,578 |
| Median Family Income | 3,039 | $63,795 |
| Mean Family Income | 3,039 | $81,289 |
| Median Household Income | 4,363 | $48,466 |
| Mean Household Income | 4,363 | $68,881 |
| Income Deficit | 3,039 | $10,237 |
| Wage / Income Gap (%) | 11,483 | 25.84% |
| Wage / Income Gap ($) | 11,483 | 74.16¢ per $1 |
| Gini / Inequality Index | 11,483 | 0.49 |
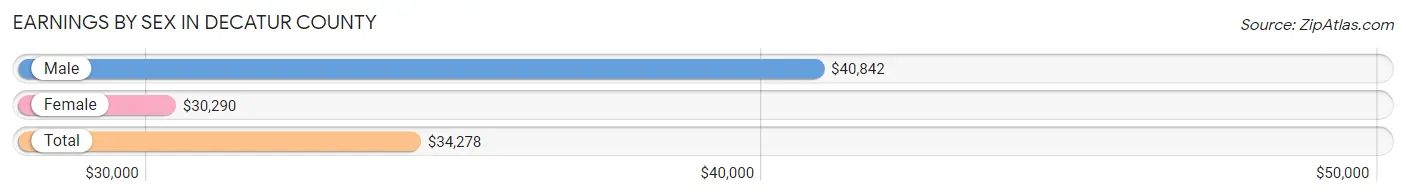
Earnings by Sex in Decatur County
Average Earnings in Decatur County are $34,278, $40,842 for men and $30,290 for women, a difference of 25.8%.
| Sex | Number | Average Earnings |
| Male | 2,527 (53.0%) | $40,842 |
| Female | 2,238 (47.0%) | $30,290 |
| Total | 4,765 (100.0%) | $34,278 |
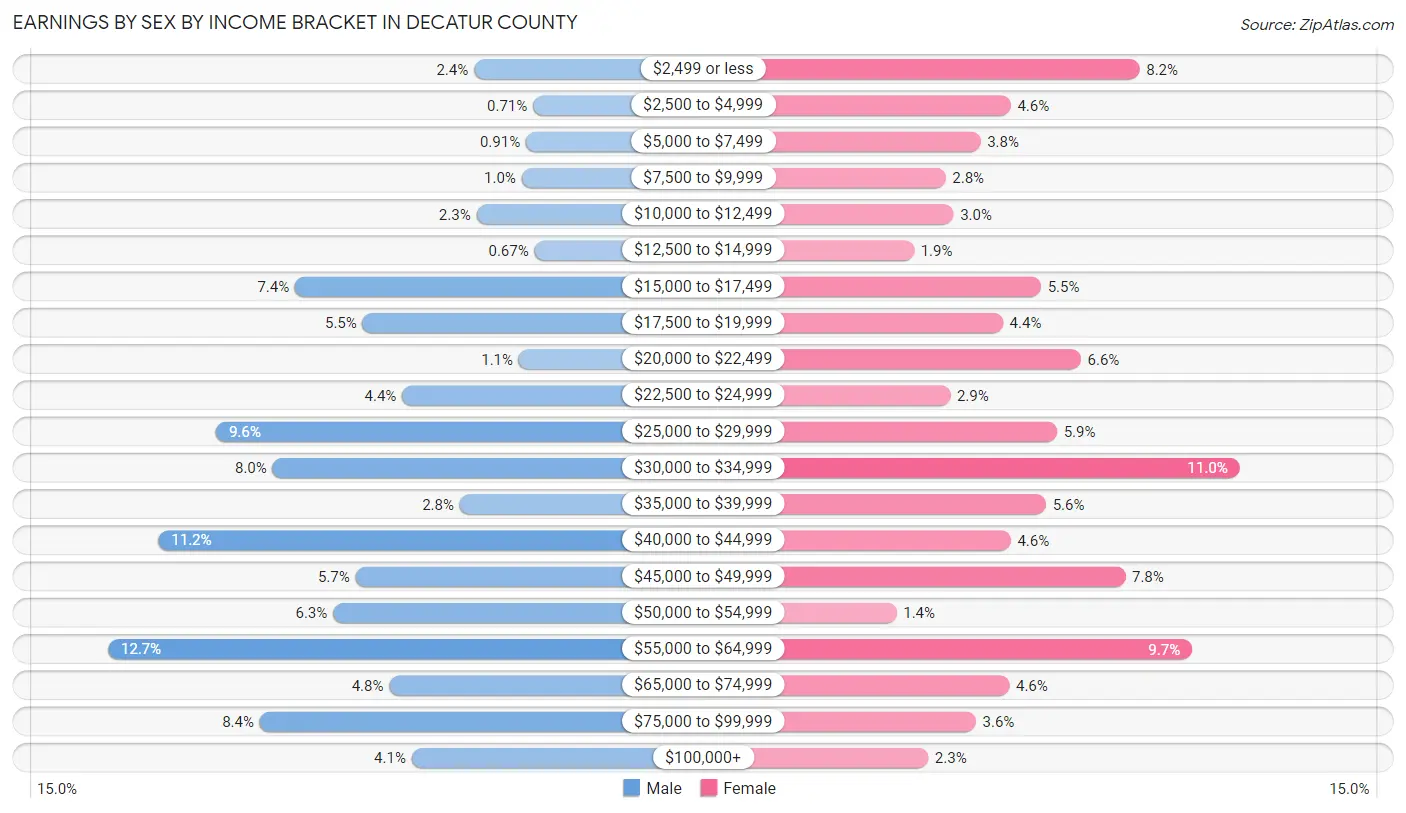
Earnings by Sex by Income Bracket in Decatur County
The most common earnings brackets in Decatur County are $55,000 to $64,999 for men (320 | 12.7%) and $30,000 to $34,999 for women (247 | 11.0%).
| Income | Male | Female |
| $2,499 or less | 60 (2.4%) | 184 (8.2%) |
| $2,500 to $4,999 | 18 (0.7%) | 103 (4.6%) |
| $5,000 to $7,499 | 23 (0.9%) | 84 (3.7%) |
| $7,500 to $9,999 | 26 (1.0%) | 62 (2.8%) |
| $10,000 to $12,499 | 58 (2.3%) | 67 (3.0%) |
| $12,500 to $14,999 | 17 (0.7%) | 42 (1.9%) |
| $15,000 to $17,499 | 187 (7.4%) | 122 (5.4%) |
| $17,500 to $19,999 | 139 (5.5%) | 98 (4.4%) |
| $20,000 to $22,499 | 28 (1.1%) | 147 (6.6%) |
| $22,500 to $24,999 | 111 (4.4%) | 65 (2.9%) |
| $25,000 to $29,999 | 243 (9.6%) | 132 (5.9%) |
| $30,000 to $34,999 | 203 (8.0%) | 247 (11.0%) |
| $35,000 to $39,999 | 70 (2.8%) | 125 (5.6%) |
| $40,000 to $44,999 | 284 (11.2%) | 103 (4.6%) |
| $45,000 to $49,999 | 144 (5.7%) | 175 (7.8%) |
| $50,000 to $54,999 | 160 (6.3%) | 31 (1.4%) |
| $55,000 to $64,999 | 320 (12.7%) | 217 (9.7%) |
| $65,000 to $74,999 | 120 (4.8%) | 102 (4.6%) |
| $75,000 to $99,999 | 212 (8.4%) | 81 (3.6%) |
| $100,000+ | 104 (4.1%) | 51 (2.3%) |
| Total | 2,527 (100.0%) | 2,238 (100.0%) |
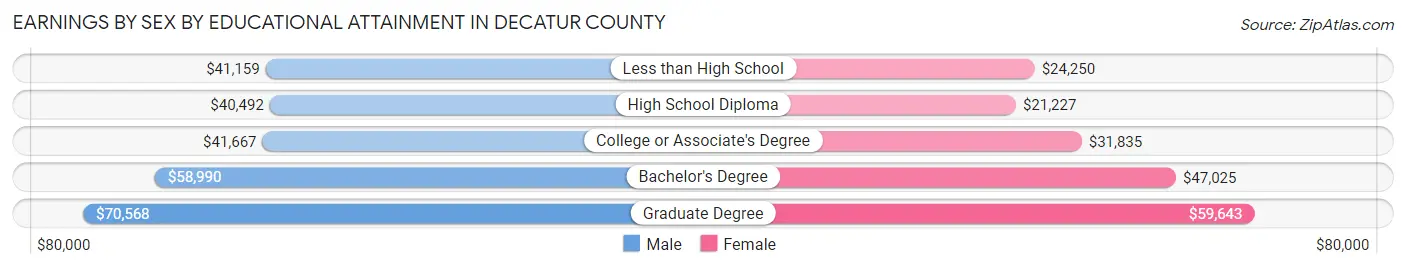
Earnings by Sex by Educational Attainment in Decatur County
Average earnings in Decatur County are $41,930 for men and $31,959 for women, a difference of 23.8%. Men with an educational attainment of graduate degree enjoy the highest average annual earnings of $70,568, while those with high school diploma education earn the least with $40,492. Women with an educational attainment of graduate degree earn the most with the average annual earnings of $59,643, while those with high school diploma education have the smallest earnings of $21,227.
| Educational Attainment | Male Income | Female Income |
| Less than High School | $41,159 | $24,250 |
| High School Diploma | $40,492 | $21,227 |
| College or Associate's Degree | $41,667 | $31,835 |
| Bachelor's Degree | $58,990 | $47,025 |
| Graduate Degree | $70,568 | $59,643 |
| Total | $41,930 | $31,959 |
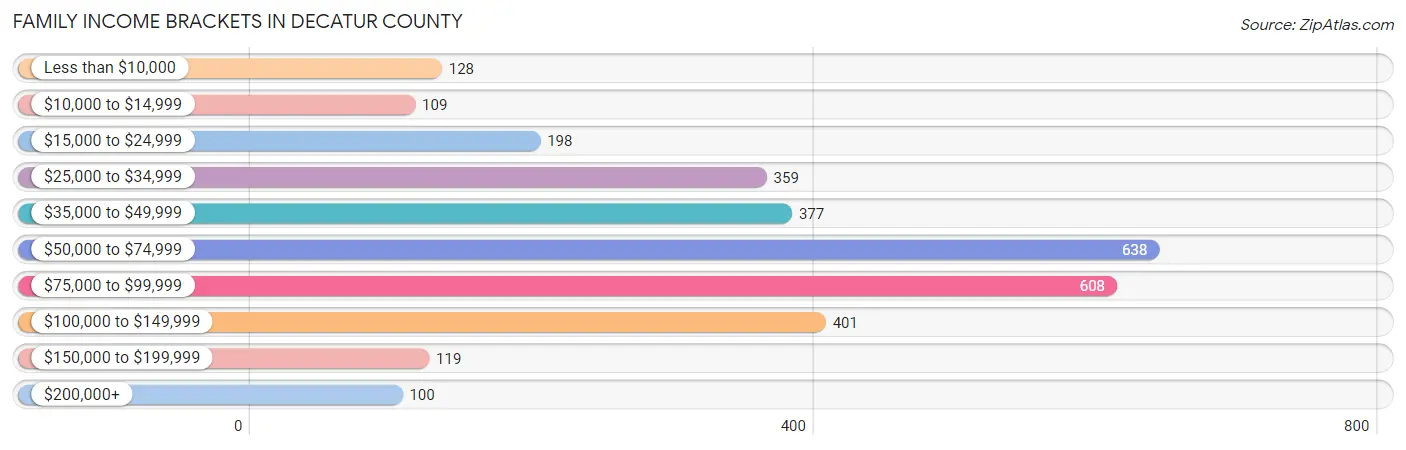
Family Income in Decatur County
Family Income Brackets in Decatur County
According to the Decatur County family income data, there are 638 families falling into the $50,000 to $74,999 income range, which is the most common income bracket and makes up 21.0% of all families. Conversely, the $200,000+ income bracket is the least frequent group with only 100 families (3.3%) belonging to this category.
| Income Bracket | # Families | % Families |
| Less than $10,000 | 128 | 4.2% |
| $10,000 to $14,999 | 109 | 3.6% |
| $15,000 to $24,999 | 198 | 6.5% |
| $25,000 to $34,999 | 359 | 11.8% |
| $35,000 to $49,999 | 377 | 12.4% |
| $50,000 to $74,999 | 638 | 21.0% |
| $75,000 to $99,999 | 608 | 20.0% |
| $100,000 to $149,999 | 401 | 13.2% |
| $150,000 to $199,999 | 119 | 3.9% |
| $200,000+ | 100 | 3.3% |
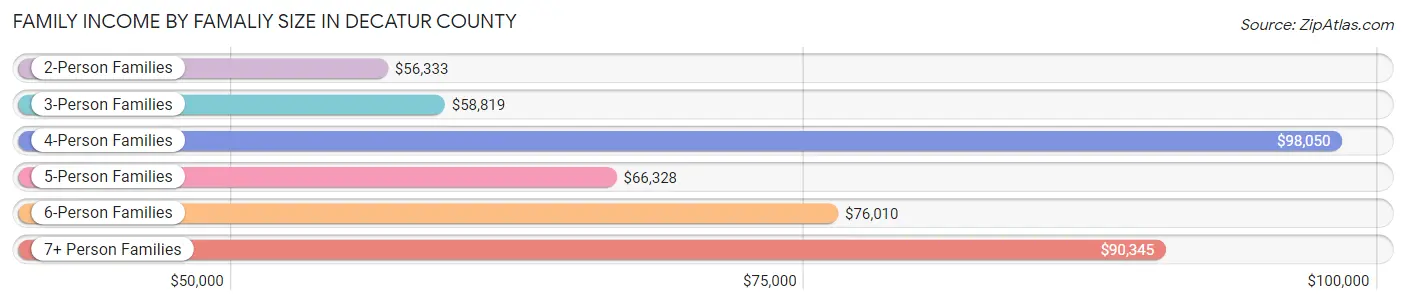
Family Income by Famaliy Size in Decatur County
4-person families (435 | 14.3%) account for the highest median family income in Decatur County with $98,050 per family, while 2-person families (1,800 | 59.2%) have the highest median income of $28,166 per family member.
| Income Bracket | # Families | Median Income |
| 2-Person Families | 1,800 (59.2%) | $56,333 |
| 3-Person Families | 325 (10.7%) | $58,819 |
| 4-Person Families | 435 (14.3%) | $98,050 |
| 5-Person Families | 189 (6.2%) | $66,328 |
| 6-Person Families | 216 (7.1%) | $76,010 |
| 7+ Person Families | 74 (2.4%) | $90,345 |
| Total | 3,039 (100.0%) | $63,795 |
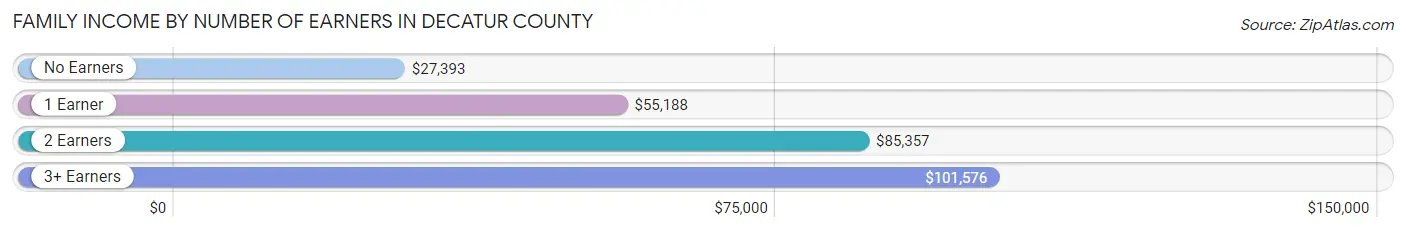
Family Income by Number of Earners in Decatur County
The median family income in Decatur County is $63,795, with families comprising 3+ earners (155) having the highest median family income of $101,576, while families with no earners (805) have the lowest median family income of $27,393, accounting for 5.1% and 26.5% of families, respectively.
| Number of Earners | # Families | Median Income |
| No Earners | 805 (26.5%) | $27,393 |
| 1 Earner | 975 (32.1%) | $55,188 |
| 2 Earners | 1,104 (36.3%) | $85,357 |
| 3+ Earners | 155 (5.1%) | $101,576 |
| Total | 3,039 (100.0%) | $63,795 |
Household Income in Decatur County
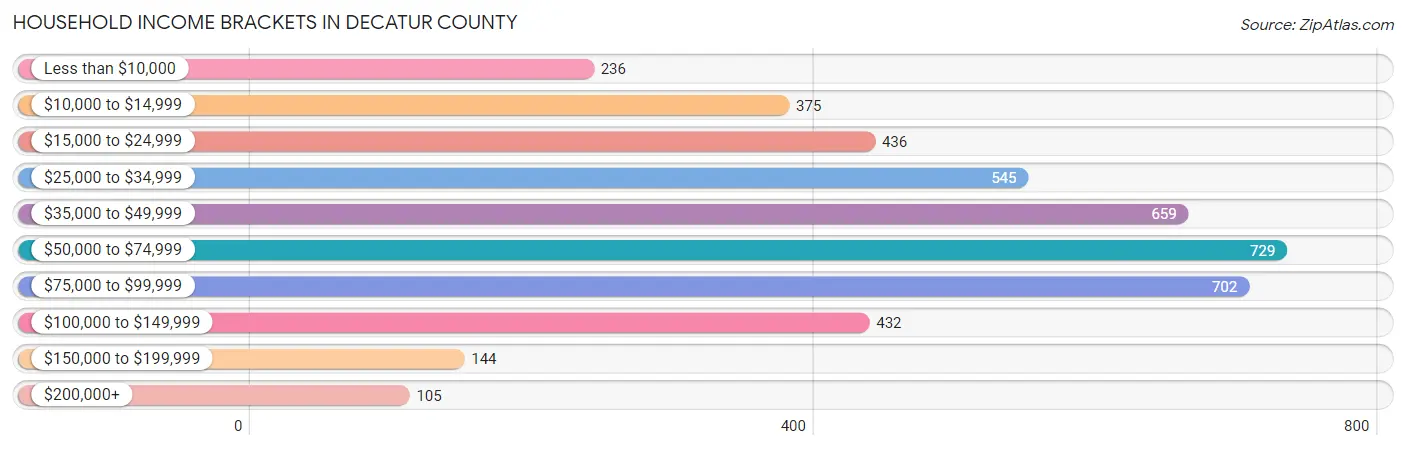
Household Income Brackets in Decatur County
With 729 households falling in the category, the $50,000 to $74,999 income range is the most frequent in Decatur County, accounting for 16.7% of all households. In contrast, only 105 households (2.4%) fall into the $200,000+ income bracket, making it the least populous group.
| Income Bracket | # Households | % Households |
| Less than $10,000 | 236 | 5.4% |
| $10,000 to $14,999 | 375 | 8.6% |
| $15,000 to $24,999 | 436 | 10.0% |
| $25,000 to $34,999 | 545 | 12.5% |
| $35,000 to $49,999 | 659 | 15.1% |
| $50,000 to $74,999 | 729 | 16.7% |
| $75,000 to $99,999 | 702 | 16.1% |
| $100,000 to $149,999 | 432 | 9.9% |
| $150,000 to $199,999 | 144 | 3.3% |
| $200,000+ | 105 | 2.4% |
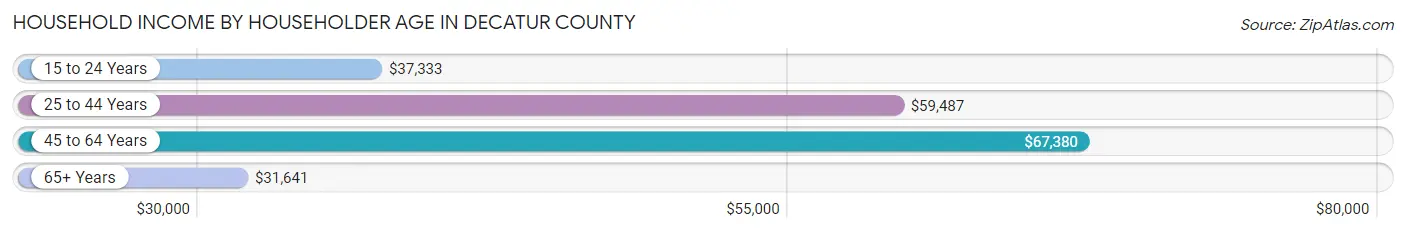
Household Income by Householder Age in Decatur County
The median household income in Decatur County is $48,466, with the highest median household income of $67,380 found in the 45 to 64 years age bracket for the primary householder. A total of 1,671 households (38.3%) fall into this category. Meanwhile, the 65+ years age bracket for the primary householder has the lowest median household income of $31,641, with 1,722 households (39.5%) in this group.
| Income Bracket | # Households | Median Income |
| 15 to 24 Years | 108 (2.5%) | $37,333 |
| 25 to 44 Years | 862 (19.8%) | $59,487 |
| 45 to 64 Years | 1,671 (38.3%) | $67,380 |
| 65+ Years | 1,722 (39.5%) | $31,641 |
| Total | 4,363 (100.0%) | $48,466 |
Poverty in Decatur County
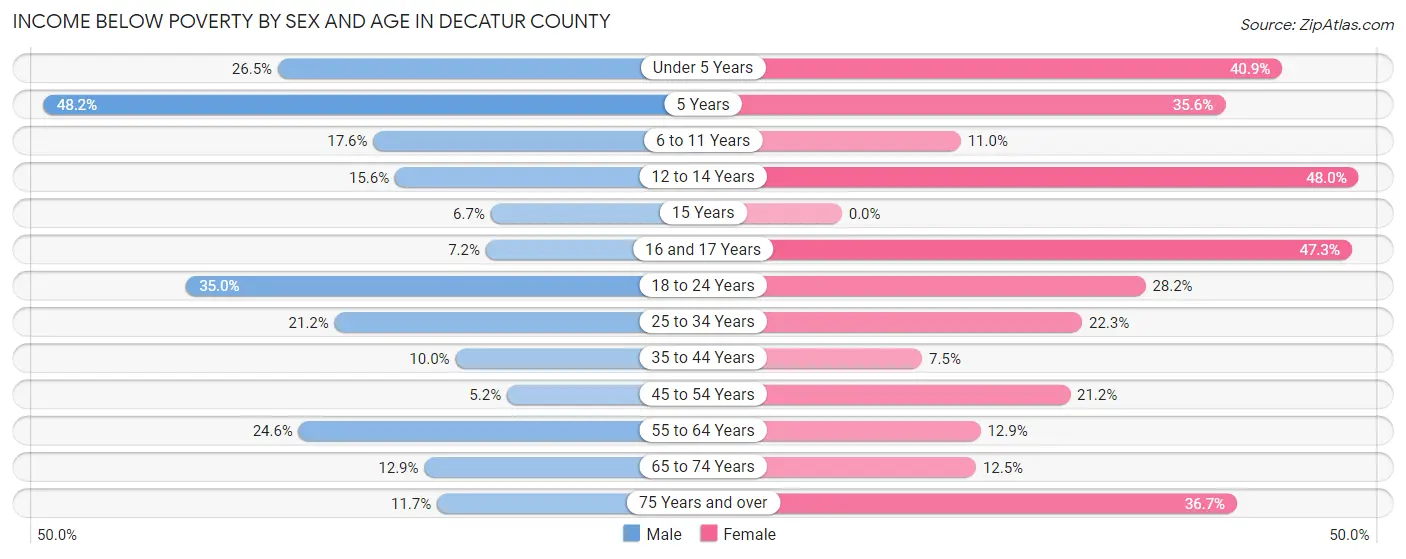
Income Below Poverty by Sex and Age in Decatur County
With 17.1% poverty level for males and 21.3% for females among the residents of Decatur County, 5 year old males and 12 to 14 year old females are the most vulnerable to poverty, with 27 males (48.2%) and 105 females (47.9%) in their respective age groups living below the poverty level.
| Age Bracket | Male | Female |
| Under 5 Years | 80 (26.5%) | 103 (40.9%) |
| 5 Years | 27 (48.2%) | 16 (35.6%) |
| 6 to 11 Years | 76 (17.6%) | 37 (11.0%) |
| 12 to 14 Years | 40 (15.6%) | 105 (47.9%) |
| 15 Years | 6 (6.7%) | 0 (0.0%) |
| 16 and 17 Years | 9 (7.2%) | 71 (47.3%) |
| 18 to 24 Years | 154 (35.0%) | 113 (28.2%) |
| 25 to 34 Years | 124 (21.2%) | 124 (22.3%) |
| 35 to 44 Years | 62 (10.0%) | 51 (7.5%) |
| 45 to 54 Years | 37 (5.2%) | 154 (21.2%) |
| 55 to 64 Years | 195 (24.6%) | 110 (12.9%) |
| 65 to 74 Years | 96 (12.9%) | 96 (12.4%) |
| 75 Years and over | 51 (11.7%) | 231 (36.7%) |
| Total | 957 (17.1%) | 1,211 (21.3%) |
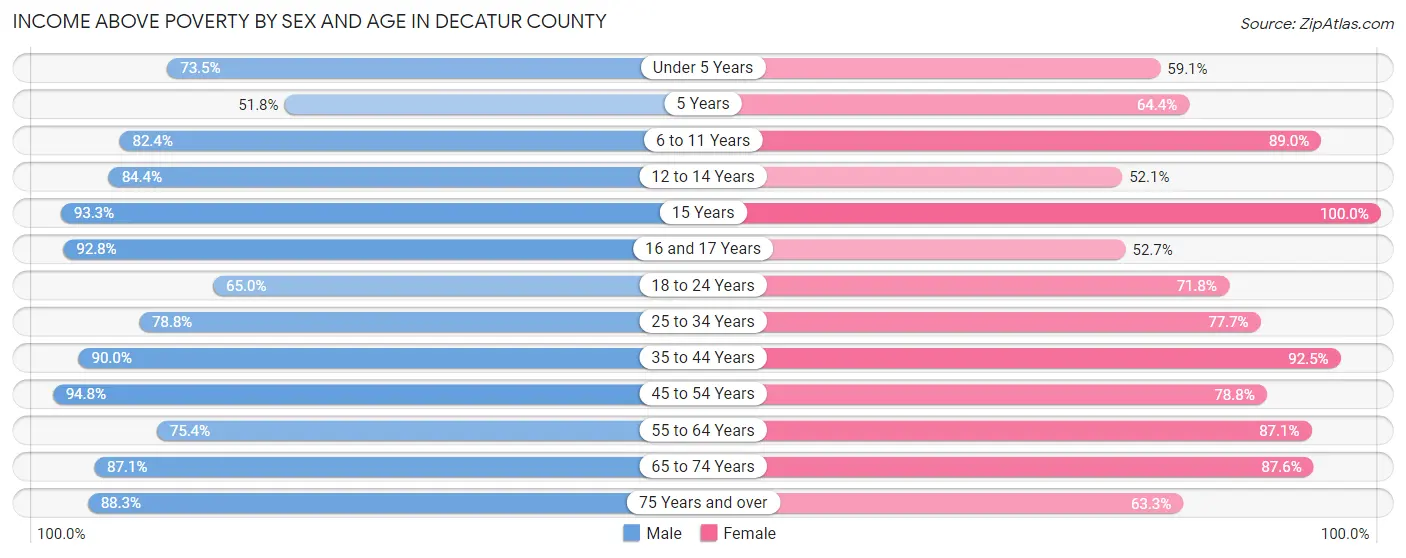
Income Above Poverty by Sex and Age in Decatur County
According to the poverty statistics in Decatur County, males aged 45 to 54 years and females aged 15 years are the age groups that are most secure financially, with 94.8% of males and 100.0% of females in these age groups living above the poverty line.
| Age Bracket | Male | Female |
| Under 5 Years | 222 (73.5%) | 149 (59.1%) |
| 5 Years | 29 (51.8%) | 29 (64.4%) |
| 6 to 11 Years | 355 (82.4%) | 298 (89.0%) |
| 12 to 14 Years | 216 (84.4%) | 114 (52.0%) |
| 15 Years | 83 (93.3%) | 60 (100.0%) |
| 16 and 17 Years | 116 (92.8%) | 79 (52.7%) |
| 18 to 24 Years | 286 (65.0%) | 288 (71.8%) |
| 25 to 34 Years | 460 (78.8%) | 432 (77.7%) |
| 35 to 44 Years | 557 (90.0%) | 633 (92.5%) |
| 45 to 54 Years | 670 (94.8%) | 573 (78.8%) |
| 55 to 64 Years | 599 (75.4%) | 745 (87.1%) |
| 65 to 74 Years | 648 (87.1%) | 675 (87.5%) |
| 75 Years and over | 384 (88.3%) | 399 (63.3%) |
| Total | 4,625 (82.9%) | 4,474 (78.7%) |
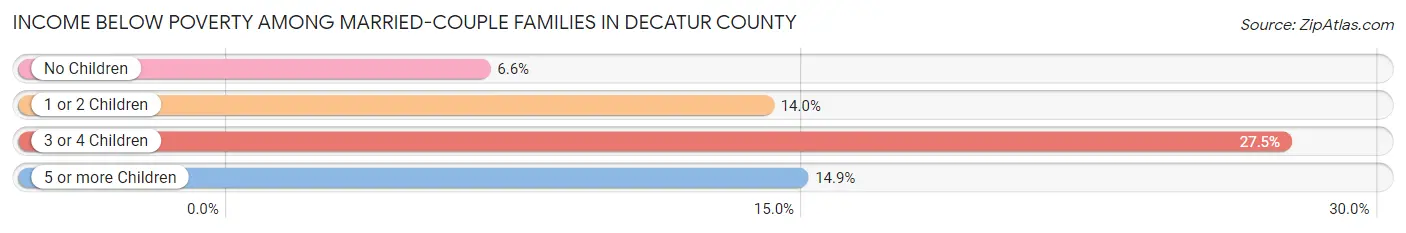
Income Below Poverty Among Married-Couple Families in Decatur County
The poverty statistics for married-couple families in Decatur County show that 10.9% or 272 of the total 2,493 families live below the poverty line. Families with 3 or 4 children have the highest poverty rate of 27.5%, comprising of 90 families. On the other hand, families with no children have the lowest poverty rate of 6.6%, which includes 108 families.
| Children | Above Poverty | Below Poverty |
| No Children | 1,532 (93.4%) | 108 (6.6%) |
| 1 or 2 Children | 412 (86.0%) | 67 (14.0%) |
| 3 or 4 Children | 237 (72.5%) | 90 (27.5%) |
| 5 or more Children | 40 (85.1%) | 7 (14.9%) |
| Total | 2,221 (89.1%) | 272 (10.9%) |
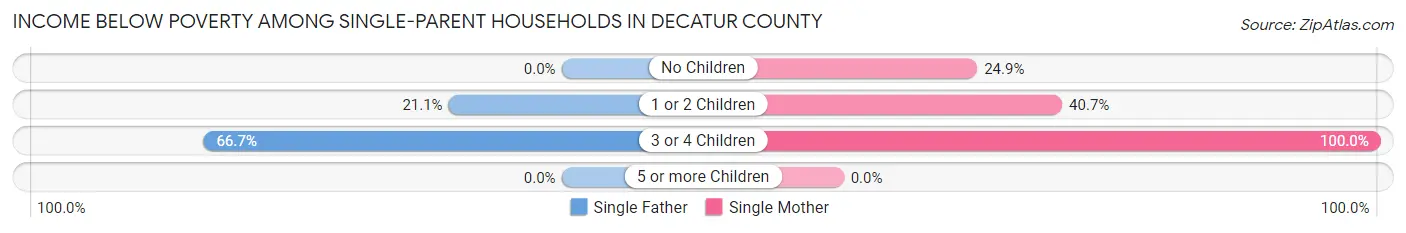
Income Below Poverty Among Single-Parent Households in Decatur County
According to the poverty data in Decatur County, 17.1% or 24 single-father households and 33.0% or 134 single-mother households are living below the poverty line. Among single-father households, those with 3 or 4 children have the highest poverty rate, with 8 households (66.7%) experiencing poverty. Likewise, among single-mother households, those with 3 or 4 children have the highest poverty rate, with 2 households (100.0%) falling below the poverty line.
| Children | Single Father | Single Mother |
| No Children | 0 (0.0%) | 51 (24.9%) |
| 1 or 2 Children | 16 (21.0%) | 81 (40.7%) |
| 3 or 4 Children | 8 (66.7%) | 2 (100.0%) |
| 5 or more Children | 0 (0.0%) | 0 (0.0%) |
| Total | 24 (17.1%) | 134 (33.0%) |
Income Below Poverty Among Married-Couple vs Single-Parent Households in Decatur County
The poverty data for Decatur County shows that 272 of the married-couple family households (10.9%) and 158 of the single-parent households (28.9%) are living below the poverty level. Within the married-couple family households, those with 3 or 4 children have the highest poverty rate, with 90 households (27.5%) falling below the poverty line. Among the single-parent households, those with 3 or 4 children have the highest poverty rate, with 10 household (71.4%) living below poverty.
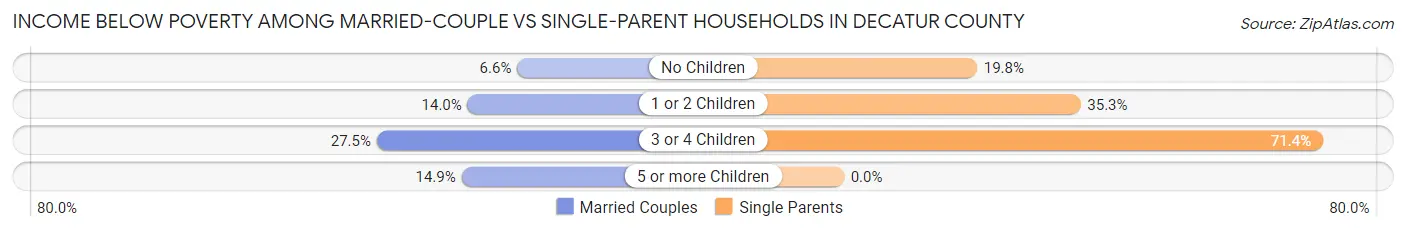
| Children | Married-Couple Families | Single-Parent Households |
| No Children | 108 (6.6%) | 51 (19.8%) |
| 1 or 2 Children | 67 (14.0%) | 97 (35.3%) |
| 3 or 4 Children | 90 (27.5%) | 10 (71.4%) |
| 5 or more Children | 7 (14.9%) | 0 (0.0%) |
| Total | 272 (10.9%) | 158 (28.9%) |
Race in Decatur County
The most populous races in Decatur County are White / Caucasian (10,560 | 92.0%), Two or more Races (585 | 5.1%), and Hispanic or Latino (408 | 3.5%).
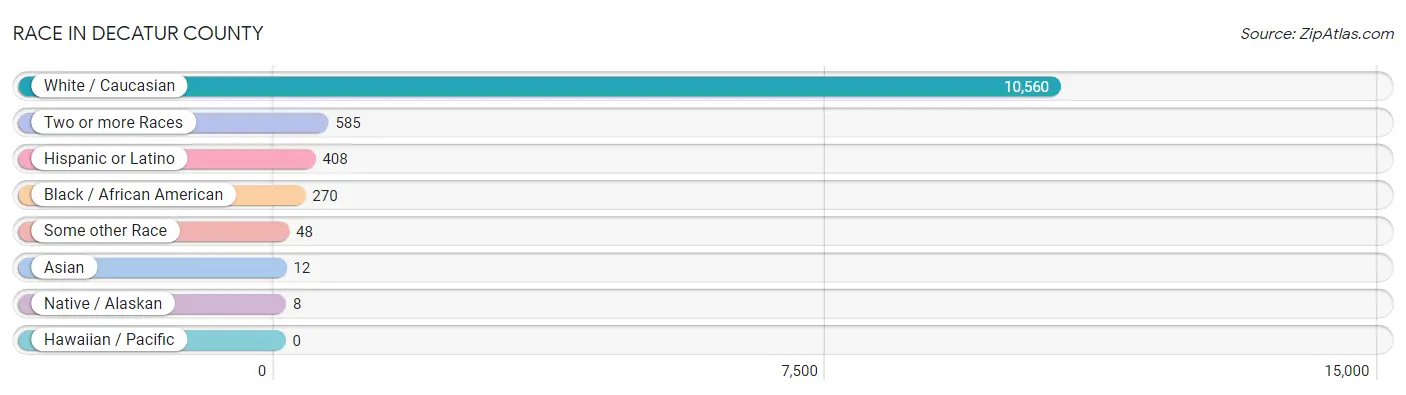
| Race | # Population | % Population |
| Asian | 12 | 0.1% |
| Black / African American | 270 | 2.4% |
| Hawaiian / Pacific | 0 | 0.0% |
| Hispanic or Latino | 408 | 3.5% |
| Native / Alaskan | 8 | 0.1% |
| White / Caucasian | 10,560 | 92.0% |
| Two or more Races | 585 | 5.1% |
| Some other Race | 48 | 0.4% |
| Total | 11,483 | 100.0% |
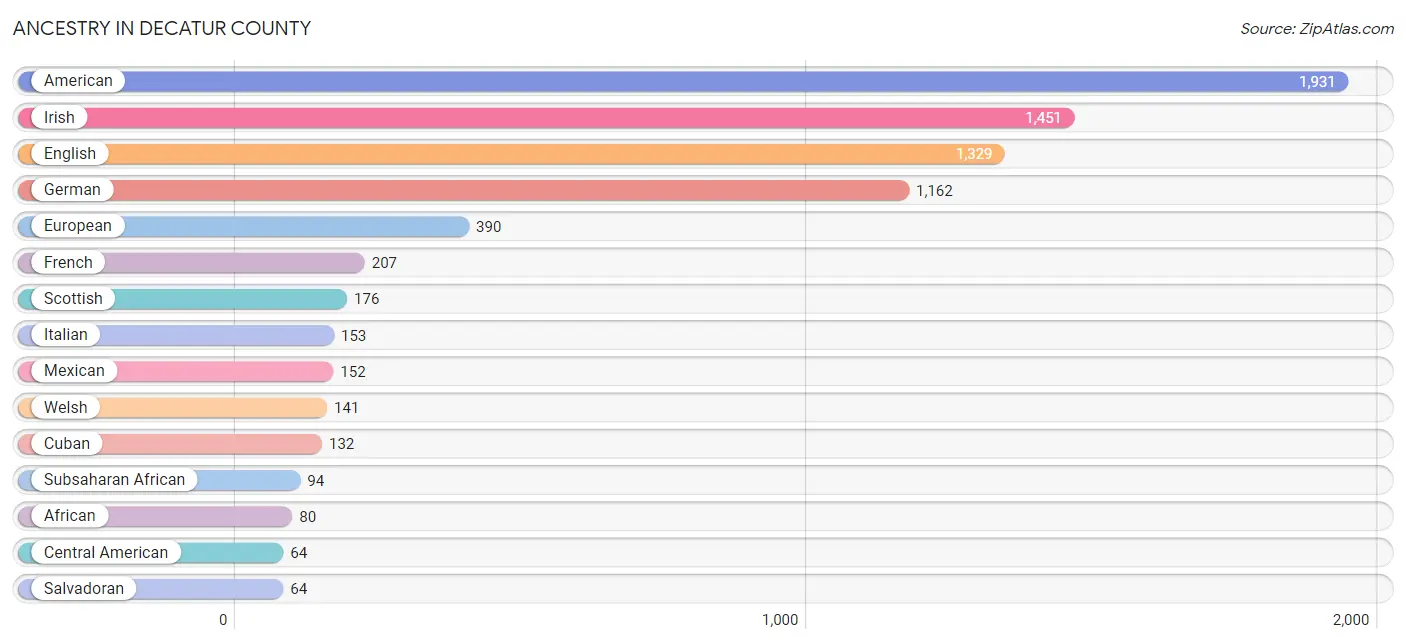
Ancestry in Decatur County
The most populous ancestries reported in Decatur County are American (1,931 | 16.8%), Irish (1,451 | 12.6%), English (1,329 | 11.6%), German (1,162 | 10.1%), and European (390 | 3.4%), together accounting for 54.5% of all Decatur County residents.
| Ancestry | # Population | % Population |
| African | 80 | 0.7% |
| American | 1,931 | 16.8% |
| British | 38 | 0.3% |
| Burmese | 6 | 0.1% |
| Celtic | 6 | 0.1% |
| Central American | 64 | 0.6% |
| Cherokee | 55 | 0.5% |
| Cuban | 132 | 1.1% |
| Czech | 4 | 0.0% |
| Czechoslovakian | 7 | 0.1% |
| Danish | 18 | 0.2% |
| Dutch | 62 | 0.5% |
| Eastern European | 33 | 0.3% |
| English | 1,329 | 11.6% |
| European | 390 | 3.4% |
| French | 207 | 1.8% |
| French Canadian | 4 | 0.0% |
| German | 1,162 | 10.1% |
| Irish | 1,451 | 12.6% |
| Italian | 153 | 1.3% |
| Korean | 6 | 0.1% |
| Lithuanian | 8 | 0.1% |
| Mexican | 152 | 1.3% |
| Nigerian | 14 | 0.1% |
| Northern European | 13 | 0.1% |
| Norwegian | 39 | 0.3% |
| Polish | 54 | 0.5% |
| Puerto Rican | 42 | 0.4% |
| Russian | 10 | 0.1% |
| Salvadoran | 64 | 0.6% |
| Scandinavian | 2 | 0.0% |
| Scotch-Irish | 30 | 0.3% |
| Scottish | 176 | 1.5% |
| Subsaharan African | 94 | 0.8% |
| Swedish | 12 | 0.1% |
| Welsh | 141 | 1.2% | View All 36 Rows |
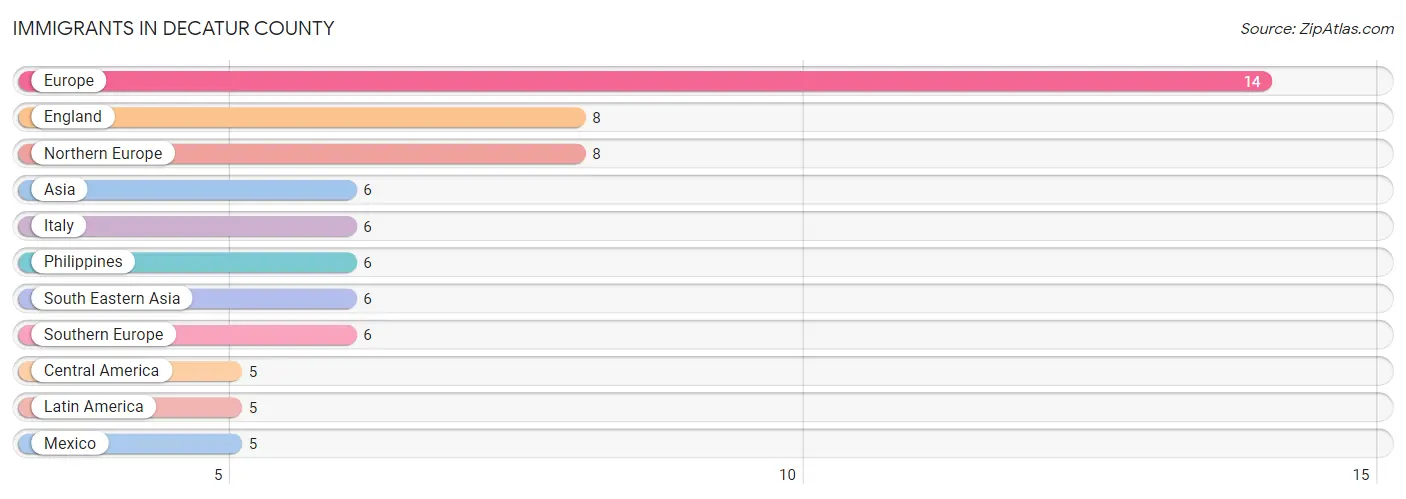
Immigrants in Decatur County
The most numerous immigrant groups reported in Decatur County came from Europe (14 | 0.1%), England (8 | 0.1%), Northern Europe (8 | 0.1%), Asia (6 | 0.1%), and Italy (6 | 0.1%), together accounting for 0.4% of all Decatur County residents.
| Immigration Origin | # Population | % Population |
| Asia | 6 | 0.1% |
| Central America | 5 | 0.0% |
| England | 8 | 0.1% |
| Europe | 14 | 0.1% |
| Italy | 6 | 0.1% |
| Latin America | 5 | 0.0% |
| Mexico | 5 | 0.0% |
| Northern Europe | 8 | 0.1% |
| Philippines | 6 | 0.1% |
| South Eastern Asia | 6 | 0.1% |
| Southern Europe | 6 | 0.1% | View All 11 Rows |
Sex and Age in Decatur County
Sex and Age in Decatur County
The most populous age groups in Decatur County are 55 to 59 Years (445 | 7.9%) for men and 55 to 59 Years (519 | 8.9%) for women.
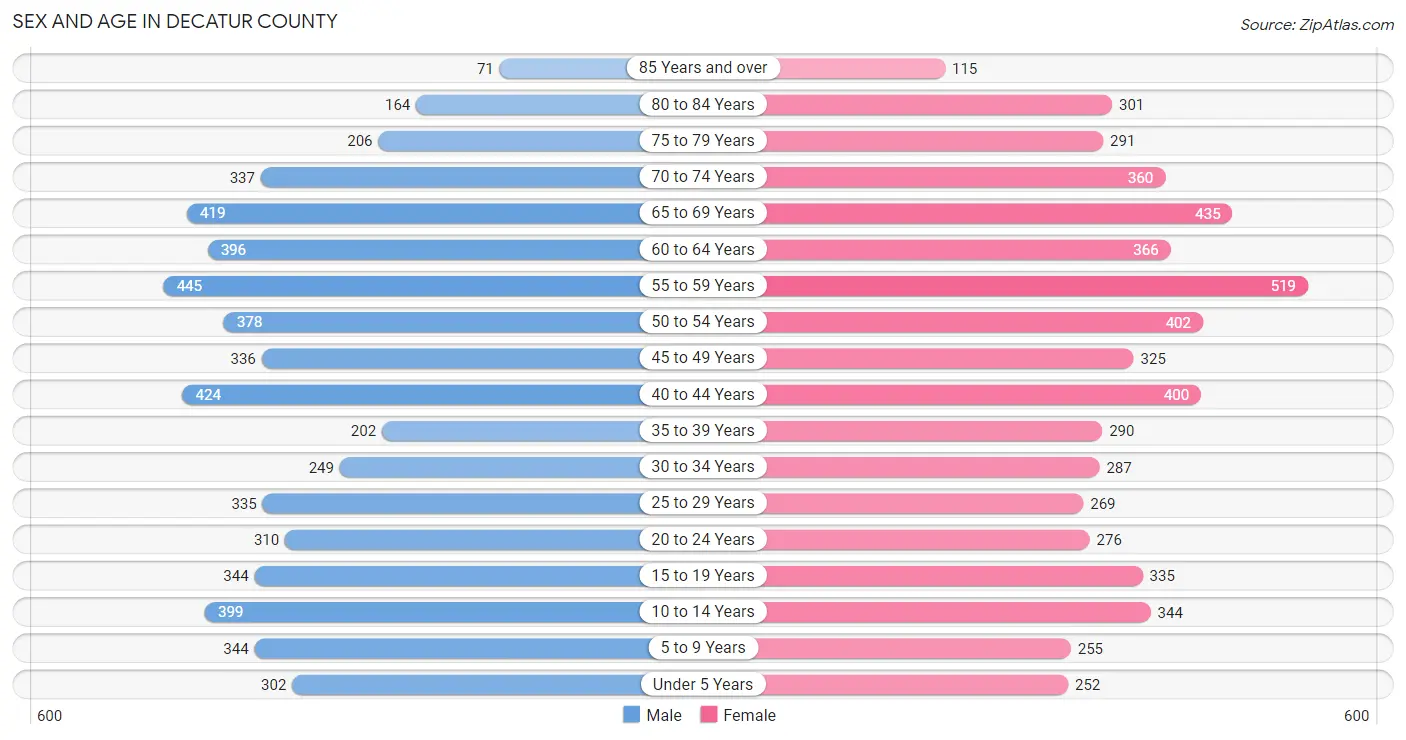
| Age Bracket | Male | Female |
| Under 5 Years | 302 (5.3%) | 252 (4.3%) |
| 5 to 9 Years | 344 (6.1%) | 255 (4.4%) |
| 10 to 14 Years | 399 (7.0%) | 344 (5.9%) |
| 15 to 19 Years | 344 (6.1%) | 335 (5.8%) |
| 20 to 24 Years | 310 (5.5%) | 276 (4.7%) |
| 25 to 29 Years | 335 (5.9%) | 269 (4.6%) |
| 30 to 34 Years | 249 (4.4%) | 287 (4.9%) |
| 35 to 39 Years | 202 (3.6%) | 290 (5.0%) |
| 40 to 44 Years | 424 (7.5%) | 400 (6.9%) |
| 45 to 49 Years | 336 (5.9%) | 325 (5.6%) |
| 50 to 54 Years | 378 (6.7%) | 402 (6.9%) |
| 55 to 59 Years | 445 (7.9%) | 519 (8.9%) |
| 60 to 64 Years | 396 (7.0%) | 366 (6.3%) |
| 65 to 69 Years | 419 (7.4%) | 435 (7.5%) |
| 70 to 74 Years | 337 (5.9%) | 360 (6.2%) |
| 75 to 79 Years | 206 (3.6%) | 291 (5.0%) |
| 80 to 84 Years | 164 (2.9%) | 301 (5.2%) |
| 85 Years and over | 71 (1.3%) | 115 (2.0%) |
| Total | 5,661 (100.0%) | 5,822 (100.0%) |
Families and Households in Decatur County
Median Family Size in Decatur County
The median family size in Decatur County is 3.12 persons per family, with married-couple families (2,493 | 82.0%) accounting for the largest median family size of 3.22 persons per family. On the other hand, single male/father families (140 | 4.6%) represent the smallest median family size with 2.54 persons per family.
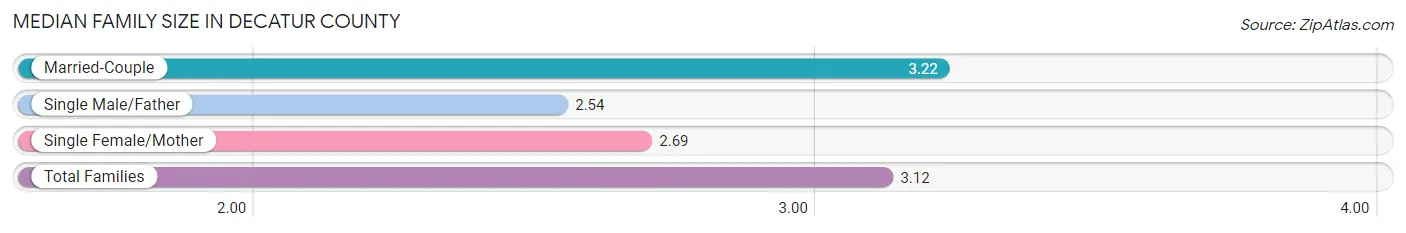
| Family Type | # Families | Family Size |
| Married-Couple | 2,493 (82.0%) | 3.22 |
| Single Male/Father | 140 (4.6%) | 2.54 |
| Single Female/Mother | 406 (13.4%) | 2.69 |
| Total Families | 3,039 (100.0%) | 3.12 |
Median Household Size in Decatur County
The median household size in Decatur County is 2.58 persons per household, with married-couple households (2,493 | 57.1%) accounting for the largest median household size of 3.25 persons per household. non-family households (1,324 | 30.3%) represent the smallest median household size with 1.19 persons per household.
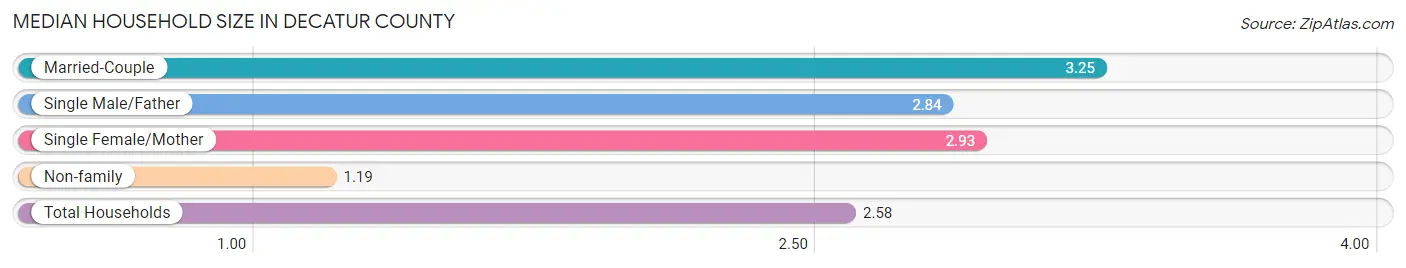
| Household Type | # Households | Household Size |
| Married-Couple | 2,493 (57.1%) | 3.25 |
| Single Male/Father | 140 (3.2%) | 2.84 |
| Single Female/Mother | 406 (9.3%) | 2.93 |
| Non-family | 1,324 (30.3%) | 1.19 |
| Total Households | 4,363 (100.0%) | 2.58 |
Household Size by Marriage Status in Decatur County
Out of a total of 4,363 households in Decatur County, 3,039 (69.7%) are family households, while 1,324 (30.3%) are nonfamily households. The most numerous type of family households are 2-person households, comprising 1,704, and the most common type of nonfamily households are 1-person households, comprising 1,166.
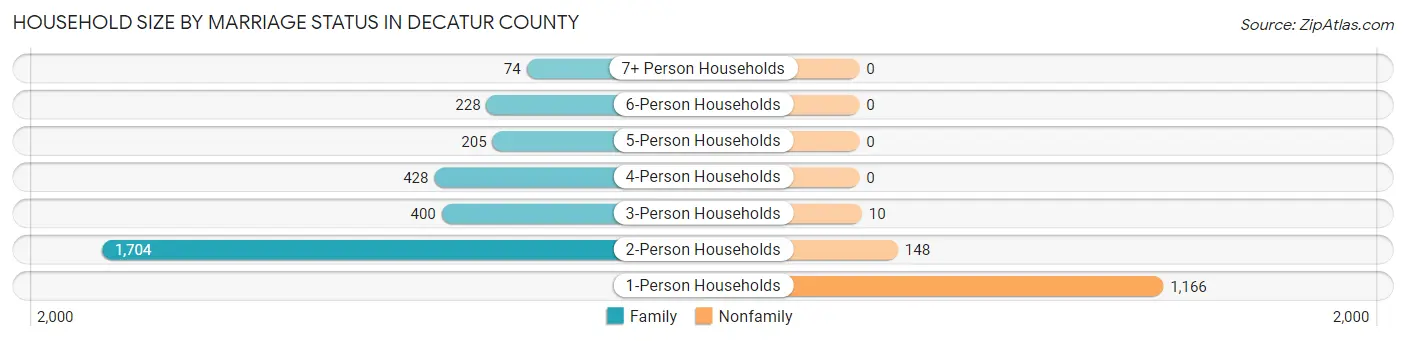
| Household Size | Family Households | Nonfamily Households |
| 1-Person Households | - | 1,166 (26.7%) |
| 2-Person Households | 1,704 (39.1%) | 148 (3.4%) |
| 3-Person Households | 400 (9.2%) | 10 (0.2%) |
| 4-Person Households | 428 (9.8%) | 0 (0.0%) |
| 5-Person Households | 205 (4.7%) | 0 (0.0%) |
| 6-Person Households | 228 (5.2%) | 0 (0.0%) |
| 7+ Person Households | 74 (1.7%) | 0 (0.0%) |
| Total | 3,039 (69.7%) | 1,324 (30.3%) |
Female Fertility in Decatur County
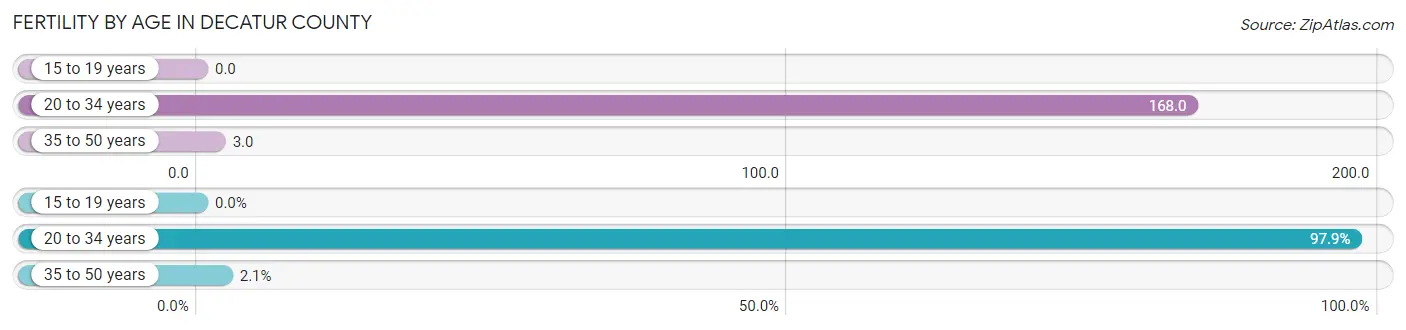
Fertility by Age in Decatur County
Average fertility rate in Decatur County is 64.0 births per 1,000 women. Women in the age bracket of 20 to 34 years have the highest fertility rate with 168.0 births per 1,000 women. Women in the age bracket of 20 to 34 years acount for 97.9% of all women with births.
| Age Bracket | Women with Births | Births / 1,000 Women |
| 15 to 19 years | 0 (0.0%) | 0.0 |
| 20 to 34 years | 140 (97.9%) | 168.0 |
| 35 to 50 years | 3 (2.1%) | 3.0 |
| Total | 143 (100.0%) | 64.0 |
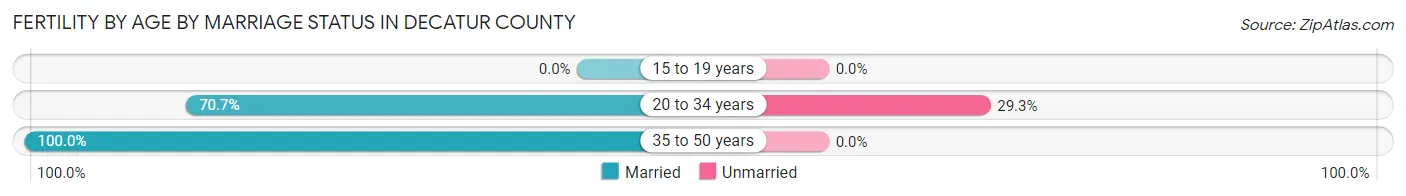
Fertility by Age by Marriage Status in Decatur County
71.3% of women with births (143) in Decatur County are married. The highest percentage of unmarried women with births falls into 20 to 34 years age bracket with 29.3% of them unmarried at the time of birth, while the lowest percentage of unmarried women with births belong to 35 to 50 years age bracket with 0.0% of them unmarried.
| Age Bracket | Married | Unmarried |
| 15 to 19 years | 0 (0.0%) | 0 (0.0%) |
| 20 to 34 years | 99 (70.7%) | 41 (29.3%) |
| 35 to 50 years | 3 (100.0%) | 0 (0.0%) |
| Total | 102 (71.3%) | 41 (28.7%) |
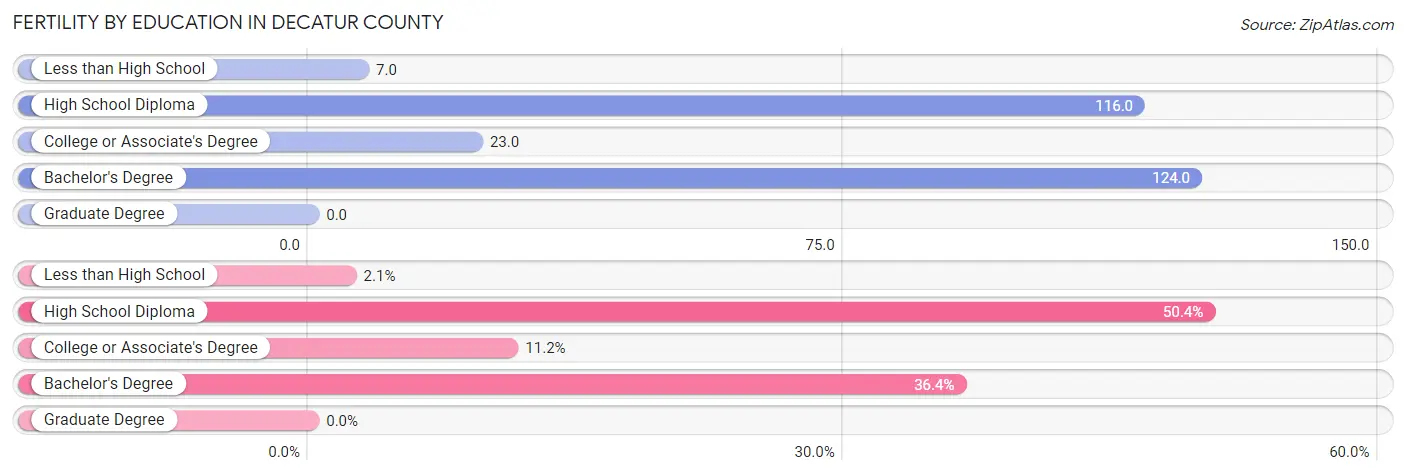
Fertility by Education in Decatur County
| Educational Attainment | Women with Births | Births / 1,000 Women |
| Less than High School | 3 (2.1%) | 7.0 |
| High School Diploma | 72 (50.3%) | 116.0 |
| College or Associate's Degree | 16 (11.2%) | 23.0 |
| Bachelor's Degree | 52 (36.4%) | 124.0 |
| Graduate Degree | 0 (0.0%) | 0.0 |
| Total | 143 (100.0%) | 64.0 |
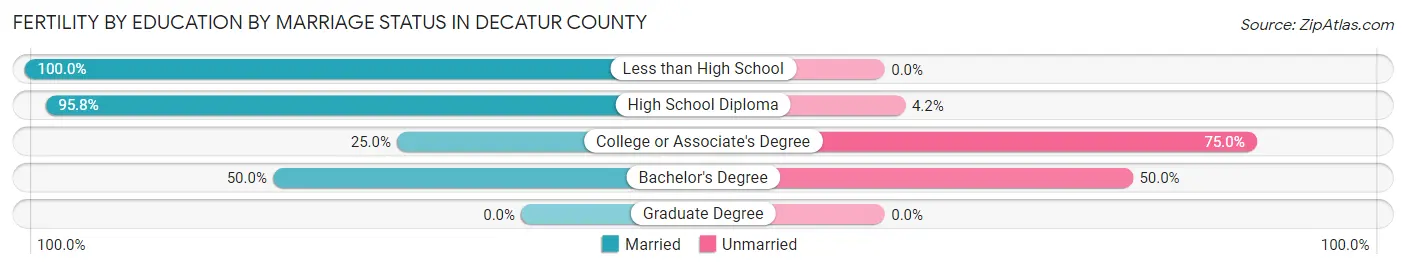
Fertility by Education by Marriage Status in Decatur County
28.7% of women with births in Decatur County are unmarried. Women with the educational attainment of less than high school are most likely to be married with 100.0% of them married at childbirth, while women with the educational attainment of college or associate's degree are least likely to be married with 75.0% of them unmarried at childbirth.
| Educational Attainment | Married | Unmarried |
| Less than High School | 3 (100.0%) | 0 (0.0%) |
| High School Diploma | 69 (95.8%) | 3 (4.2%) |
| College or Associate's Degree | 4 (25.0%) | 12 (75.0%) |
| Bachelor's Degree | 26 (50.0%) | 26 (50.0%) |
| Graduate Degree | 0 (0.0%) | 0 (0.0%) |
| Total | 102 (71.3%) | 41 (28.7%) |
Employment Characteristics in Decatur County
Employment by Class of Employer in Decatur County
Among the 4,370 employed individuals in Decatur County, private company employees (3,193 | 73.1%), local government employees (480 | 11.0%), and self-employed (not incorporated) (389 | 8.9%) make up the most common classes of employment.
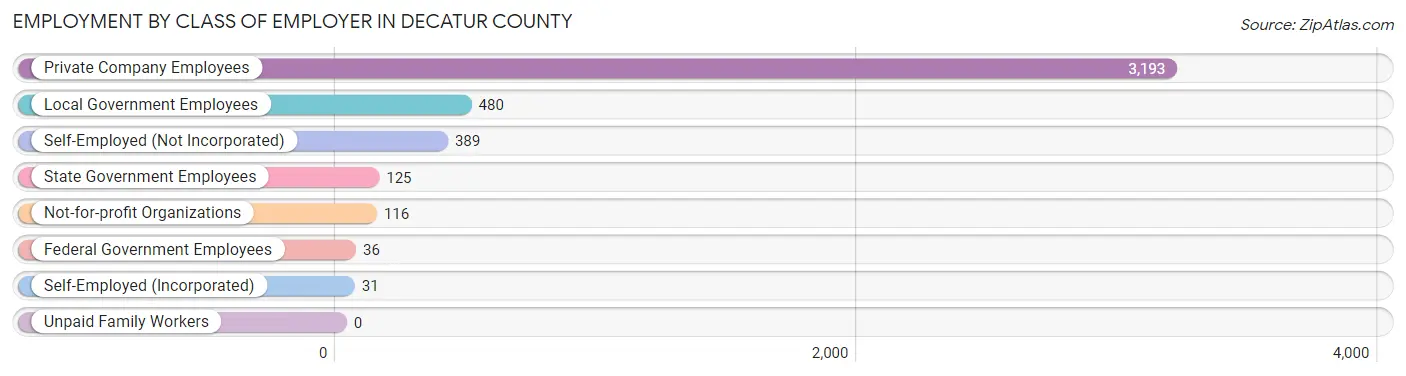
| Employer Class | # Employees | % Employees |
| Private Company Employees | 3,193 | 73.1% |
| Self-Employed (Incorporated) | 31 | 0.7% |
| Self-Employed (Not Incorporated) | 389 | 8.9% |
| Not-for-profit Organizations | 116 | 2.6% |
| Local Government Employees | 480 | 11.0% |
| State Government Employees | 125 | 2.9% |
| Federal Government Employees | 36 | 0.8% |
| Unpaid Family Workers | 0 | 0.0% |
| Total | 4,370 | 100.0% |
Employment Status by Age in Decatur County
According to the labor force statistics for Decatur County, out of the total population over 16 years of age (9,438), 50.8% or 4,795 individuals are in the labor force, with 7.9% or 379 of them unemployed. The age group with the highest labor force participation rate is 25 to 29 years, with 85.1% or 514 individuals in the labor force. Within the labor force, the 20 to 24 years age range has the highest percentage of unemployed individuals, with 35.3% or 148 of them being unemployed.
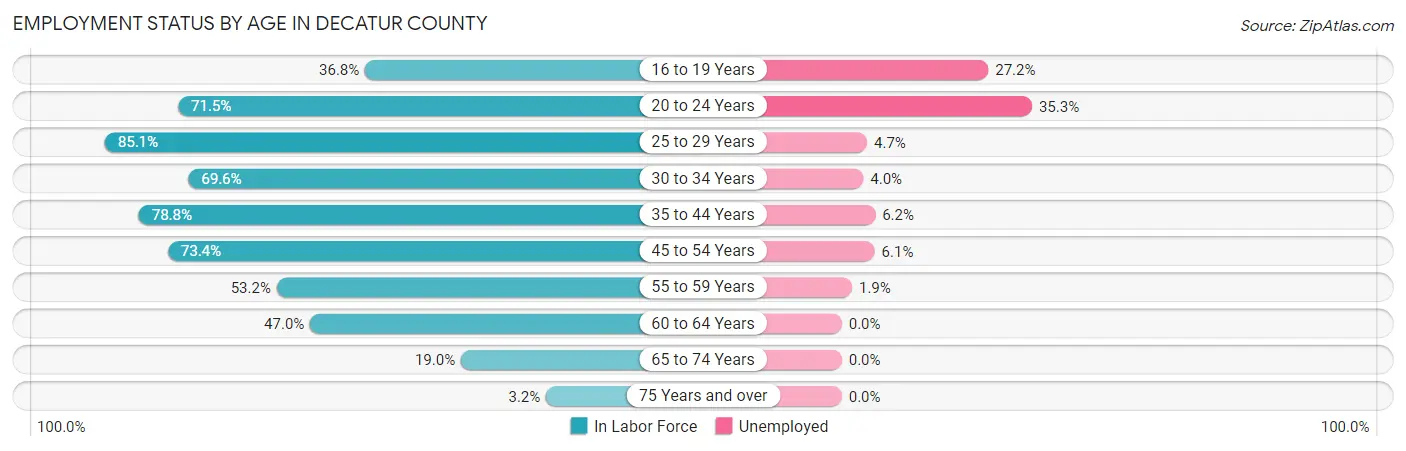
| Age Bracket | In Labor Force | Unemployed |
| 16 to 19 Years | 195 (36.8%) | 53 (27.2%) |
| 20 to 24 Years | 419 (71.5%) | 148 (35.3%) |
| 25 to 29 Years | 514 (85.1%) | 24 (4.7%) |
| 30 to 34 Years | 373 (69.6%) | 15 (4.0%) |
| 35 to 44 Years | 1,037 (78.8%) | 64 (6.2%) |
| 45 to 54 Years | 1,058 (73.4%) | 65 (6.1%) |
| 55 to 59 Years | 513 (53.2%) | 10 (1.9%) |
| 60 to 64 Years | 358 (47.0%) | 0 (0.0%) |
| 65 to 74 Years | 295 (19.0%) | 0 (0.0%) |
| 75 Years and over | 37 (3.2%) | 0 (0.0%) |
| Total | 4,795 (50.8%) | 379 (7.9%) |
Employment Status by Educational Attainment in Decatur County
According to labor force statistics for Decatur County, 68.5% of individuals (3,852) out of the total population between 25 and 64 years of age (5,623) are in the labor force, with 4.6% or 177 of them being unemployed. The group with the highest labor force participation rate are those with the educational attainment of bachelor's degree or higher, with 77.2% or 810 individuals in the labor force. Within the labor force, individuals with less than high school education have the highest percentage of unemployment, with 13.5% or 42 of them being unemployed.
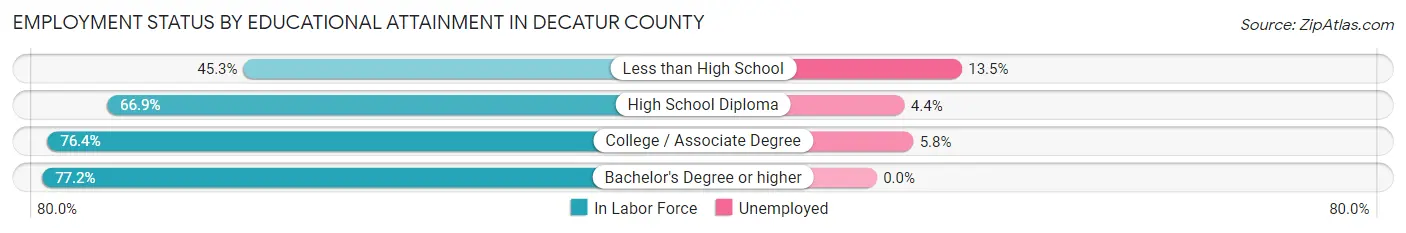
| Educational Attainment | In Labor Force | Unemployed |
| Less than High School | 310 (45.3%) | 92 (13.5%) |
| High School Diploma | 1,688 (66.9%) | 111 (4.4%) |
| College / Associate Degree | 1,044 (76.4%) | 79 (5.8%) |
| Bachelor's Degree or higher | 810 (77.2%) | 0 (0.0%) |
| Total | 3,852 (68.5%) | 259 (4.6%) |
Employment Occupations by Sex in Decatur County
Management, Business, Science and Arts Occupations
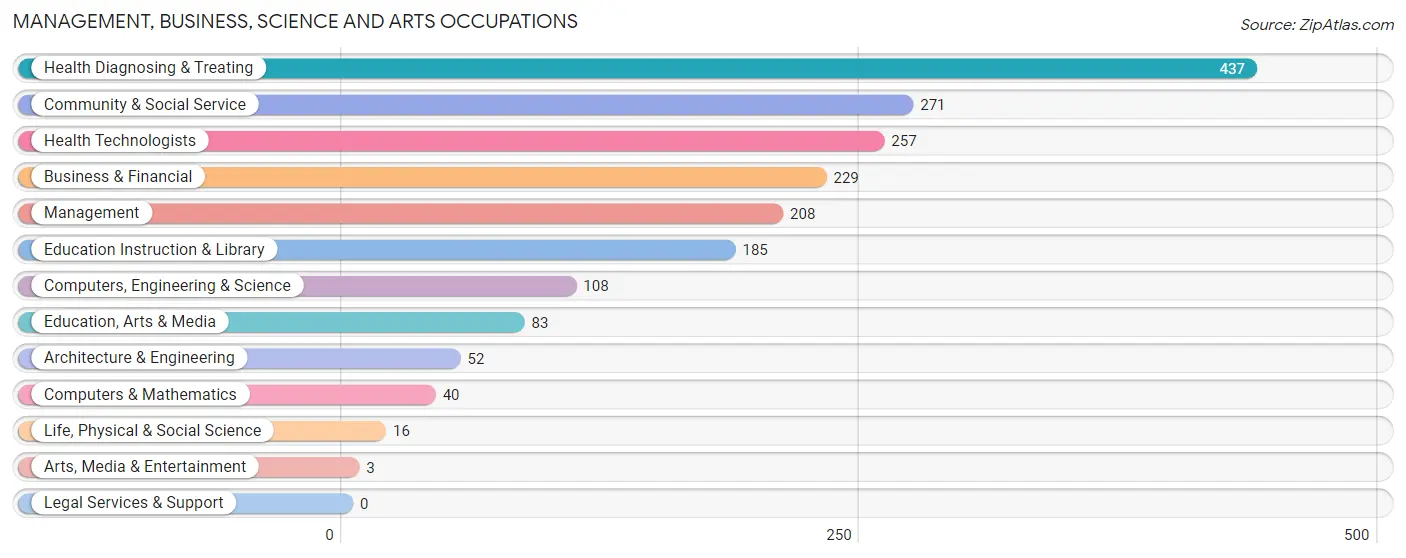
The most common Management, Business, Science and Arts occupations in Decatur County are Health Diagnosing & Treating (437 | 9.9%), Community & Social Service (271 | 6.1%), Health Technologists (257 | 5.8%), Business & Financial (229 | 5.2%), and Management (208 | 4.7%).
Management, Business, Science and Arts Occupations by Sex
Within the Management, Business, Science and Arts occupations in Decatur County, the most male-oriented occupations are Life, Physical & Social Science (87.5%), Architecture & Engineering (73.1%), and Computers, Engineering & Science (68.5%), while the most female-oriented occupations are Arts, Media & Entertainment (100.0%), Health Diagnosing & Treating (93.8%), and Health Technologists (91.0%).
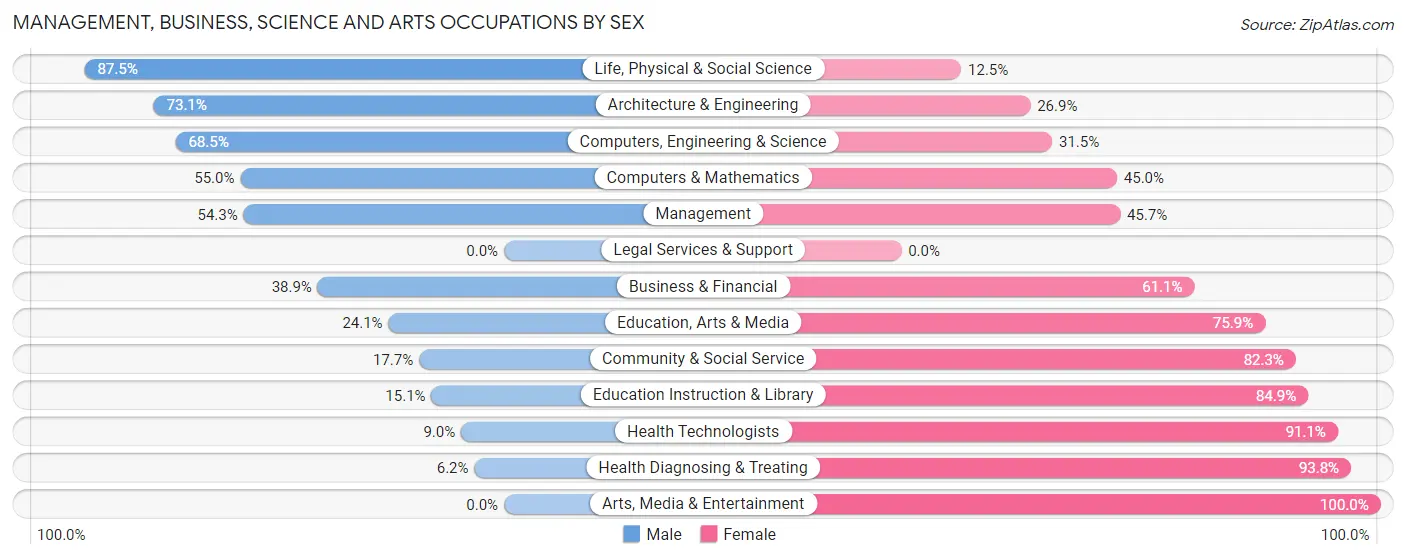
| Occupation | Male | Female |
| Management | 113 (54.3%) | 95 (45.7%) |
| Business & Financial | 89 (38.9%) | 140 (61.1%) |
| Computers, Engineering & Science | 74 (68.5%) | 34 (31.5%) |
| Computers & Mathematics | 22 (55.0%) | 18 (45.0%) |
| Architecture & Engineering | 38 (73.1%) | 14 (26.9%) |
| Life, Physical & Social Science | 14 (87.5%) | 2 (12.5%) |
| Community & Social Service | 48 (17.7%) | 223 (82.3%) |
| Education, Arts & Media | 20 (24.1%) | 63 (75.9%) |
| Legal Services & Support | 0 (0.0%) | 0 (0.0%) |
| Education Instruction & Library | 28 (15.1%) | 157 (84.9%) |
| Arts, Media & Entertainment | 0 (0.0%) | 3 (100.0%) |
| Health Diagnosing & Treating | 27 (6.2%) | 410 (93.8%) |
| Health Technologists | 23 (8.9%) | 234 (91.0%) |
| Total (Category) | 351 (28.0%) | 902 (72.0%) |
| Total (Overall) | 2,273 (51.4%) | 2,146 (48.6%) |
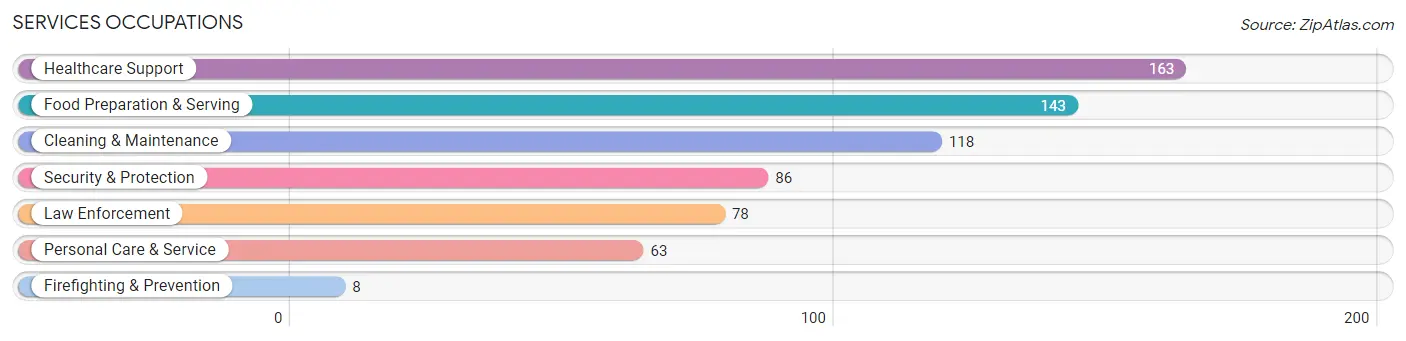
Services Occupations
The most common Services occupations in Decatur County are Healthcare Support (163 | 3.7%), Food Preparation & Serving (143 | 3.2%), Cleaning & Maintenance (118 | 2.7%), Security & Protection (86 | 1.9%), and Law Enforcement (78 | 1.8%).
Services Occupations by Sex
Within the Services occupations in Decatur County, the most male-oriented occupations are Firefighting & Prevention (100.0%), Security & Protection (69.8%), and Law Enforcement (66.7%), while the most female-oriented occupations are Healthcare Support (100.0%), Personal Care & Service (100.0%), and Food Preparation & Serving (56.6%).
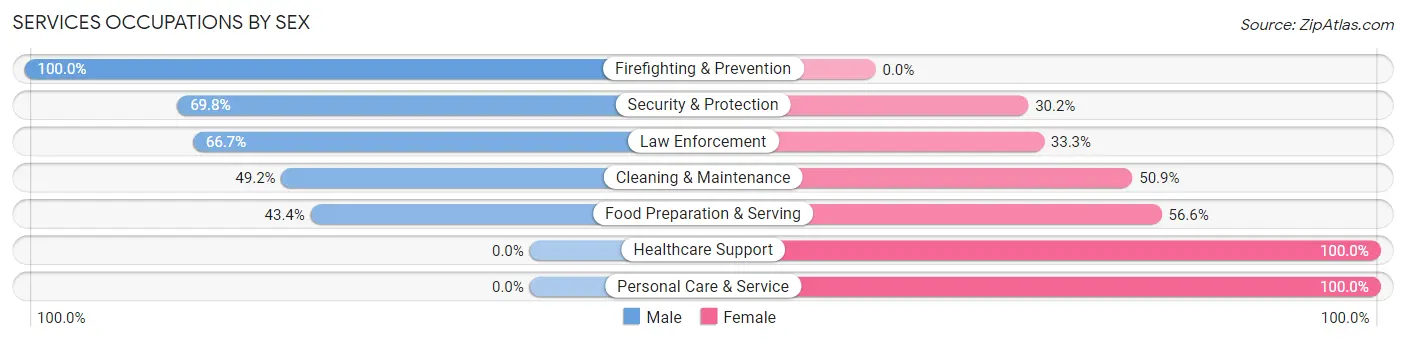
| Occupation | Male | Female |
| Healthcare Support | 0 (0.0%) | 163 (100.0%) |
| Security & Protection | 60 (69.8%) | 26 (30.2%) |
| Firefighting & Prevention | 8 (100.0%) | 0 (0.0%) |
| Law Enforcement | 52 (66.7%) | 26 (33.3%) |
| Food Preparation & Serving | 62 (43.4%) | 81 (56.6%) |
| Cleaning & Maintenance | 58 (49.1%) | 60 (50.8%) |
| Personal Care & Service | 0 (0.0%) | 63 (100.0%) |
| Total (Category) | 180 (31.4%) | 393 (68.6%) |
| Total (Overall) | 2,273 (51.4%) | 2,146 (48.6%) |
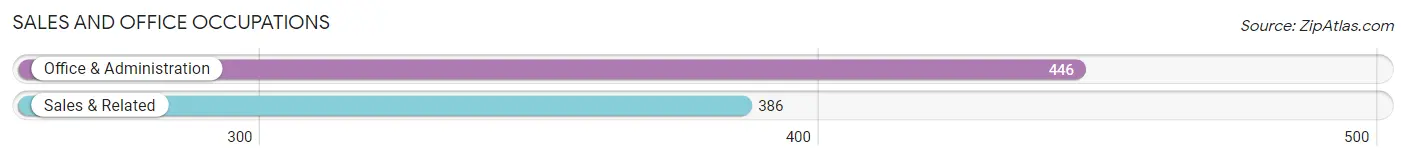
Sales and Office Occupations
The most common Sales and Office occupations in Decatur County are Office & Administration (446 | 10.1%), and Sales & Related (386 | 8.7%).
Sales and Office Occupations by Sex
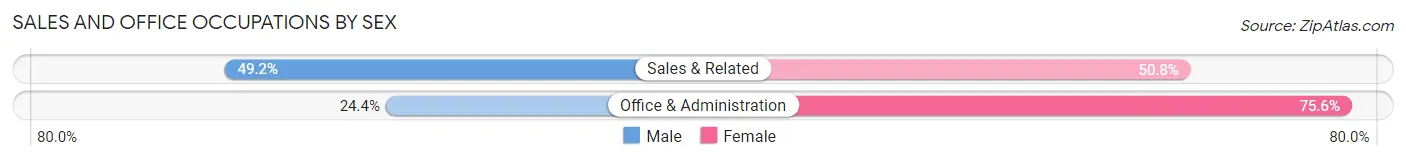
| Occupation | Male | Female |
| Sales & Related | 190 (49.2%) | 196 (50.8%) |
| Office & Administration | 109 (24.4%) | 337 (75.6%) |
| Total (Category) | 299 (35.9%) | 533 (64.1%) |
| Total (Overall) | 2,273 (51.4%) | 2,146 (48.6%) |
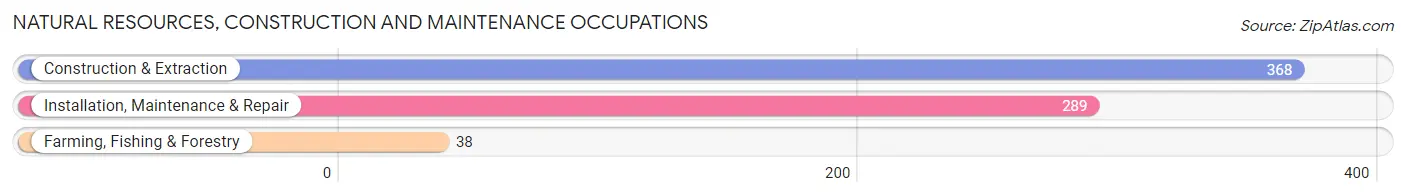
Natural Resources, Construction and Maintenance Occupations
The most common Natural Resources, Construction and Maintenance occupations in Decatur County are Construction & Extraction (368 | 8.3%), Installation, Maintenance & Repair (289 | 6.5%), and Farming, Fishing & Forestry (38 | 0.9%).
Natural Resources, Construction and Maintenance Occupations by Sex
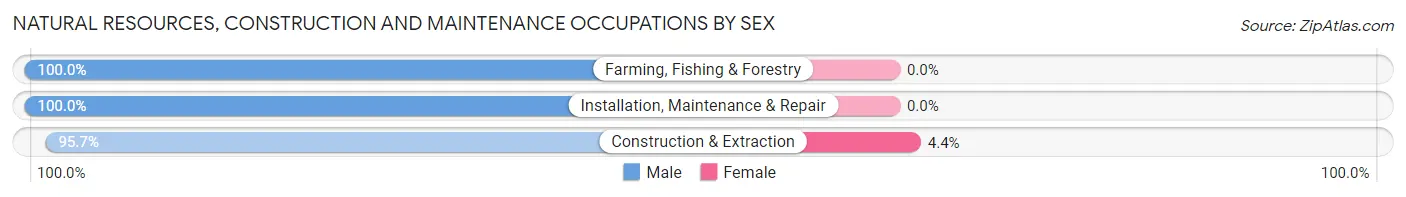
| Occupation | Male | Female |
| Farming, Fishing & Forestry | 38 (100.0%) | 0 (0.0%) |
| Construction & Extraction | 352 (95.7%) | 16 (4.3%) |
| Installation, Maintenance & Repair | 289 (100.0%) | 0 (0.0%) |
| Total (Category) | 679 (97.7%) | 16 (2.3%) |
| Total (Overall) | 2,273 (51.4%) | 2,146 (48.6%) |
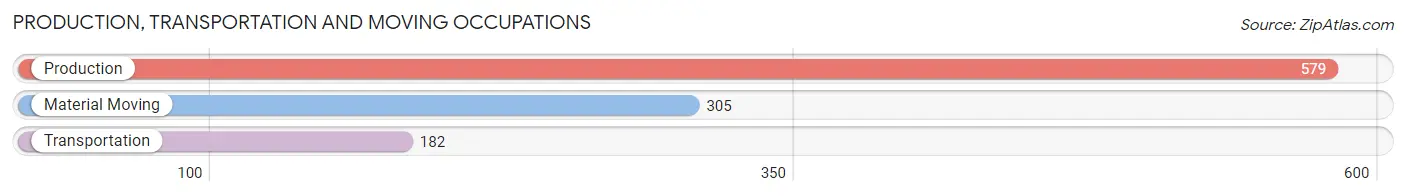
Production, Transportation and Moving Occupations
The most common Production, Transportation and Moving occupations in Decatur County are Production (579 | 13.1%), Material Moving (305 | 6.9%), and Transportation (182 | 4.1%).
Production, Transportation and Moving Occupations by Sex
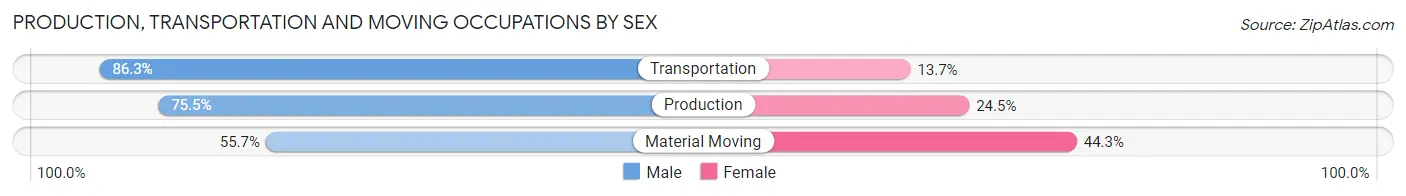
| Occupation | Male | Female |
| Production | 437 (75.5%) | 142 (24.5%) |
| Transportation | 157 (86.3%) | 25 (13.7%) |
| Material Moving | 170 (55.7%) | 135 (44.3%) |
| Total (Category) | 764 (71.7%) | 302 (28.3%) |
| Total (Overall) | 2,273 (51.4%) | 2,146 (48.6%) |
Employment Industries by Sex in Decatur County
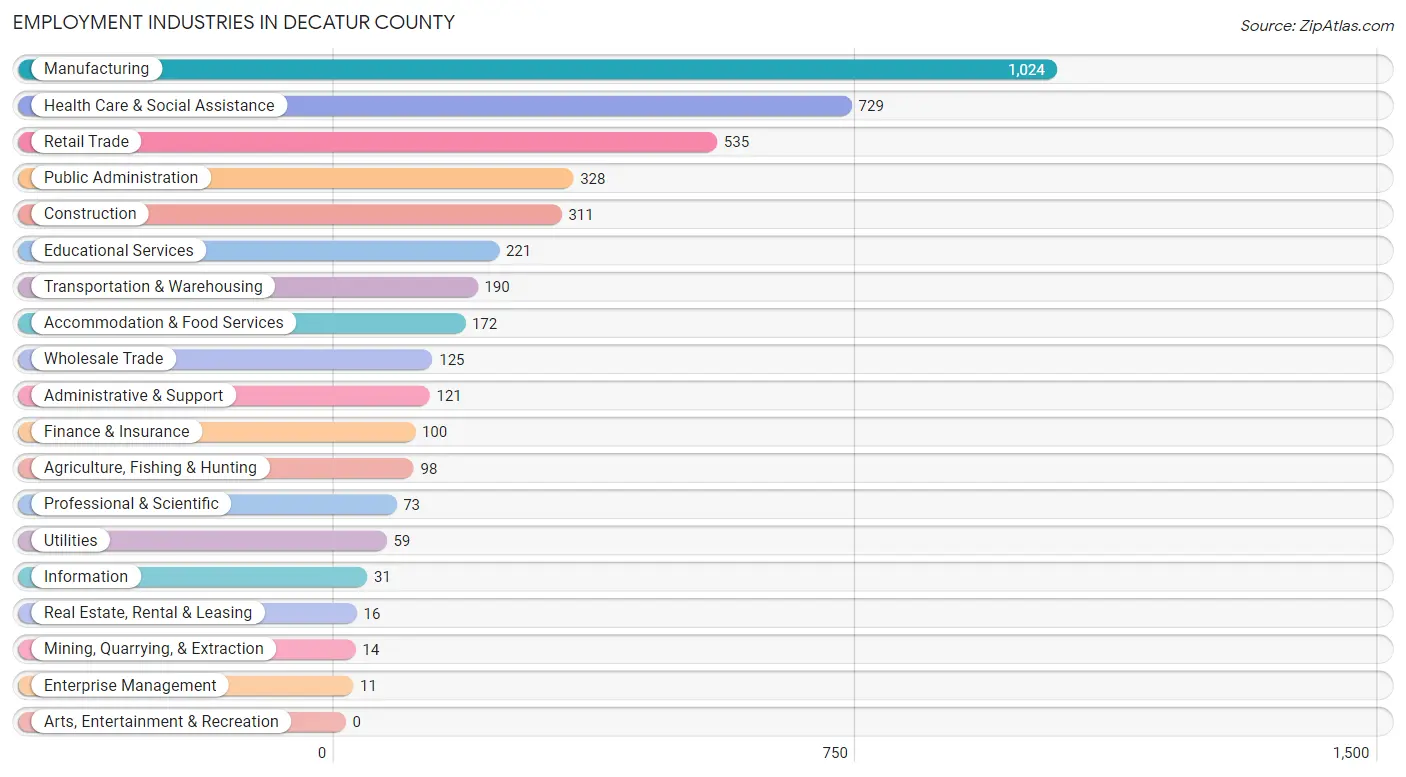
Employment Industries in Decatur County
The major employment industries in Decatur County include Manufacturing (1,024 | 23.2%), Health Care & Social Assistance (729 | 16.5%), Retail Trade (535 | 12.1%), Public Administration (328 | 7.4%), and Construction (311 | 7.0%).
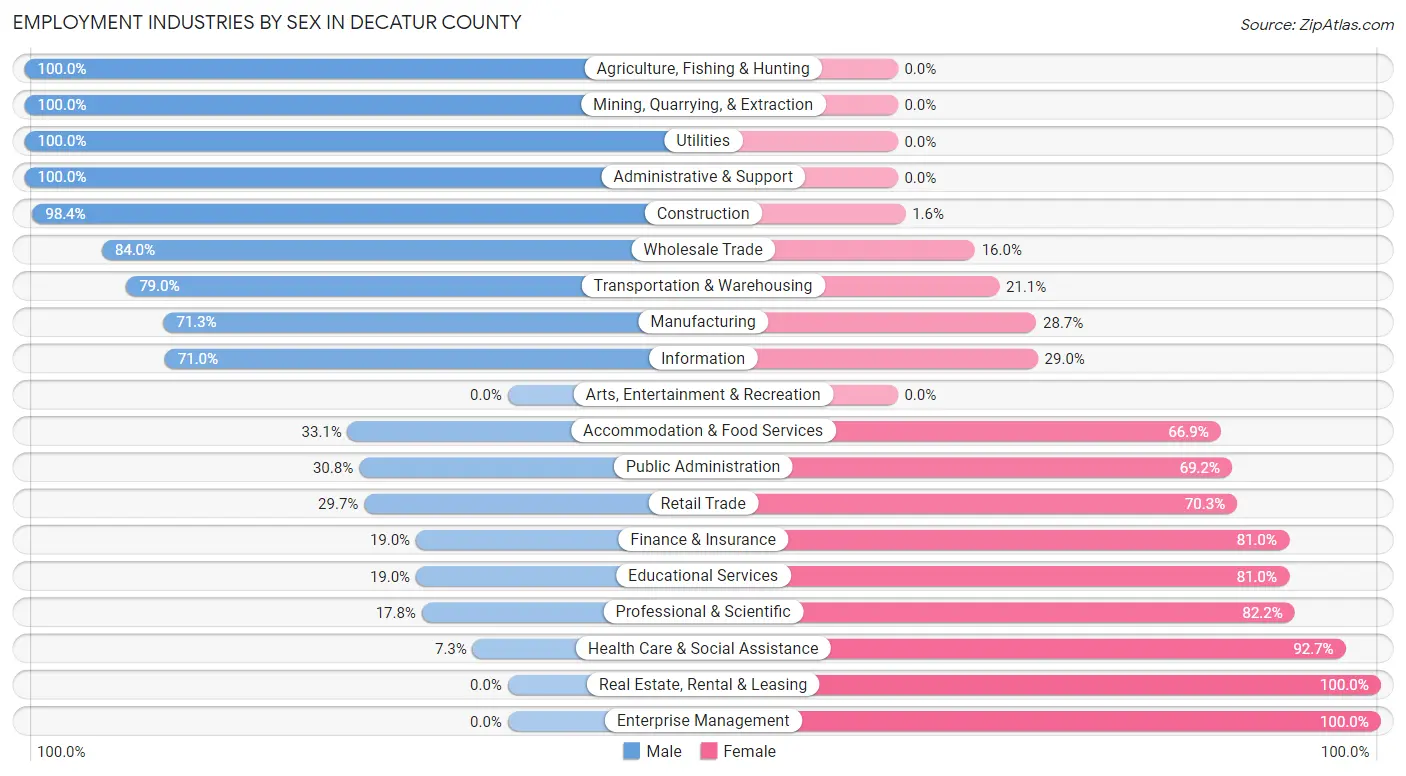
Employment Industries by Sex in Decatur County
The Decatur County industries that see more men than women are Agriculture, Fishing & Hunting (100.0%), Mining, Quarrying, & Extraction (100.0%), and Utilities (100.0%), whereas the industries that tend to have a higher number of women are Real Estate, Rental & Leasing (100.0%), Enterprise Management (100.0%), and Health Care & Social Assistance (92.7%).
| Industry | Male | Female |
| Agriculture, Fishing & Hunting | 98 (100.0%) | 0 (0.0%) |
| Mining, Quarrying, & Extraction | 14 (100.0%) | 0 (0.0%) |
| Construction | 306 (98.4%) | 5 (1.6%) |
| Manufacturing | 730 (71.3%) | 294 (28.7%) |
| Wholesale Trade | 105 (84.0%) | 20 (16.0%) |
| Retail Trade | 159 (29.7%) | 376 (70.3%) |
| Transportation & Warehousing | 150 (78.9%) | 40 (21.0%) |
| Utilities | 59 (100.0%) | 0 (0.0%) |
| Information | 22 (71.0%) | 9 (29.0%) |
| Finance & Insurance | 19 (19.0%) | 81 (81.0%) |
| Real Estate, Rental & Leasing | 0 (0.0%) | 16 (100.0%) |
| Professional & Scientific | 13 (17.8%) | 60 (82.2%) |
| Enterprise Management | 0 (0.0%) | 11 (100.0%) |
| Administrative & Support | 121 (100.0%) | 0 (0.0%) |
| Educational Services | 42 (19.0%) | 179 (81.0%) |
| Health Care & Social Assistance | 53 (7.3%) | 676 (92.7%) |
| Arts, Entertainment & Recreation | 0 (0.0%) | 0 (0.0%) |
| Accommodation & Food Services | 57 (33.1%) | 115 (66.9%) |
| Public Administration | 101 (30.8%) | 227 (69.2%) |
| Total | 2,273 (51.4%) | 2,146 (48.6%) |
Education in Decatur County
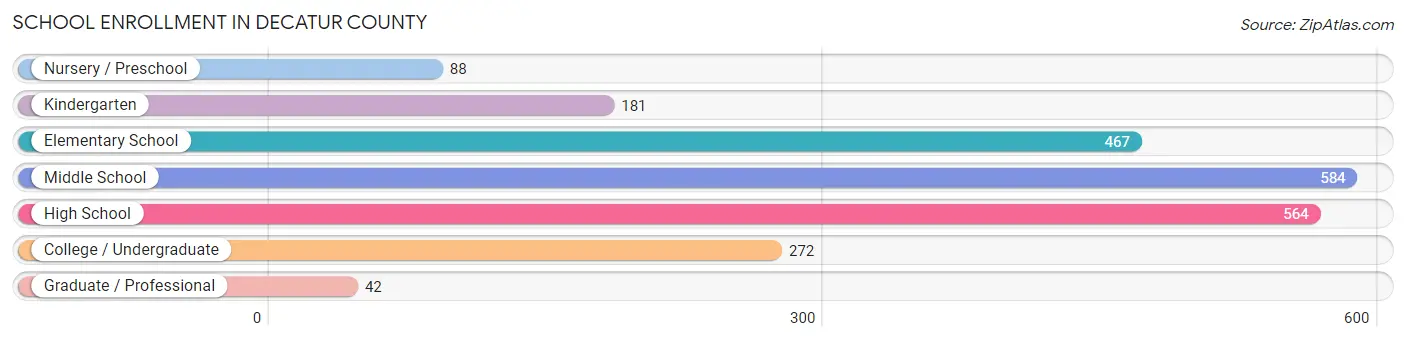
School Enrollment in Decatur County
The most common levels of schooling among the 2,198 students in Decatur County are middle school (584 | 26.6%), high school (564 | 25.7%), and elementary school (467 | 21.2%).
| School Level | # Students | % Students |
| Nursery / Preschool | 88 | 4.0% |
| Kindergarten | 181 | 8.2% |
| Elementary School | 467 | 21.2% |
| Middle School | 584 | 26.6% |
| High School | 564 | 25.7% |
| College / Undergraduate | 272 | 12.4% |
| Graduate / Professional | 42 | 1.9% |
| Total | 2,198 | 100.0% |
School Enrollment by Age by Funding Source in Decatur County
Out of a total of 2,198 students who are enrolled in schools in Decatur County, 226 (10.3%) attend a private institution, while the remaining 1,972 (89.7%) are enrolled in public schools. The age group of 3 to 4 year olds has the highest likelihood of being enrolled in private schools, with 18 (32.7% in the age bracket) enrolled. Conversely, the age group of 25 to 34 year olds has the lowest likelihood of being enrolled in a private school, with 55 (100.0% in the age bracket) attending a public institution.
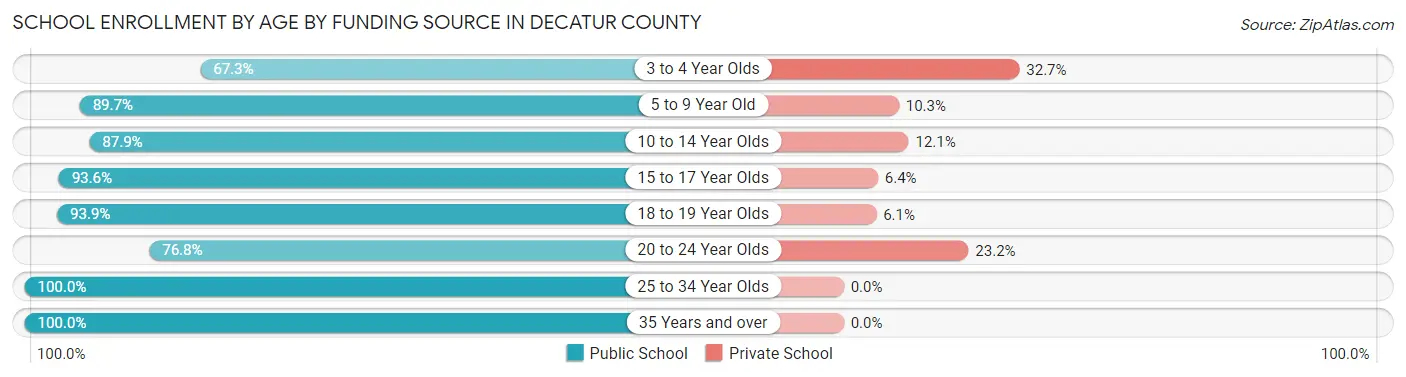
| Age Bracket | Public School | Private School |
| 3 to 4 Year Olds | 37 (67.3%) | 18 (32.7%) |
| 5 to 9 Year Old | 524 (89.7%) | 60 (10.3%) |
| 10 to 14 Year Olds | 626 (87.9%) | 86 (12.1%) |
| 15 to 17 Year Olds | 397 (93.6%) | 27 (6.4%) |
| 18 to 19 Year Olds | 186 (93.9%) | 12 (6.1%) |
| 20 to 24 Year Olds | 76 (76.8%) | 23 (23.2%) |
| 25 to 34 Year Olds | 55 (100.0%) | 0 (0.0%) |
| 35 Years and over | 71 (100.0%) | 0 (0.0%) |
| Total | 1,972 (89.7%) | 226 (10.3%) |
Educational Attainment by Field of Study in Decatur County
Business (247 | 18.1%), science & technology (200 | 14.7%), education (193 | 14.2%), computers & mathematics (113 | 8.3%), and social sciences (103 | 7.6%) are the most common fields of study among 1,363 individuals in Decatur County who have obtained a bachelor's degree or higher.
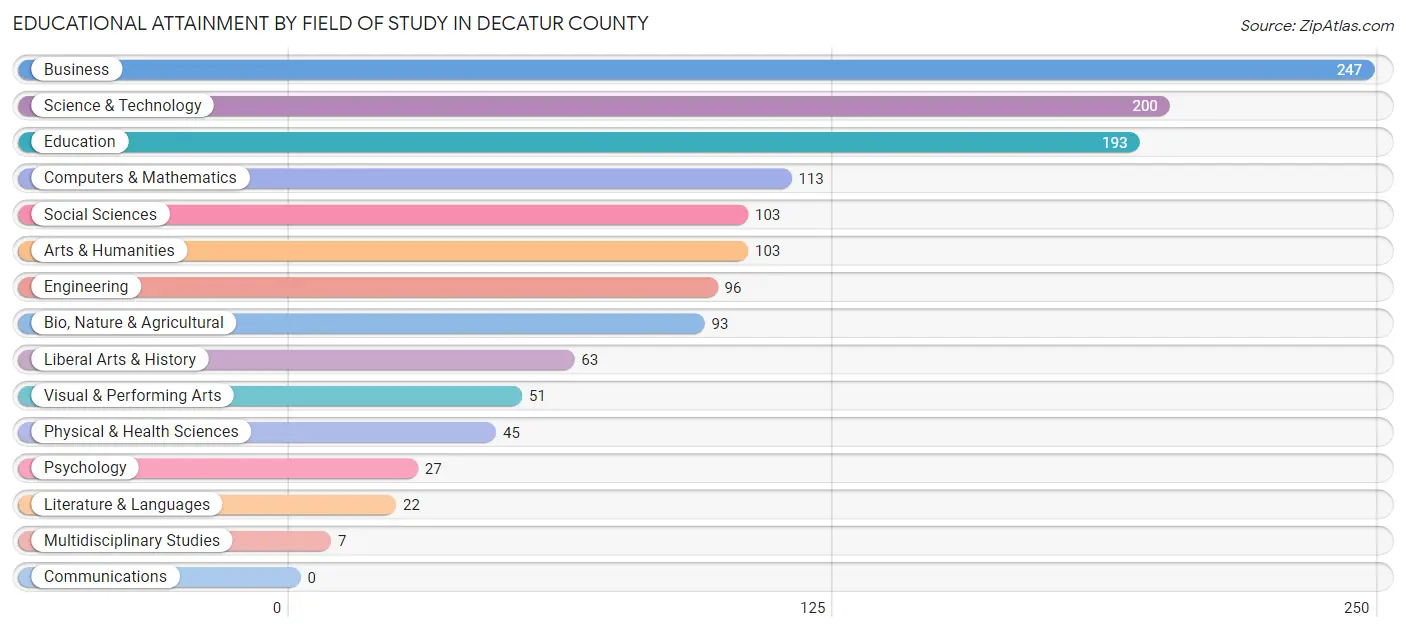
| Field of Study | # Graduates | % Graduates |
| Computers & Mathematics | 113 | 8.3% |
| Bio, Nature & Agricultural | 93 | 6.8% |
| Physical & Health Sciences | 45 | 3.3% |
| Psychology | 27 | 2.0% |
| Social Sciences | 103 | 7.6% |
| Engineering | 96 | 7.0% |
| Multidisciplinary Studies | 7 | 0.5% |
| Science & Technology | 200 | 14.7% |
| Business | 247 | 18.1% |
| Education | 193 | 14.2% |
| Literature & Languages | 22 | 1.6% |
| Liberal Arts & History | 63 | 4.6% |
| Visual & Performing Arts | 51 | 3.7% |
| Communications | 0 | 0.0% |
| Arts & Humanities | 103 | 7.6% |
| Total | 1,363 | 100.0% |
Transportation & Commute in Decatur County
Vehicle Availability by Sex in Decatur County
The most prevalent vehicle ownership categories in Decatur County are males with 2 vehicles (1,068, accounting for 47.3%) and females with 2 vehicles (733, making up 50.5%).
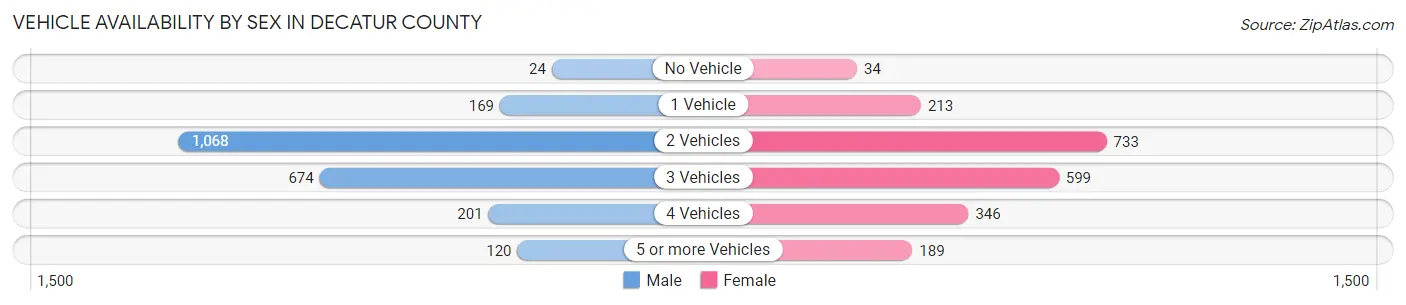
| Vehicles Available | Male | Female |
| No Vehicle | 24 (1.1%) | 34 (1.6%) |
| 1 Vehicle | 169 (7.5%) | 213 (10.1%) |
| 2 Vehicles | 1,068 (47.3%) | 733 (34.7%) |
| 3 Vehicles | 674 (29.9%) | 599 (28.3%) |
| 4 Vehicles | 201 (8.9%) | 346 (16.4%) |
| 5 or more Vehicles | 120 (5.3%) | 189 (8.9%) |
| Total | 2,256 (100.0%) | 2,114 (100.0%) |
Commute Time in Decatur County
The most frequently occuring commute durations in Decatur County are 15 to 19 minutes (670 commuters, 16.4%), 20 to 24 minutes (659 commuters, 16.1%), and 10 to 14 minutes (643 commuters, 15.7%).
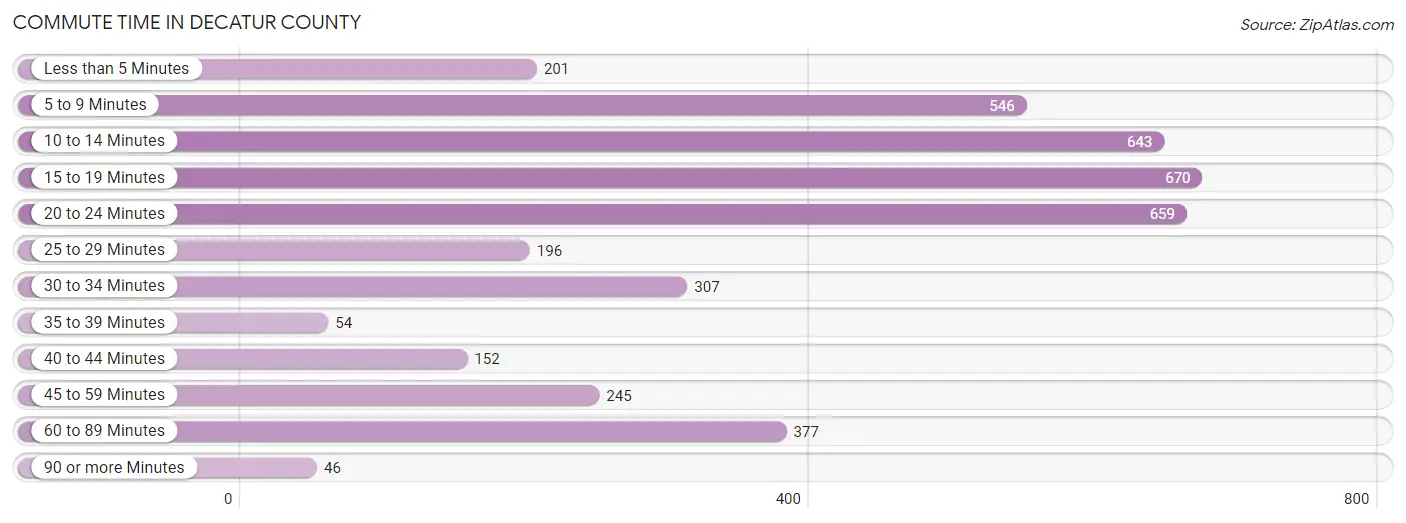
| Commute Time | # Commuters | % Commuters |
| Less than 5 Minutes | 201 | 4.9% |
| 5 to 9 Minutes | 546 | 13.3% |
| 10 to 14 Minutes | 643 | 15.7% |
| 15 to 19 Minutes | 670 | 16.4% |
| 20 to 24 Minutes | 659 | 16.1% |
| 25 to 29 Minutes | 196 | 4.8% |
| 30 to 34 Minutes | 307 | 7.5% |
| 35 to 39 Minutes | 54 | 1.3% |
| 40 to 44 Minutes | 152 | 3.7% |
| 45 to 59 Minutes | 245 | 6.0% |
| 60 to 89 Minutes | 377 | 9.2% |
| 90 or more Minutes | 46 | 1.1% |
Commute Time by Sex in Decatur County
The most common commute times in Decatur County are 15 to 19 minutes (391 commuters, 18.2%) for males and 5 to 9 minutes (365 commuters, 18.7%) for females.
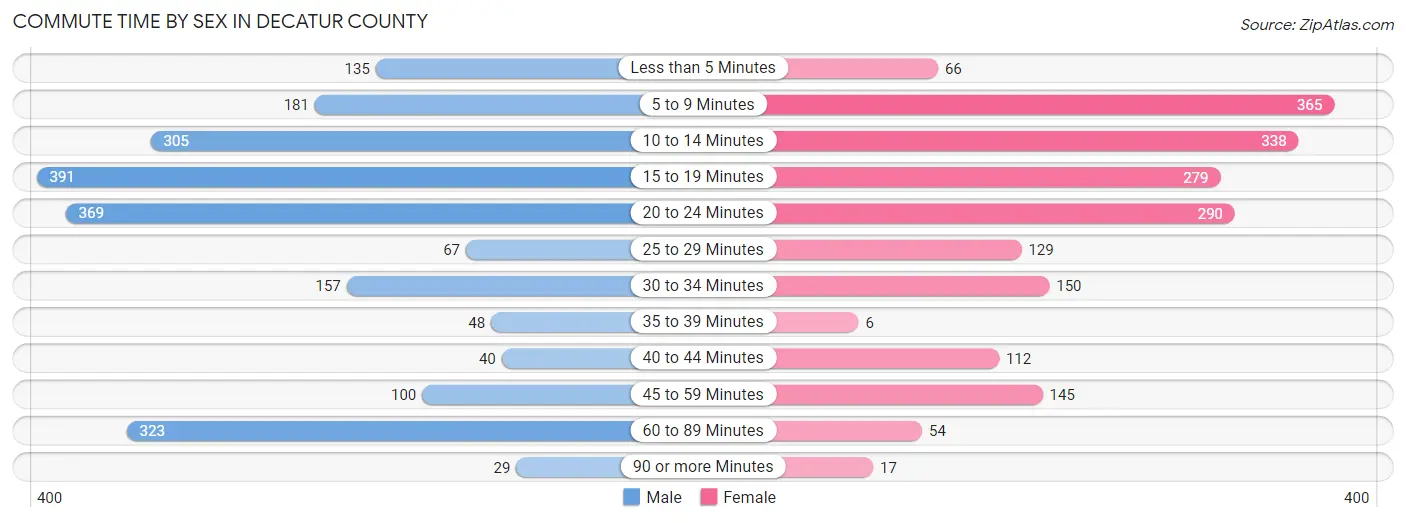
| Commute Time | Male | Female |
| Less than 5 Minutes | 135 (6.3%) | 66 (3.4%) |
| 5 to 9 Minutes | 181 (8.4%) | 365 (18.7%) |
| 10 to 14 Minutes | 305 (14.2%) | 338 (17.3%) |
| 15 to 19 Minutes | 391 (18.2%) | 279 (14.3%) |
| 20 to 24 Minutes | 369 (17.2%) | 290 (14.9%) |
| 25 to 29 Minutes | 67 (3.1%) | 129 (6.6%) |
| 30 to 34 Minutes | 157 (7.3%) | 150 (7.7%) |
| 35 to 39 Minutes | 48 (2.2%) | 6 (0.3%) |
| 40 to 44 Minutes | 40 (1.9%) | 112 (5.7%) |
| 45 to 59 Minutes | 100 (4.7%) | 145 (7.4%) |
| 60 to 89 Minutes | 323 (15.1%) | 54 (2.8%) |
| 90 or more Minutes | 29 (1.3%) | 17 (0.9%) |
Time of Departure to Work by Sex in Decatur County
The most frequent times of departure to work in Decatur County are 6:00 AM to 6:29 AM (337, 15.7%) for males and 7:00 AM to 7:29 AM (380, 19.5%) for females.
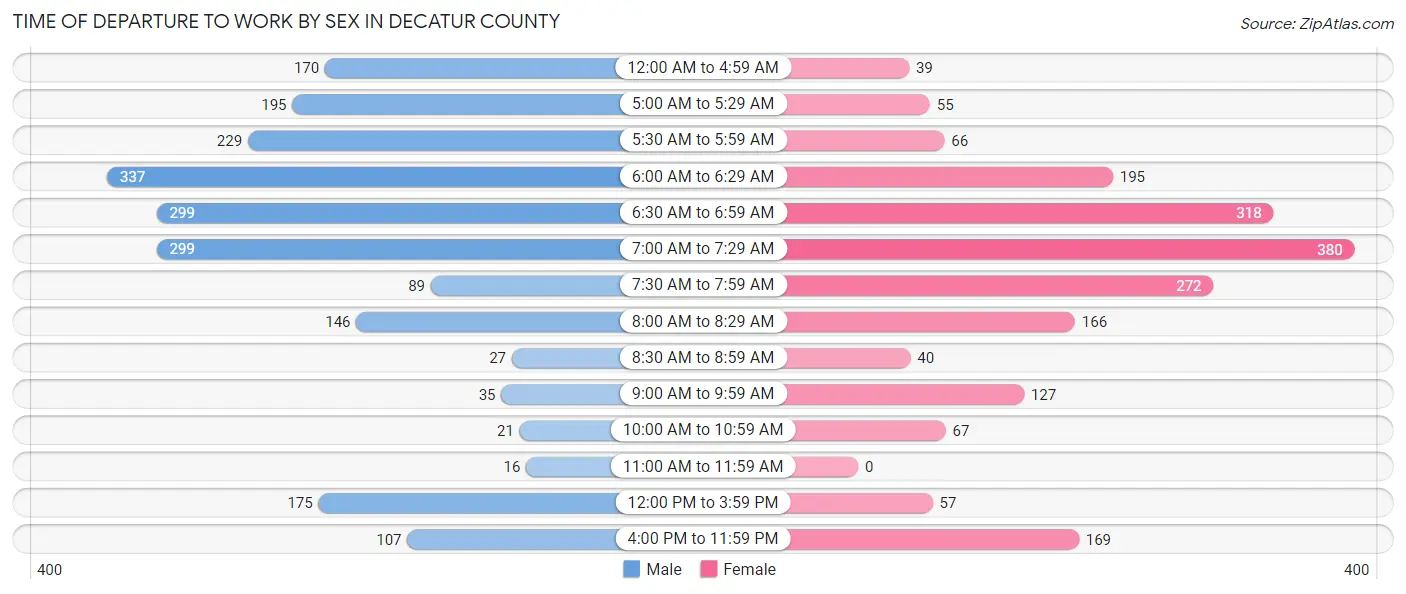
| Time of Departure | Male | Female |
| 12:00 AM to 4:59 AM | 170 (7.9%) | 39 (2.0%) |
| 5:00 AM to 5:29 AM | 195 (9.1%) | 55 (2.8%) |
| 5:30 AM to 5:59 AM | 229 (10.7%) | 66 (3.4%) |
| 6:00 AM to 6:29 AM | 337 (15.7%) | 195 (10.0%) |
| 6:30 AM to 6:59 AM | 299 (13.9%) | 318 (16.3%) |
| 7:00 AM to 7:29 AM | 299 (13.9%) | 380 (19.5%) |
| 7:30 AM to 7:59 AM | 89 (4.2%) | 272 (13.9%) |
| 8:00 AM to 8:29 AM | 146 (6.8%) | 166 (8.5%) |
| 8:30 AM to 8:59 AM | 27 (1.3%) | 40 (2.1%) |
| 9:00 AM to 9:59 AM | 35 (1.6%) | 127 (6.5%) |
| 10:00 AM to 10:59 AM | 21 (1.0%) | 67 (3.4%) |
| 11:00 AM to 11:59 AM | 16 (0.7%) | 0 (0.0%) |
| 12:00 PM to 3:59 PM | 175 (8.2%) | 57 (2.9%) |
| 4:00 PM to 11:59 PM | 107 (5.0%) | 169 (8.7%) |
| Total | 2,145 (100.0%) | 1,951 (100.0%) |
Housing Occupancy in Decatur County
Occupancy by Ownership in Decatur County
Of the total 4,363 dwellings in Decatur County, owner-occupied units account for 3,413 (78.2%), while renter-occupied units make up 950 (21.8%).
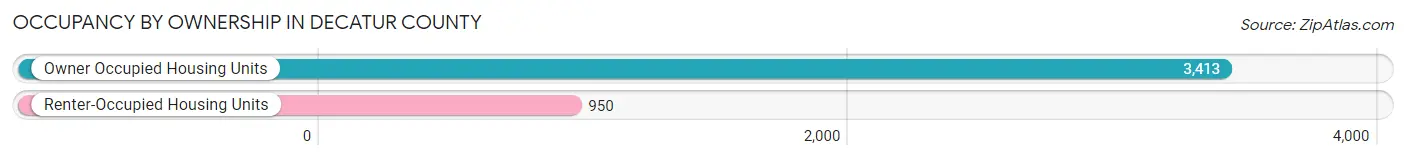
| Occupancy | # Housing Units | % Housing Units |
| Owner Occupied Housing Units | 3,413 | 78.2% |
| Renter-Occupied Housing Units | 950 | 21.8% |
| Total Occupied Housing Units | 4,363 | 100.0% |
Occupancy by Household Size in Decatur County
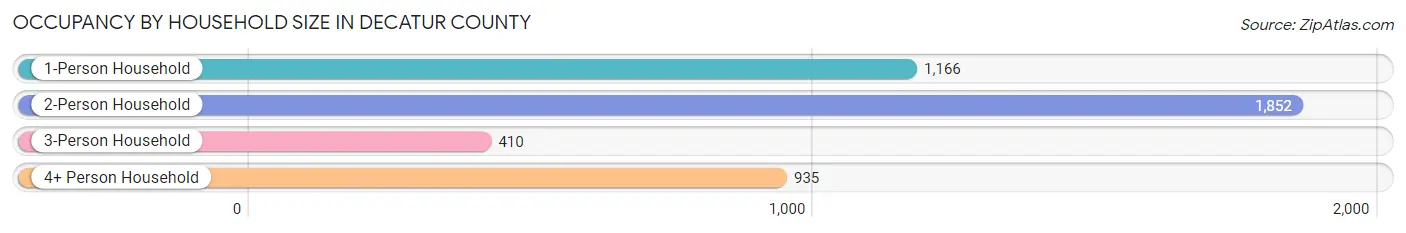
| Household Size | # Housing Units | % Housing Units |
| 1-Person Household | 1,166 | 26.7% |
| 2-Person Household | 1,852 | 42.4% |
| 3-Person Household | 410 | 9.4% |
| 4+ Person Household | 935 | 21.4% |
| Total Housing Units | 4,363 | 100.0% |
Occupancy by Ownership by Household Size in Decatur County
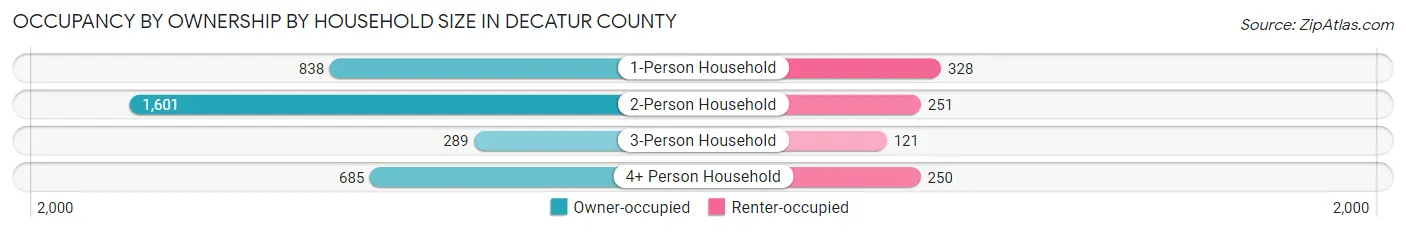
| Household Size | Owner-occupied | Renter-occupied |
| 1-Person Household | 838 (71.9%) | 328 (28.1%) |
| 2-Person Household | 1,601 (86.5%) | 251 (13.6%) |
| 3-Person Household | 289 (70.5%) | 121 (29.5%) |
| 4+ Person Household | 685 (73.3%) | 250 (26.7%) |
| Total Housing Units | 3,413 (78.2%) | 950 (21.8%) |
Occupancy by Educational Attainment in Decatur County
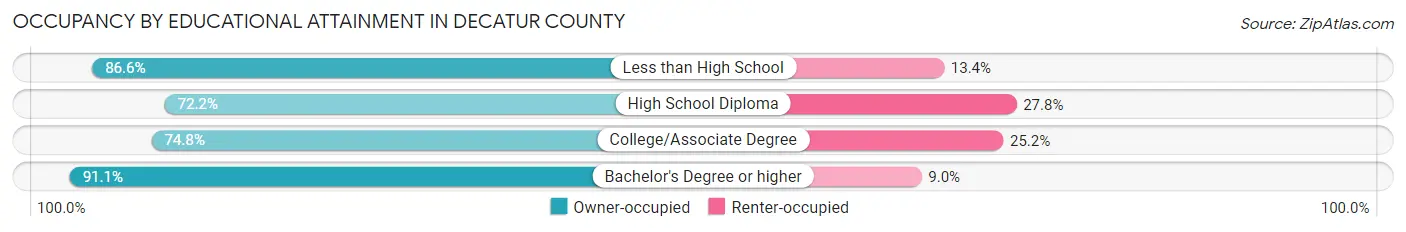
| Household Size | Owner-occupied | Renter-occupied |
| Less than High School | 542 (86.6%) | 84 (13.4%) |
| High School Diploma | 1,358 (72.2%) | 522 (27.8%) |
| College/Associate Degree | 821 (74.8%) | 276 (25.2%) |
| Bachelor's Degree or higher | 692 (91.0%) | 68 (8.9%) |
Occupancy by Age of Householder in Decatur County
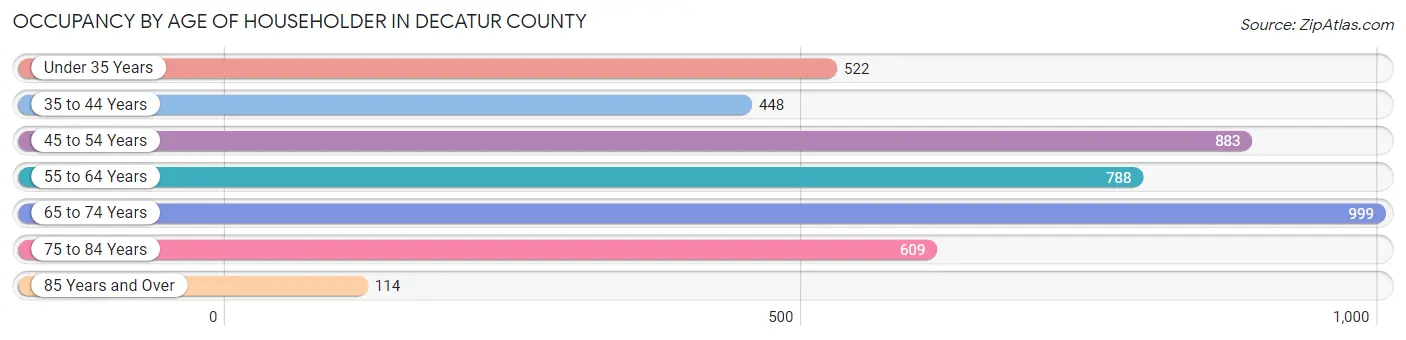
| Age Bracket | # Households | % Households |
| Under 35 Years | 522 | 12.0% |
| 35 to 44 Years | 448 | 10.3% |
| 45 to 54 Years | 883 | 20.2% |
| 55 to 64 Years | 788 | 18.1% |
| 65 to 74 Years | 999 | 22.9% |
| 75 to 84 Years | 609 | 14.0% |
| 85 Years and Over | 114 | 2.6% |
| Total | 4,363 | 100.0% |
Housing Finances in Decatur County
Median Income by Occupancy in Decatur County
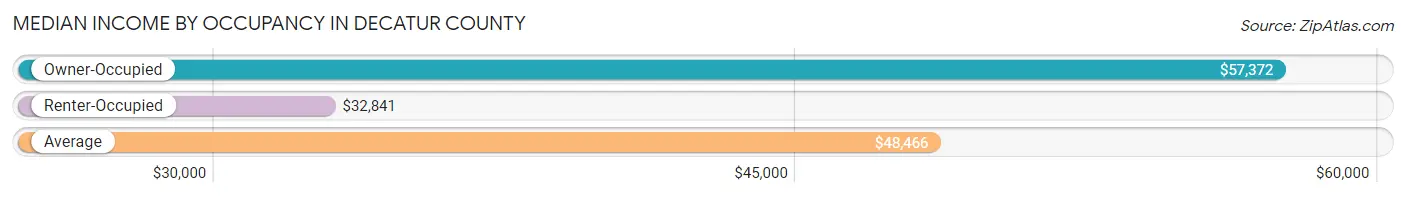
| Occupancy Type | # Households | Median Income |
| Owner-Occupied | 3,413 (78.2%) | $57,372 |
| Renter-Occupied | 950 (21.8%) | $32,841 |
| Average | 4,363 (100.0%) | $48,466 |
Occupancy by Householder Income Bracket in Decatur County

| Income Bracket | Owner-occupied | Renter-occupied |
| Less than $5,000 | 94 (2.8%) | 102 (10.7%) |
| $5,000 to $9,999 | 22 (0.6%) | 17 (1.8%) |
| $10,000 to $14,999 | 267 (7.8%) | 107 (11.3%) |
| $15,000 to $19,999 | 128 (3.7%) | 96 (10.1%) |
| $20,000 to $24,999 | 153 (4.5%) | 61 (6.4%) |
| $25,000 to $34,999 | 414 (12.1%) | 130 (13.7%) |
| $35,000 to $49,999 | 461 (13.5%) | 197 (20.7%) |
| $50,000 to $74,999 | 605 (17.7%) | 122 (12.8%) |
| $75,000 to $99,999 | 596 (17.5%) | 108 (11.4%) |
| $100,000 to $149,999 | 432 (12.7%) | 0 (0.0%) |
| $150,000 or more | 241 (7.1%) | 10 (1.1%) |
| Total | 3,413 (100.0%) | 950 (100.0%) |
Monthly Housing Cost Tiers in Decatur County
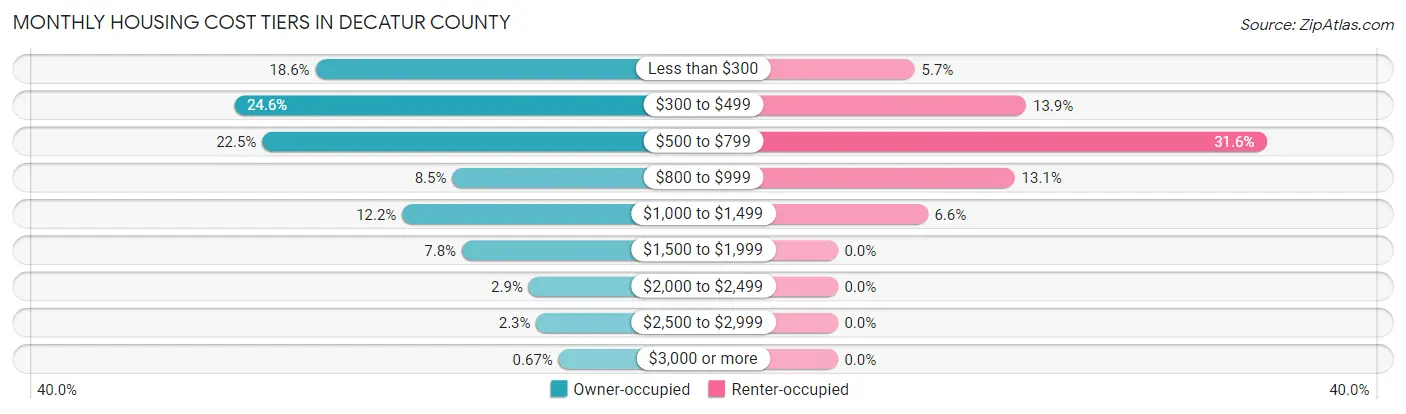
| Monthly Cost | Owner-occupied | Renter-occupied |
| Less than $300 | 634 (18.6%) | 54 (5.7%) |
| $300 to $499 | 839 (24.6%) | 132 (13.9%) |
| $500 to $799 | 768 (22.5%) | 300 (31.6%) |
| $800 to $999 | 290 (8.5%) | 124 (13.1%) |
| $1,000 to $1,499 | 416 (12.2%) | 63 (6.6%) |
| $1,500 to $1,999 | 266 (7.8%) | 0 (0.0%) |
| $2,000 to $2,499 | 98 (2.9%) | 0 (0.0%) |
| $2,500 to $2,999 | 79 (2.3%) | 0 (0.0%) |
| $3,000 or more | 23 (0.7%) | 0 (0.0%) |
| Total | 3,413 (100.0%) | 950 (100.0%) |
Physical Housing Characteristics in Decatur County
Housing Structures in Decatur County
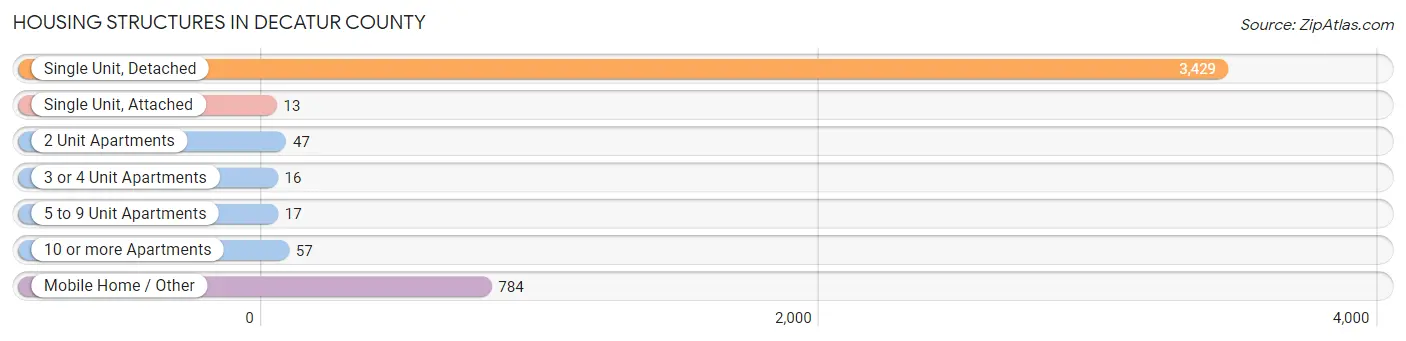
| Structure Type | # Housing Units | % Housing Units |
| Single Unit, Detached | 3,429 | 78.6% |
| Single Unit, Attached | 13 | 0.3% |
| 2 Unit Apartments | 47 | 1.1% |
| 3 or 4 Unit Apartments | 16 | 0.4% |
| 5 to 9 Unit Apartments | 17 | 0.4% |
| 10 or more Apartments | 57 | 1.3% |
| Mobile Home / Other | 784 | 18.0% |
| Total | 4,363 | 100.0% |
Housing Structures by Occupancy in Decatur County

| Structure Type | Owner-occupied | Renter-occupied |
| Single Unit, Detached | 2,862 (83.5%) | 567 (16.5%) |
| Single Unit, Attached | 13 (100.0%) | 0 (0.0%) |
| 2 Unit Apartments | 0 (0.0%) | 47 (100.0%) |
| 3 or 4 Unit Apartments | 0 (0.0%) | 16 (100.0%) |
| 5 to 9 Unit Apartments | 0 (0.0%) | 17 (100.0%) |
| 10 or more Apartments | 0 (0.0%) | 57 (100.0%) |
| Mobile Home / Other | 538 (68.6%) | 246 (31.4%) |
| Total | 3,413 (78.2%) | 950 (21.8%) |
Housing Structures by Number of Rooms in Decatur County
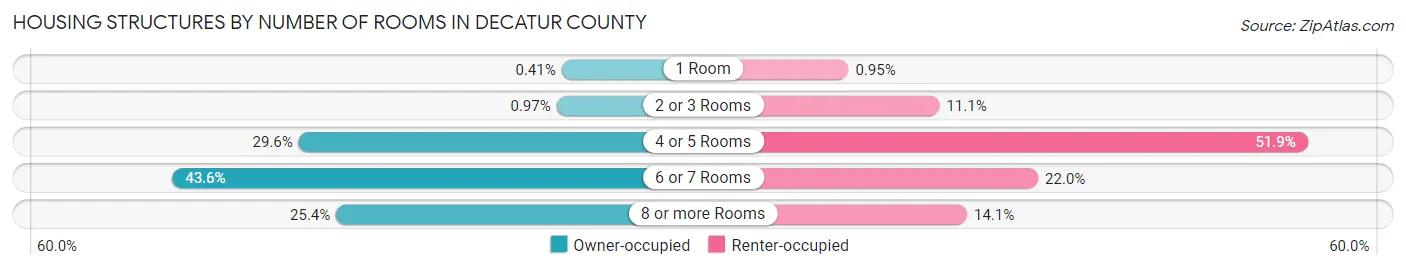
| Number of Rooms | Owner-occupied | Renter-occupied |
| 1 Room | 14 (0.4%) | 9 (0.9%) |
| 2 or 3 Rooms | 33 (1.0%) | 105 (11.1%) |
| 4 or 5 Rooms | 1,010 (29.6%) | 493 (51.9%) |
| 6 or 7 Rooms | 1,488 (43.6%) | 209 (22.0%) |
| 8 or more Rooms | 868 (25.4%) | 134 (14.1%) |
| Total | 3,413 (100.0%) | 950 (100.0%) |
Housing Structure by Heating Type in Decatur County
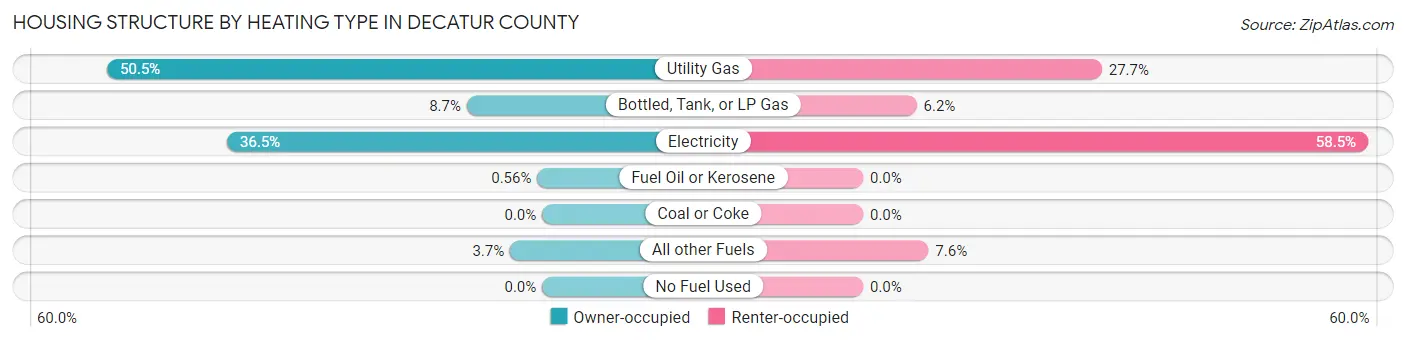
| Heating Type | Owner-occupied | Renter-occupied |
| Utility Gas | 1,722 (50.4%) | 263 (27.7%) |
| Bottled, Tank, or LP Gas | 298 (8.7%) | 59 (6.2%) |
| Electricity | 1,247 (36.5%) | 556 (58.5%) |
| Fuel Oil or Kerosene | 19 (0.6%) | 0 (0.0%) |
| Coal or Coke | 0 (0.0%) | 0 (0.0%) |
| All other Fuels | 127 (3.7%) | 72 (7.6%) |
| No Fuel Used | 0 (0.0%) | 0 (0.0%) |
| Total | 3,413 (100.0%) | 950 (100.0%) |
Household Vehicle Usage in Decatur County
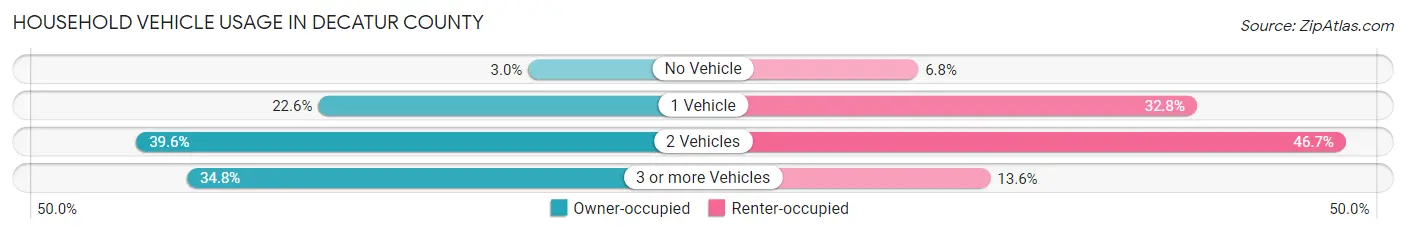
| Vehicles per Household | Owner-occupied | Renter-occupied |
| No Vehicle | 102 (3.0%) | 65 (6.8%) |
| 1 Vehicle | 771 (22.6%) | 312 (32.8%) |
| 2 Vehicles | 1,351 (39.6%) | 444 (46.7%) |
| 3 or more Vehicles | 1,189 (34.8%) | 129 (13.6%) |
| Total | 3,413 (100.0%) | 950 (100.0%) |
Real Estate & Mortgages in Decatur County
Real Estate and Mortgage Overview in Decatur County
| Characteristic | Without Mortgage | With Mortgage |
| Housing Units | 1,920 | 1,493 |
| Median Property Value | $115,100 | $151,300 |
| Median Household Income | $46,534 | $140 |
| Monthly Housing Costs | $378 | $23 |
| Real Estate Taxes | $580 | $126 |
Property Value by Mortgage Status in Decatur County
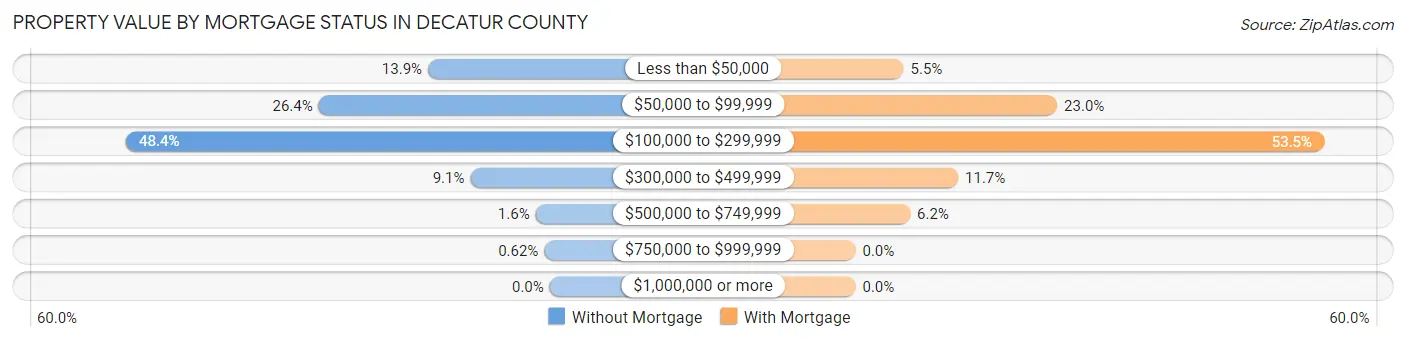
| Property Value | Without Mortgage | With Mortgage |
| Less than $50,000 | 267 (13.9%) | 82 (5.5%) |
| $50,000 to $99,999 | 507 (26.4%) | 344 (23.0%) |
| $100,000 to $299,999 | 929 (48.4%) | 799 (53.5%) |
| $300,000 to $499,999 | 174 (9.1%) | 175 (11.7%) |
| $500,000 to $749,999 | 31 (1.6%) | 93 (6.2%) |
| $750,000 to $999,999 | 12 (0.6%) | 0 (0.0%) |
| $1,000,000 or more | 0 (0.0%) | 0 (0.0%) |
| Total | 1,920 (100.0%) | 1,493 (100.0%) |
Household Income by Mortgage Status in Decatur County
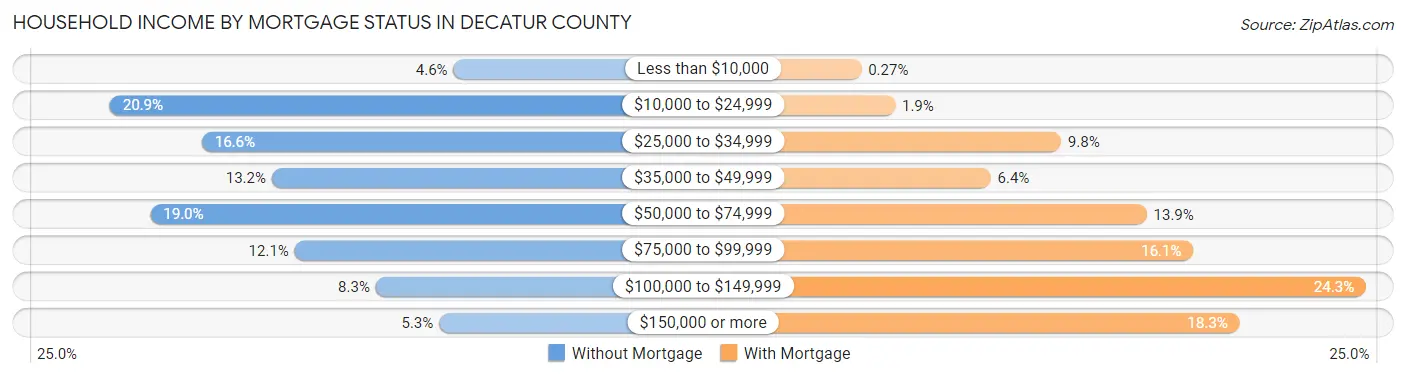
| Household Income | Without Mortgage | With Mortgage |
| Less than $10,000 | 88 (4.6%) | 4 (0.3%) |
| $10,000 to $24,999 | 402 (20.9%) | 28 (1.9%) |
| $25,000 to $34,999 | 318 (16.6%) | 146 (9.8%) |
| $35,000 to $49,999 | 254 (13.2%) | 96 (6.4%) |
| $50,000 to $74,999 | 365 (19.0%) | 207 (13.9%) |
| $75,000 to $99,999 | 233 (12.1%) | 240 (16.1%) |
| $100,000 to $149,999 | 159 (8.3%) | 363 (24.3%) |
| $150,000 or more | 101 (5.3%) | 273 (18.3%) |
| Total | 1,920 (100.0%) | 1,493 (100.0%) |
Property Value to Household Income Ratio in Decatur County
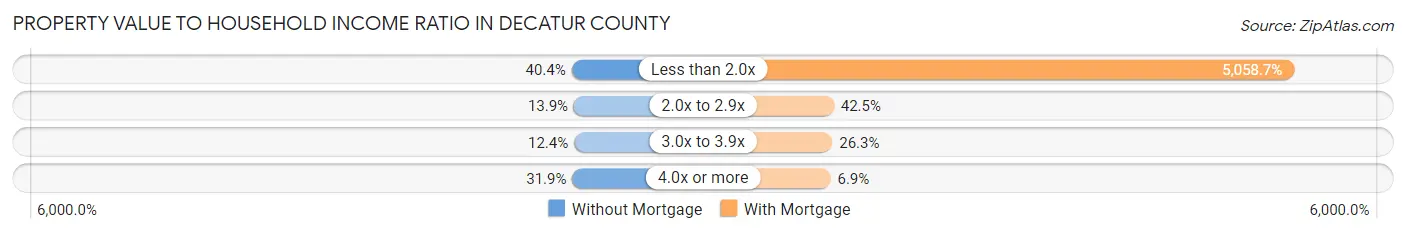
| Value-to-Income Ratio | Without Mortgage | With Mortgage |
| Less than 2.0x | 775 (40.4%) | 75,527 (5,058.7%) |
| 2.0x to 2.9x | 267 (13.9%) | 634 (42.5%) |
| 3.0x to 3.9x | 238 (12.4%) | 392 (26.3%) |
| 4.0x or more | 612 (31.9%) | 103 (6.9%) |
| Total | 1,920 (100.0%) | 1,493 (100.0%) |
Real Estate Taxes by Mortgage Status in Decatur County
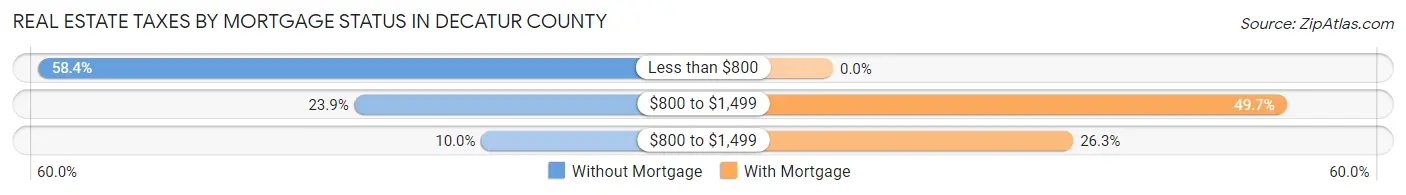
| Property Taxes | Without Mortgage | With Mortgage |
| Less than $800 | 1,122 (58.4%) | 0 (0.0%) |
| $800 to $1,499 | 458 (23.8%) | 742 (49.7%) |
| $800 to $1,499 | 191 (10.0%) | 393 (26.3%) |
| Total | 1,920 (100.0%) | 1,493 (100.0%) |
Health & Disability in Decatur County
Health Insurance Coverage by Age in Decatur County
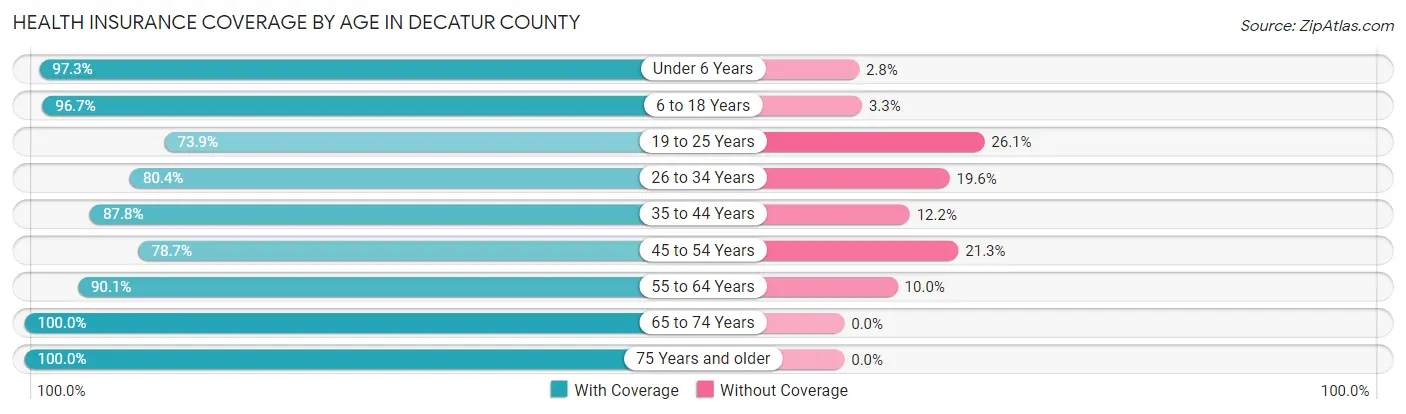
| Age Bracket | With Coverage | Without Coverage |
| Under 6 Years | 637 (97.3%) | 18 (2.8%) |
| 6 to 18 Years | 1,728 (96.7%) | 59 (3.3%) |
| 19 to 25 Years | 546 (73.9%) | 193 (26.1%) |
| 26 to 34 Years | 900 (80.4%) | 220 (19.6%) |
| 35 to 44 Years | 1,144 (87.8%) | 159 (12.2%) |
| 45 to 54 Years | 1,129 (78.7%) | 305 (21.3%) |
| 55 to 64 Years | 1,485 (90.0%) | 164 (10.0%) |
| 65 to 74 Years | 1,515 (100.0%) | 0 (0.0%) |
| 75 Years and older | 1,065 (100.0%) | 0 (0.0%) |
| Total | 10,149 (90.1%) | 1,118 (9.9%) |
Health Insurance Coverage by Citizenship Status in Decatur County
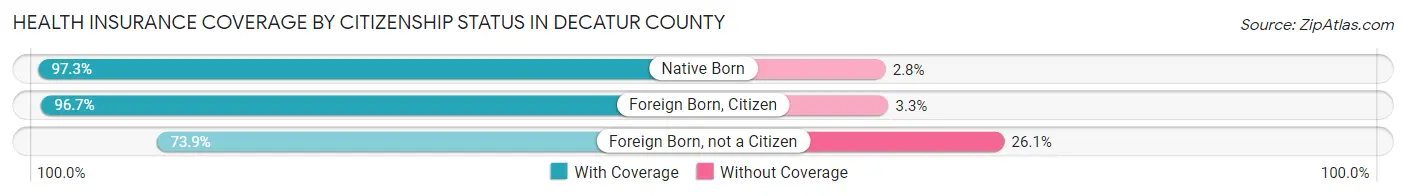
| Citizenship Status | With Coverage | Without Coverage |
| Native Born | 637 (97.3%) | 18 (2.8%) |
| Foreign Born, Citizen | 1,728 (96.7%) | 59 (3.3%) |
| Foreign Born, not a Citizen | 546 (73.9%) | 193 (26.1%) |
Health Insurance Coverage by Household Income in Decatur County
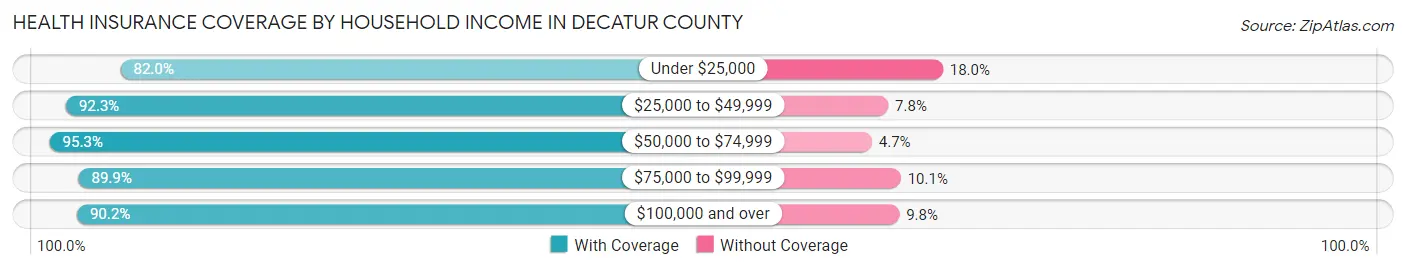
| Household Income | With Coverage | Without Coverage |
| Under $25,000 | 1,624 (82.0%) | 356 (18.0%) |
| $25,000 to $49,999 | 2,417 (92.2%) | 203 (7.7%) |
| $50,000 to $74,999 | 1,891 (95.3%) | 93 (4.7%) |
| $75,000 to $99,999 | 1,849 (89.9%) | 208 (10.1%) |
| $100,000 and over | 2,368 (90.2%) | 258 (9.8%) |
Public vs Private Health Insurance Coverage by Age in Decatur County
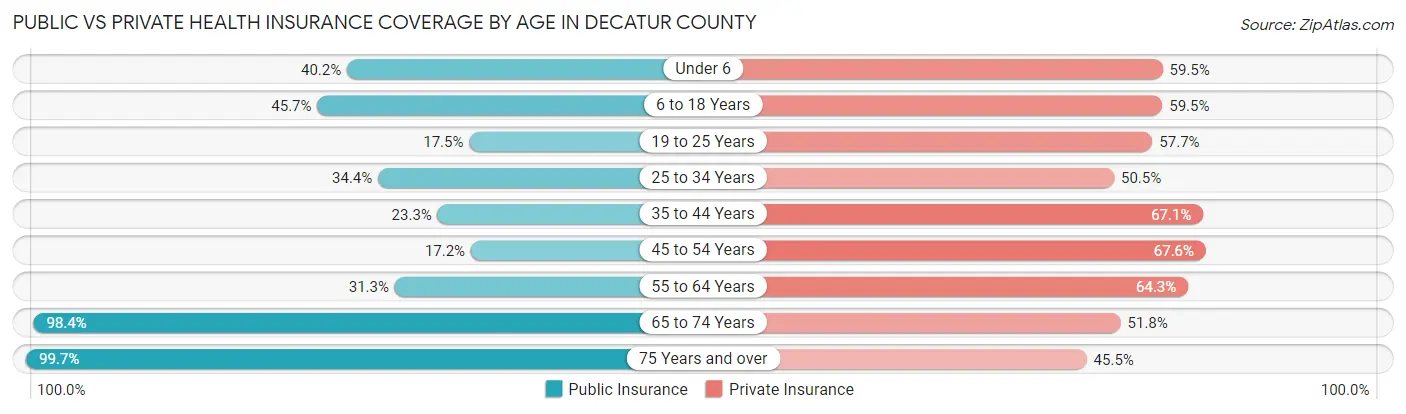
| Age Bracket | Public Insurance | Private Insurance |
| Under 6 | 263 (40.2%) | 390 (59.5%) |
| 6 to 18 Years | 816 (45.7%) | 1,063 (59.5%) |
| 19 to 25 Years | 129 (17.5%) | 426 (57.7%) |
| 25 to 34 Years | 385 (34.4%) | 566 (50.5%) |
| 35 to 44 Years | 304 (23.3%) | 874 (67.1%) |
| 45 to 54 Years | 246 (17.2%) | 969 (67.6%) |
| 55 to 64 Years | 516 (31.3%) | 1,060 (64.3%) |
| 65 to 74 Years | 1,490 (98.4%) | 784 (51.7%) |
| 75 Years and over | 1,062 (99.7%) | 484 (45.5%) |
| Total | 5,211 (46.3%) | 6,616 (58.7%) |
Disability Status by Sex by Age in Decatur County
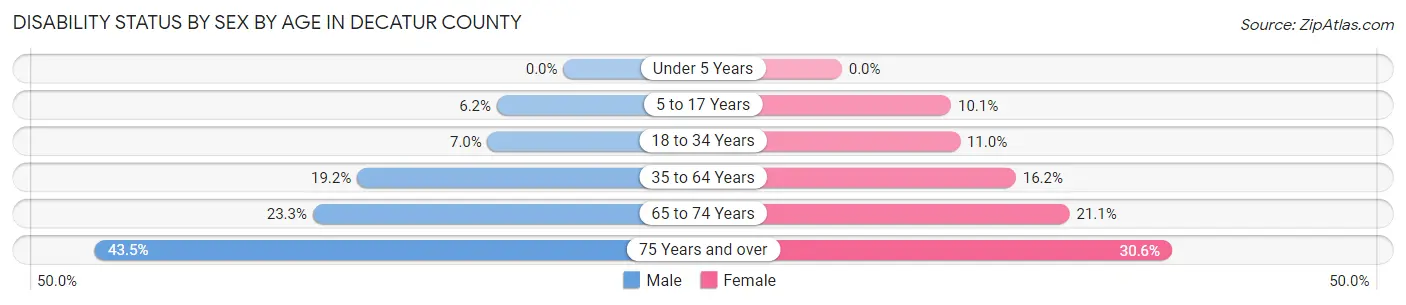
| Age Bracket | Male | Female |
| Under 5 Years | 0 (0.0%) | 0 (0.0%) |
| 5 to 17 Years | 59 (6.2%) | 82 (10.1%) |
| 18 to 34 Years | 72 (7.0%) | 105 (11.0%) |
| 35 to 64 Years | 406 (19.2%) | 366 (16.2%) |
| 65 to 74 Years | 173 (23.3%) | 163 (21.1%) |
| 75 Years and over | 189 (43.4%) | 193 (30.6%) |
Disability Class by Sex by Age in Decatur County
Disability Class: Hearing Difficulty
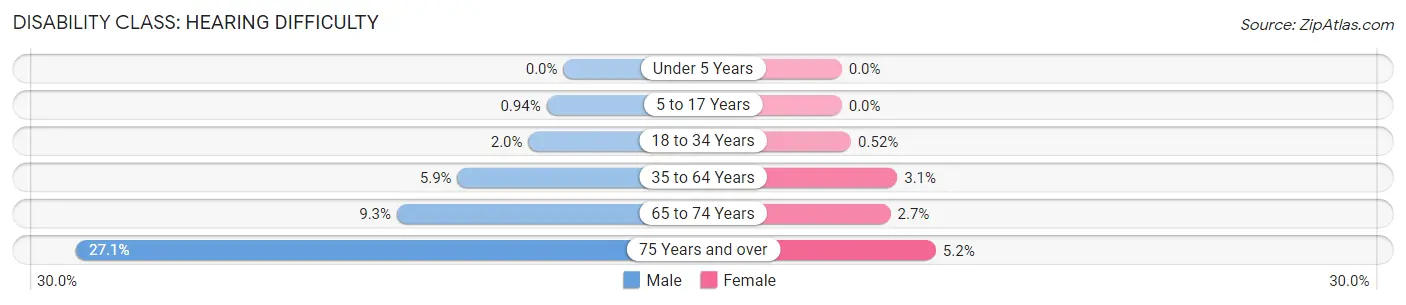
| Age Bracket | Male | Female |
| Under 5 Years | 0 (0.0%) | 0 (0.0%) |
| 5 to 17 Years | 9 (0.9%) | 0 (0.0%) |
| 18 to 34 Years | 20 (1.9%) | 5 (0.5%) |
| 35 to 64 Years | 125 (5.9%) | 70 (3.1%) |
| 65 to 74 Years | 69 (9.3%) | 21 (2.7%) |
| 75 Years and over | 118 (27.1%) | 33 (5.2%) |
Disability Class: Vision Difficulty
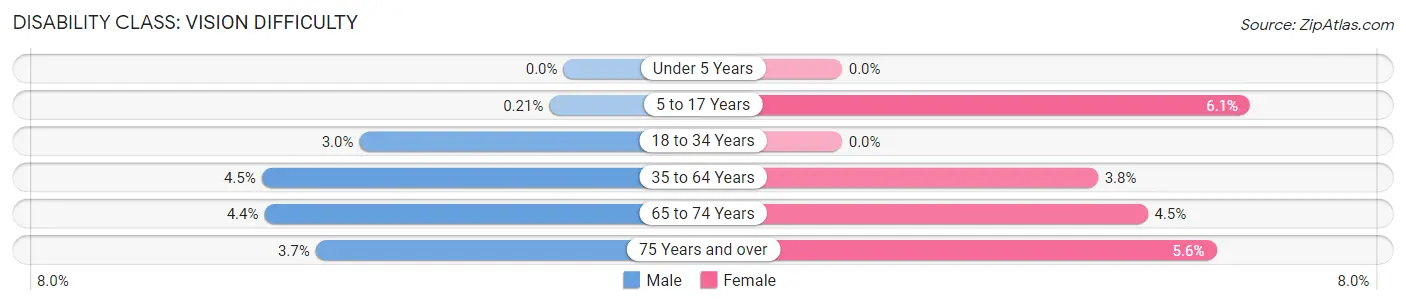
| Age Bracket | Male | Female |
| Under 5 Years | 0 (0.0%) | 0 (0.0%) |
| 5 to 17 Years | 2 (0.2%) | 49 (6.1%) |
| 18 to 34 Years | 31 (3.0%) | 0 (0.0%) |
| 35 to 64 Years | 95 (4.5%) | 86 (3.8%) |
| 65 to 74 Years | 33 (4.4%) | 35 (4.5%) |
| 75 Years and over | 16 (3.7%) | 35 (5.6%) |
Disability Class: Cognitive Difficulty
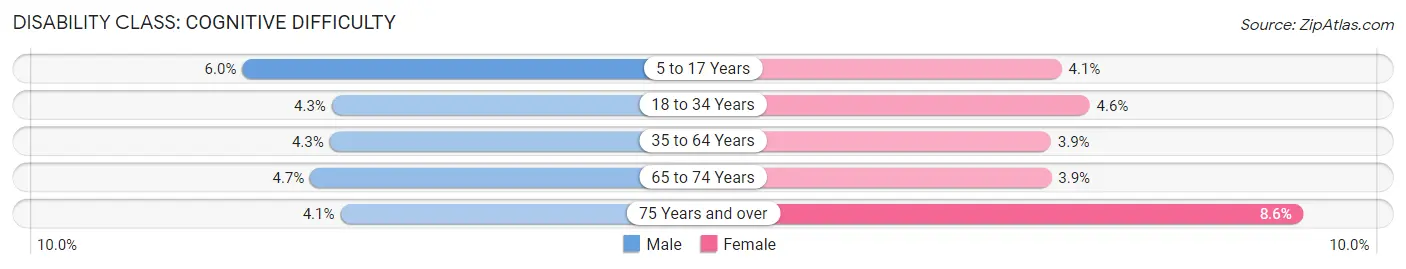
| Age Bracket | Male | Female |
| 5 to 17 Years | 57 (6.0%) | 33 (4.1%) |
| 18 to 34 Years | 44 (4.3%) | 44 (4.6%) |
| 35 to 64 Years | 92 (4.3%) | 88 (3.9%) |
| 65 to 74 Years | 35 (4.7%) | 30 (3.9%) |
| 75 Years and over | 18 (4.1%) | 54 (8.6%) |
Disability Class: Ambulatory Difficulty
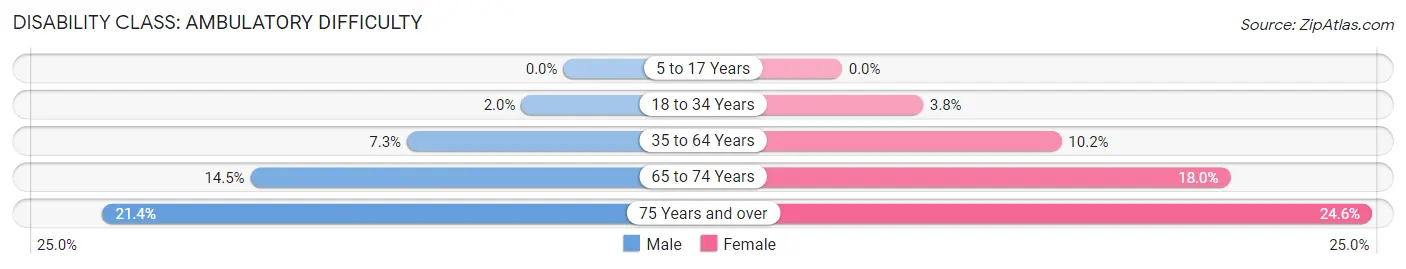
| Age Bracket | Male | Female |
| 5 to 17 Years | 0 (0.0%) | 0 (0.0%) |
| 18 to 34 Years | 20 (1.9%) | 36 (3.8%) |
| 35 to 64 Years | 154 (7.3%) | 231 (10.2%) |
| 65 to 74 Years | 108 (14.5%) | 139 (18.0%) |
| 75 Years and over | 93 (21.4%) | 155 (24.6%) |
Disability Class: Self-Care Difficulty
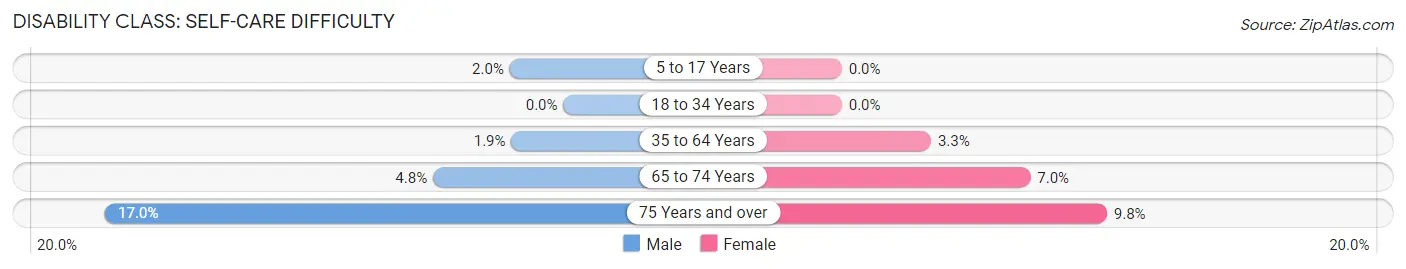
| Age Bracket | Male | Female |
| 5 to 17 Years | 19 (2.0%) | 0 (0.0%) |
| 18 to 34 Years | 0 (0.0%) | 0 (0.0%) |
| 35 to 64 Years | 41 (1.9%) | 75 (3.3%) |
| 65 to 74 Years | 36 (4.8%) | 54 (7.0%) |
| 75 Years and over | 74 (17.0%) | 62 (9.8%) |
Technology Access in Decatur County
Computing Device Access in Decatur County
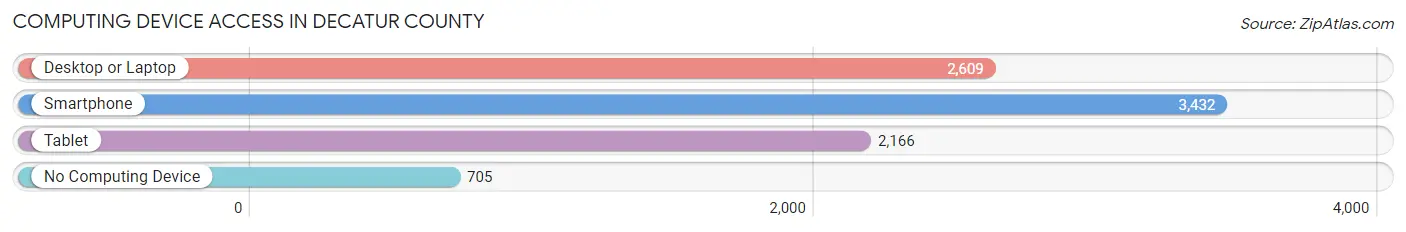
| Device Type | # Households | % Households |
| Desktop or Laptop | 2,609 | 59.8% |
| Smartphone | 3,432 | 78.7% |
| Tablet | 2,166 | 49.6% |
| No Computing Device | 705 | 16.2% |
| Total | 4,363 | 100.0% |
Internet Access in Decatur County
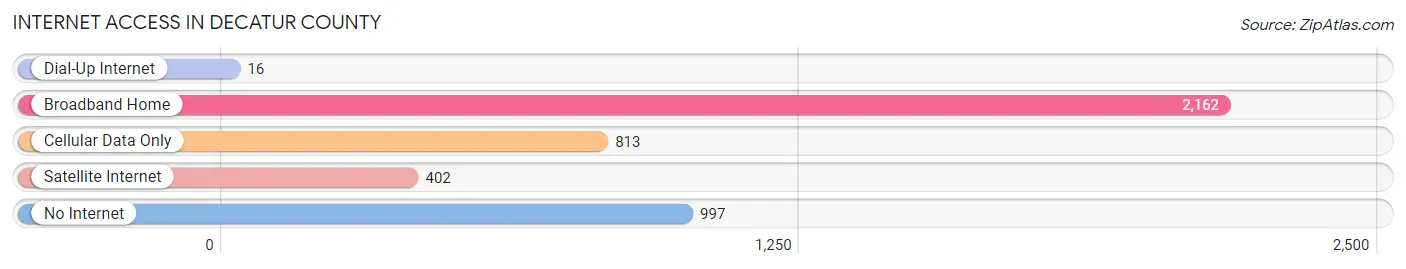
| Internet Type | # Households | % Households |
| Dial-Up Internet | 16 | 0.4% |
| Broadband Home | 2,162 | 49.5% |
| Cellular Data Only | 813 | 18.6% |
| Satellite Internet | 402 | 9.2% |
| No Internet | 997 | 22.9% |
| Total | 4,363 | 100.0% |
Decatur County Summary
Decatur County is located in the state of Tennessee, in the United States of America. It is situated in the western part of the state, and is bordered by the states of Kentucky and Mississippi. The county seat is Decaturville, and the county has a total area of 517 square miles. As of the 2010 census, the population of Decatur County was 11,757.
Decatur County was established in 1845, and was named after Commodore Stephen Decatur, a naval hero of the War of 1812. The county was formed from parts of Henderson, Perry, and Hardin counties. The county was originally part of the Chickasaw Nation, and was later part of the Western District of Tennessee.
Geography
Decatur County is located in the western part of Tennessee, and is bordered by the states of Kentucky and Mississippi. The county has a total area of 517 square miles, and is mostly rural. The terrain is mostly flat, with some rolling hills in the northern part of the county. The county is drained by the Tennessee River, which forms the western border of the county. The county is also home to several small lakes, including Beech Lake, Big Sandy Lake, and Little Sandy Lake.
The climate of Decatur County is humid subtropical, with hot, humid summers and mild winters. The average annual temperature is around 63°F, and the average annual precipitation is around 45 inches.
Economy
The economy of Decatur County is largely based on agriculture. The county is home to several large farms, and the main crops grown in the county are corn, soybeans, cotton, and wheat. The county is also home to several small businesses, including restaurants, retail stores, and service providers.
The county is also home to several manufacturing companies, including a furniture factory, a plastics factory, and a paper mill. The county is also home to several energy companies, including a coal mine and a natural gas plant.
Demographics
As of the 2010 census, the population of Decatur County was 11,757. The population is mostly white (94.3%), with small percentages of African American (3.3%), Hispanic (1.2%), and Asian (0.5%) residents. The median household income in the county is $37,845, and the median age is 41.
The county is home to several small towns, including Decaturville, Parsons, and Scotts Hill. The county seat is Decaturville, and the largest city in the county is Parsons, with a population of 2,845.
Conclusion
Decatur County is a rural county located in the western part of Tennessee. The county is home to several small towns, and the economy is largely based on agriculture. The population of the county is mostly white, and the median household income is around $37,845. The county is home to several small businesses, manufacturing companies, and energy companies.
Common Questions
What is Per Capita Income in Decatur County?
Per Capita income in Decatur County is $27,578.
What is the Median Family Income in Decatur County?
Median Family Income in Decatur County is $63,795.
What is the Median Household income in Decatur County?
Median Household Income in Decatur County is $48,466.
What is Income or Wage Gap in Decatur County?
Income or Wage Gap in Decatur County is 25.8%.
Women in Decatur County earn 74.2 cents for every dollar earned by a man.
What is Family Income Deficit in Decatur County?
Family Income Deficit in Decatur County is $10,237.
Families that are below poverty line in Decatur County earn $10,237 less on average than the poverty threshold level.
What is Inequality or Gini Index in Decatur County?
Inequality or Gini Index in Decatur County is 0.49.
What is the Total Population of Decatur County?
Total Population of Decatur County is 11,483.
What is the Total Male Population of Decatur County?
Total Male Population of Decatur County is 5,661.
What is the Total Female Population of Decatur County?
Total Female Population of Decatur County is 5,822.
What is the Ratio of Males per 100 Females in Decatur County?
There are 97.23 Males per 100 Females in Decatur County.
What is the Ratio of Females per 100 Males in Decatur County?
There are 102.84 Females per 100 Males in Decatur County.
What is the Median Population Age in Decatur County?
Median Population Age in Decatur County is 45.8 Years.
What is the Average Family Size in Decatur County
Average Family Size in Decatur County is 3.1 People.
What is the Average Household Size in Decatur County
Average Household Size in Decatur County is 2.6 People.
How Large is the Labor Force in Decatur County?
There are 4,795 People in the Labor Forcein in Decatur County.
What is the Percentage of People in the Labor Force in Decatur County?
50.8% of People are in the Labor Force in Decatur County.
What is the Unemployment Rate in Decatur County?
Unemployment Rate in Decatur County is 7.9%.