Crockett County, TN Map & Demographics
Crockett County Map
Crockett County Overview
$30,362
PER CAPITA INCOME
$71,375
AVG FAMILY INCOME
$59,136
AVG HOUSEHOLD INCOME
19.6%
WAGE / INCOME GAP [ % ]
80.4¢/ $1
WAGE / INCOME GAP [ $ ]
$8,952
FAMILY INCOME DEFICIT
0.44
INEQUALITY / GINI INDEX
13,955
TOTAL POPULATION
6,853
MALE POPULATION
7,102
FEMALE POPULATION
96.49
MALES / 100 FEMALES
103.63
FEMALES / 100 MALES
40.2
MEDIAN AGE
3.0
AVG FAMILY SIZE
2.5
AVG HOUSEHOLD SIZE
6,713
LABOR FORCE [ PEOPLE ]
61.1%
PERCENT IN LABOR FORCE
3.8%
UNEMPLOYMENT RATE
Crockett County Area Codes
Income in Crockett County
Income Overview in Crockett County
Per Capita Income in Crockett County is $30,362, while median incomes of families and households are $71,375 and $59,136 respectively.
| Characteristic | Number | Measure |
| Per Capita Income | 13,955 | $30,362 |
| Median Family Income | 3,878 | $71,375 |
| Mean Family Income | 3,878 | $85,418 |
| Median Household Income | 5,409 | $59,136 |
| Mean Household Income | 5,409 | $75,827 |
| Income Deficit | 3,878 | $8,952 |
| Wage / Income Gap (%) | 13,955 | 19.57% |
| Wage / Income Gap ($) | 13,955 | 80.43¢ per $1 |
| Gini / Inequality Index | 13,955 | 0.44 |
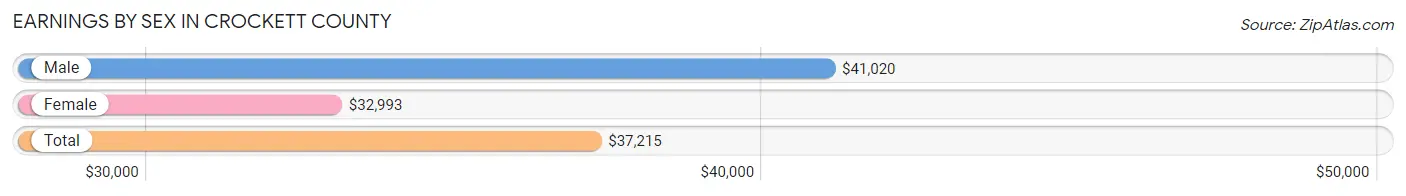
Earnings by Sex in Crockett County
Average Earnings in Crockett County are $37,215, $41,020 for men and $32,993 for women, a difference of 19.6%.
| Sex | Number | Average Earnings |
| Male | 3,588 (51.3%) | $41,020 |
| Female | 3,410 (48.7%) | $32,993 |
| Total | 6,998 (100.0%) | $37,215 |
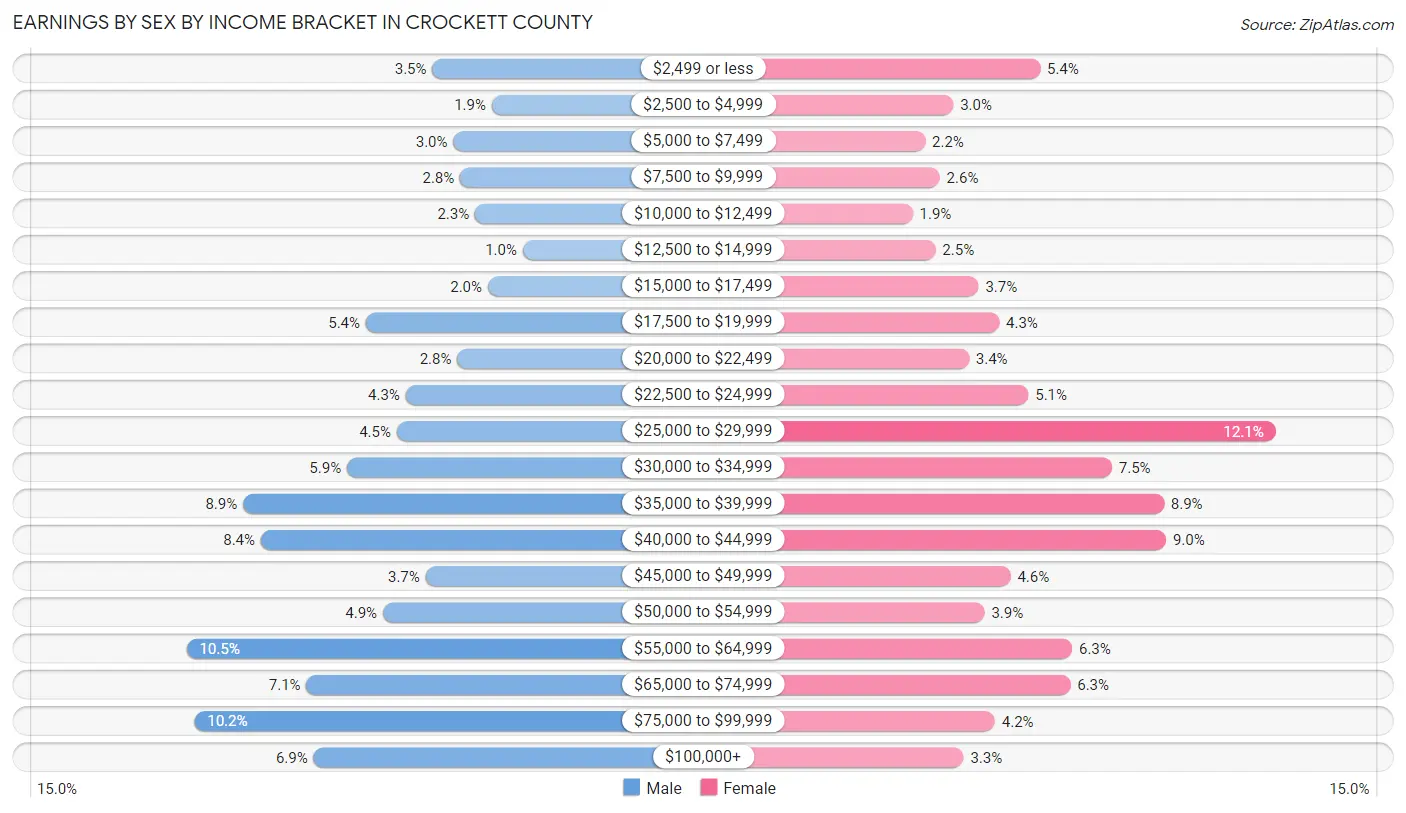
Earnings by Sex by Income Bracket in Crockett County
The most common earnings brackets in Crockett County are $55,000 to $64,999 for men (375 | 10.4%) and $25,000 to $29,999 for women (411 | 12.0%).
| Income | Male | Female |
| $2,499 or less | 127 (3.5%) | 185 (5.4%) |
| $2,500 to $4,999 | 67 (1.9%) | 102 (3.0%) |
| $5,000 to $7,499 | 106 (2.9%) | 75 (2.2%) |
| $7,500 to $9,999 | 99 (2.8%) | 89 (2.6%) |
| $10,000 to $12,499 | 84 (2.3%) | 63 (1.8%) |
| $12,500 to $14,999 | 36 (1.0%) | 85 (2.5%) |
| $15,000 to $17,499 | 71 (2.0%) | 126 (3.7%) |
| $17,500 to $19,999 | 194 (5.4%) | 146 (4.3%) |
| $20,000 to $22,499 | 102 (2.8%) | 117 (3.4%) |
| $22,500 to $24,999 | 154 (4.3%) | 174 (5.1%) |
| $25,000 to $29,999 | 163 (4.5%) | 411 (12.0%) |
| $30,000 to $34,999 | 213 (5.9%) | 254 (7.4%) |
| $35,000 to $39,999 | 318 (8.9%) | 304 (8.9%) |
| $40,000 to $44,999 | 300 (8.4%) | 306 (9.0%) |
| $45,000 to $49,999 | 134 (3.7%) | 157 (4.6%) |
| $50,000 to $54,999 | 177 (4.9%) | 132 (3.9%) |
| $55,000 to $64,999 | 375 (10.4%) | 216 (6.3%) |
| $65,000 to $74,999 | 254 (7.1%) | 214 (6.3%) |
| $75,000 to $99,999 | 367 (10.2%) | 142 (4.2%) |
| $100,000+ | 247 (6.9%) | 112 (3.3%) |
| Total | 3,588 (100.0%) | 3,410 (100.0%) |
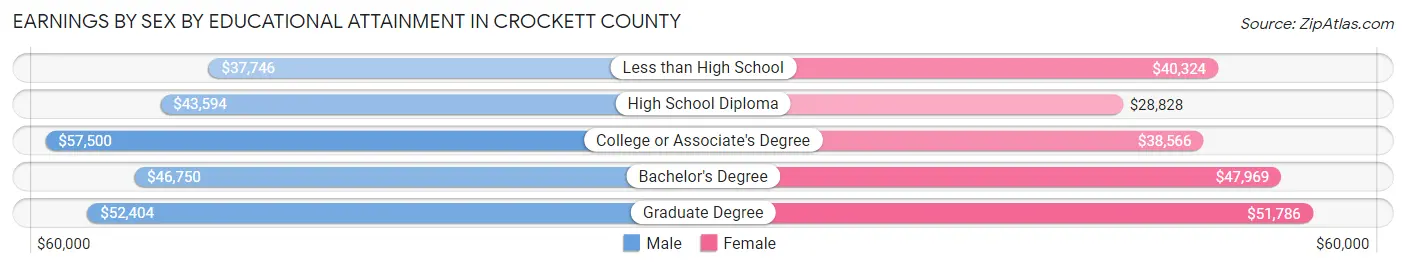
Earnings by Sex by Educational Attainment in Crockett County
Average earnings in Crockett County are $44,485 for men and $36,279 for women, a difference of 18.4%. Men with an educational attainment of college or associate's degree enjoy the highest average annual earnings of $57,500, while those with less than high school education earn the least with $37,746. Women with an educational attainment of graduate degree earn the most with the average annual earnings of $51,786, while those with high school diploma education have the smallest earnings of $28,828.
| Educational Attainment | Male Income | Female Income |
| Less than High School | $37,746 | $40,324 |
| High School Diploma | $43,594 | $28,828 |
| College or Associate's Degree | $57,500 | $38,566 |
| Bachelor's Degree | $46,750 | $47,969 |
| Graduate Degree | $52,404 | $51,786 |
| Total | $44,485 | $36,279 |
Family Income in Crockett County
Family Income Brackets in Crockett County
According to the Crockett County family income data, there are 853 families falling into the $100,000 to $149,999 income range, which is the most common income bracket and makes up 22.0% of all families. Conversely, the less than $10,000 income bracket is the least frequent group with only 50 families (1.3%) belonging to this category.
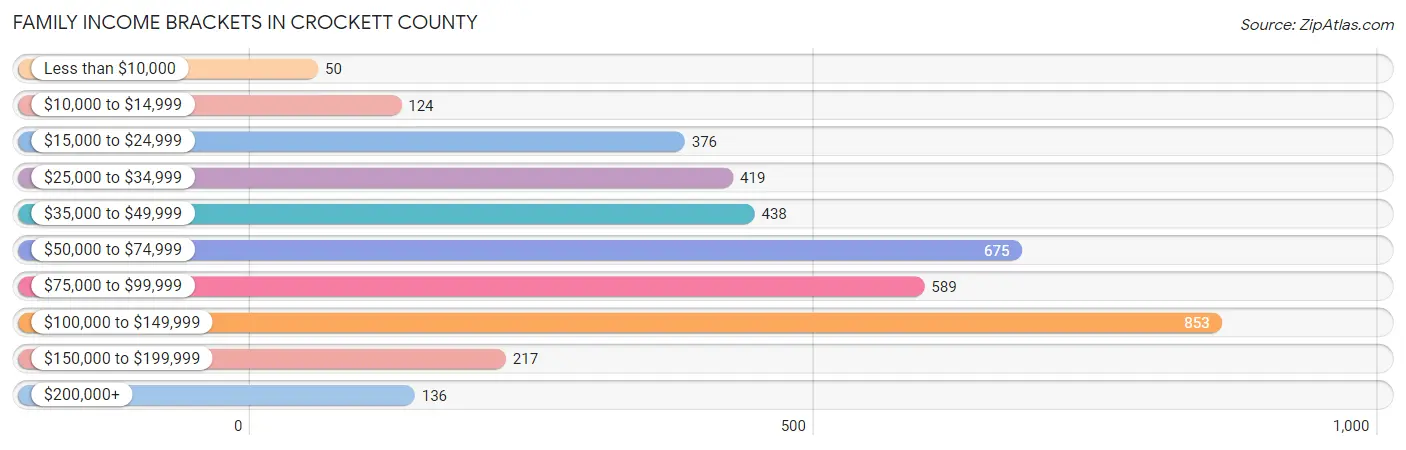
| Income Bracket | # Families | % Families |
| Less than $10,000 | 50 | 1.3% |
| $10,000 to $14,999 | 124 | 3.2% |
| $15,000 to $24,999 | 376 | 9.7% |
| $25,000 to $34,999 | 419 | 10.8% |
| $35,000 to $49,999 | 438 | 11.3% |
| $50,000 to $74,999 | 675 | 17.4% |
| $75,000 to $99,999 | 589 | 15.2% |
| $100,000 to $149,999 | 853 | 22.0% |
| $150,000 to $199,999 | 217 | 5.6% |
| $200,000+ | 136 | 3.5% |
Family Income by Famaliy Size in Crockett County
6-person families (44 | 1.1%) account for the highest median family income in Crockett County with $142,625 per family, while 2-person families (1,799 | 46.4%) have the highest median income of $32,696 per family member.
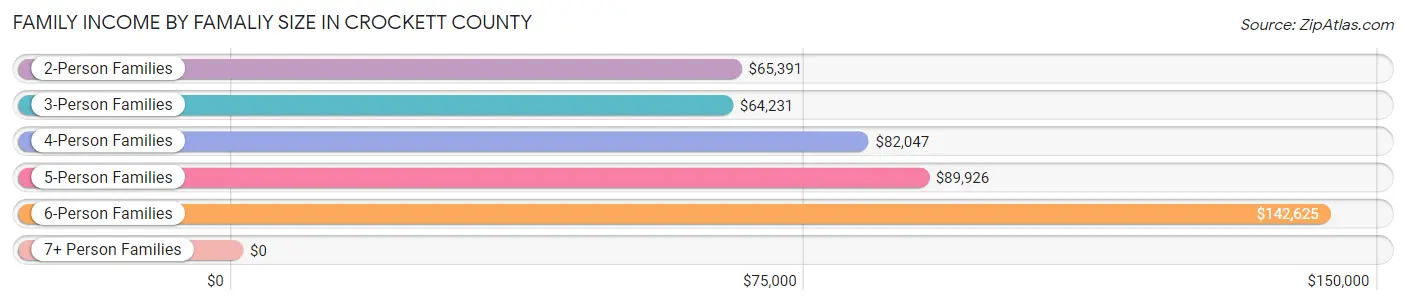
| Income Bracket | # Families | Median Income |
| 2-Person Families | 1,799 (46.4%) | $65,391 |
| 3-Person Families | 1,054 (27.2%) | $64,231 |
| 4-Person Families | 683 (17.6%) | $82,047 |
| 5-Person Families | 233 (6.0%) | $89,926 |
| 6-Person Families | 44 (1.1%) | $142,625 |
| 7+ Person Families | 65 (1.7%) | $0 |
| Total | 3,878 (100.0%) | $71,375 |
Family Income by Number of Earners in Crockett County
The median family income in Crockett County is $71,375, with families comprising 3+ earners (353) having the highest median family income of $113,750, while families with no earners (685) have the lowest median family income of $33,287, accounting for 9.1% and 17.7% of families, respectively.
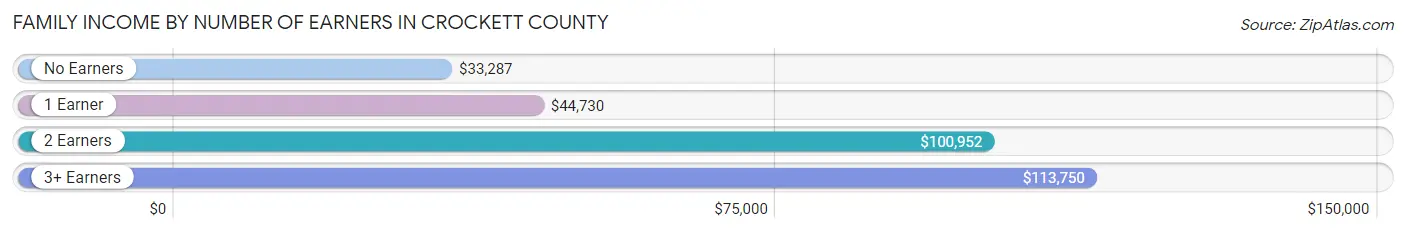
| Number of Earners | # Families | Median Income |
| No Earners | 685 (17.7%) | $33,287 |
| 1 Earner | 1,428 (36.8%) | $44,730 |
| 2 Earners | 1,412 (36.4%) | $100,952 |
| 3+ Earners | 353 (9.1%) | $113,750 |
| Total | 3,878 (100.0%) | $71,375 |
Household Income in Crockett County
Household Income Brackets in Crockett County
With 979 households falling in the category, the $50,000 to $74,999 income range is the most frequent in Crockett County, accounting for 18.1% of all households. In contrast, only 151 households (2.8%) fall into the $200,000+ income bracket, making it the least populous group.
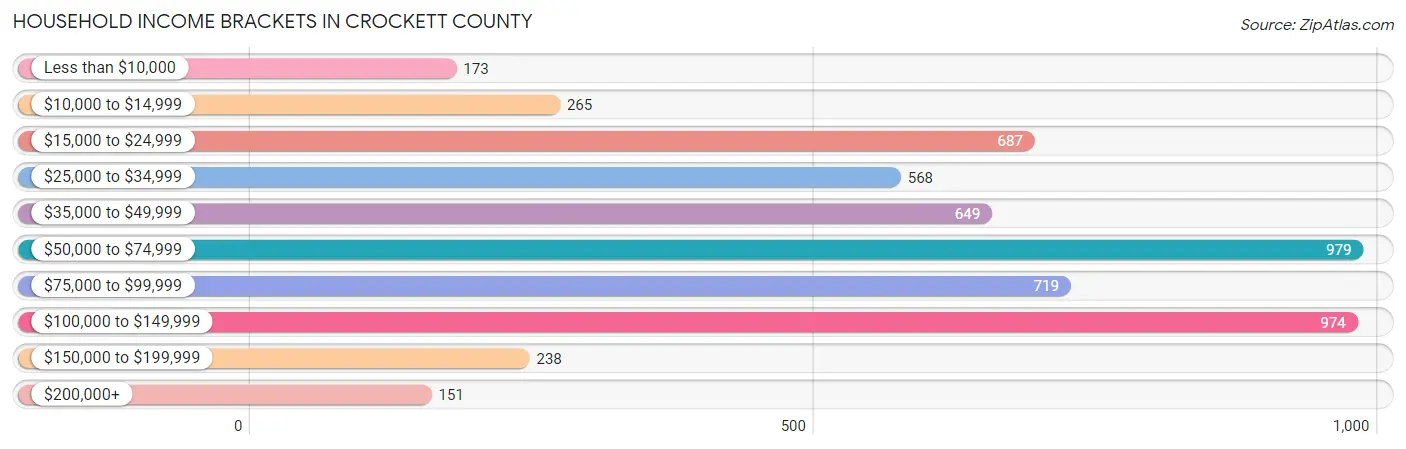
| Income Bracket | # Households | % Households |
| Less than $10,000 | 173 | 3.2% |
| $10,000 to $14,999 | 265 | 4.9% |
| $15,000 to $24,999 | 687 | 12.7% |
| $25,000 to $34,999 | 568 | 10.5% |
| $35,000 to $49,999 | 649 | 12.0% |
| $50,000 to $74,999 | 979 | 18.1% |
| $75,000 to $99,999 | 719 | 13.3% |
| $100,000 to $149,999 | 974 | 18.0% |
| $150,000 to $199,999 | 238 | 4.4% |
| $200,000+ | 151 | 2.8% |
Household Income by Householder Age in Crockett County
The median household income in Crockett County is $59,136, with the highest median household income of $79,744 found in the 45 to 64 years age bracket for the primary householder. A total of 2,017 households (37.3%) fall into this category. Meanwhile, the 15 to 24 years age bracket for the primary householder has the lowest median household income of $36,615, with 257 households (4.8%) in this group.
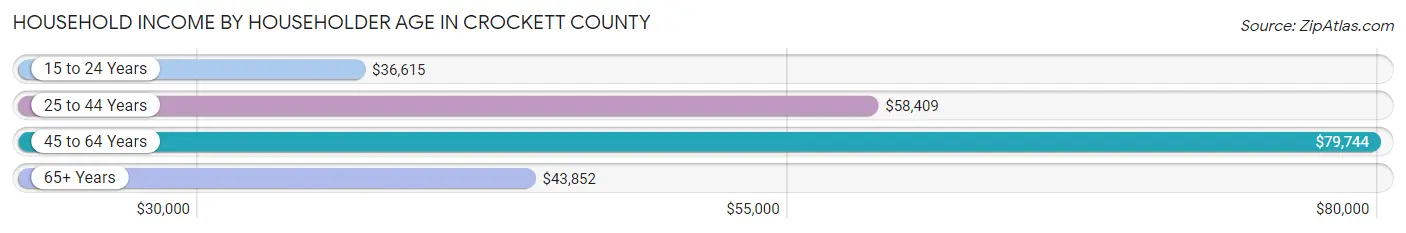
| Income Bracket | # Households | Median Income |
| 15 to 24 Years | 257 (4.8%) | $36,615 |
| 25 to 44 Years | 1,556 (28.8%) | $58,409 |
| 45 to 64 Years | 2,017 (37.3%) | $79,744 |
| 65+ Years | 1,579 (29.2%) | $43,852 |
| Total | 5,409 (100.0%) | $59,136 |
Poverty in Crockett County
Income Below Poverty by Sex and Age in Crockett County
With 15.2% poverty level for males and 16.0% for females among the residents of Crockett County, 5 year old males and 5 year old females are the most vulnerable to poverty, with 29 males (78.4%) and 54 females (51.9%) in their respective age groups living below the poverty level.
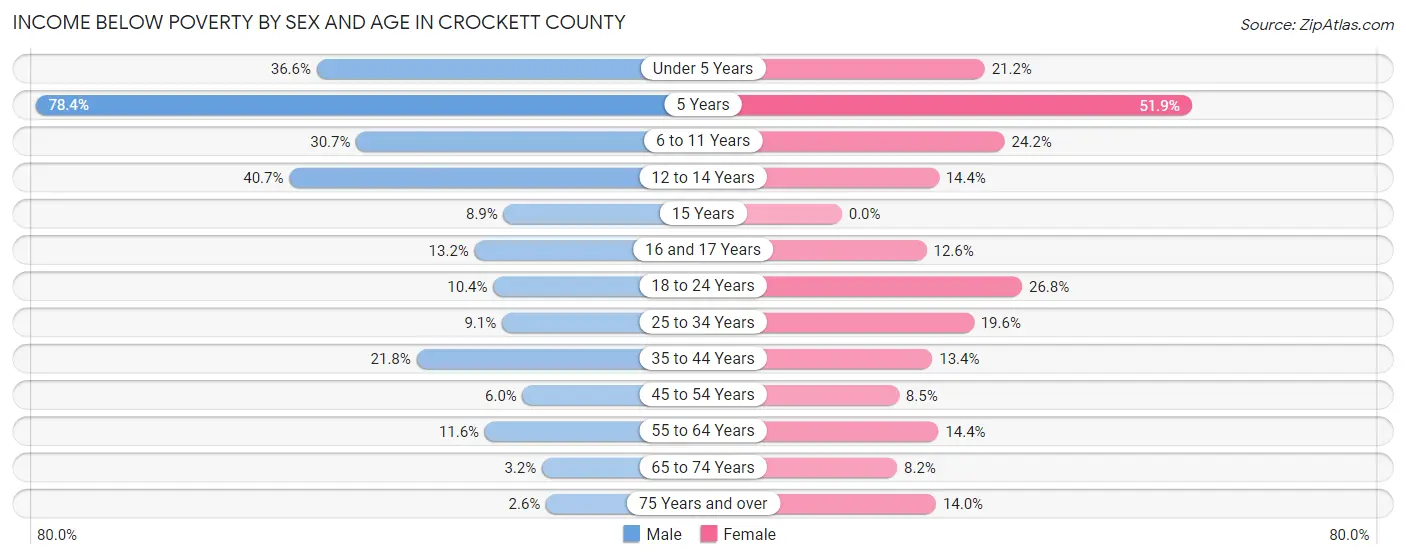
| Age Bracket | Male | Female |
| Under 5 Years | 186 (36.6%) | 66 (21.2%) |
| 5 Years | 29 (78.4%) | 54 (51.9%) |
| 6 to 11 Years | 182 (30.7%) | 126 (24.2%) |
| 12 to 14 Years | 116 (40.7%) | 57 (14.4%) |
| 15 Years | 11 (8.9%) | 0 (0.0%) |
| 16 and 17 Years | 22 (13.2%) | 20 (12.6%) |
| 18 to 24 Years | 61 (10.4%) | 159 (26.8%) |
| 25 to 34 Years | 76 (9.1%) | 171 (19.6%) |
| 35 to 44 Years | 161 (21.8%) | 111 (13.4%) |
| 45 to 54 Years | 50 (6.0%) | 70 (8.5%) |
| 55 to 64 Years | 103 (11.6%) | 138 (14.3%) |
| 65 to 74 Years | 25 (3.2%) | 57 (8.2%) |
| 75 Years and over | 10 (2.5%) | 86 (14.0%) |
| Total | 1,032 (15.2%) | 1,115 (16.0%) |
Income Above Poverty by Sex and Age in Crockett County
According to the poverty statistics in Crockett County, males aged 75 years and over and females aged 15 years are the age groups that are most secure financially, with 97.5% of males and 100.0% of females in these age groups living above the poverty line.
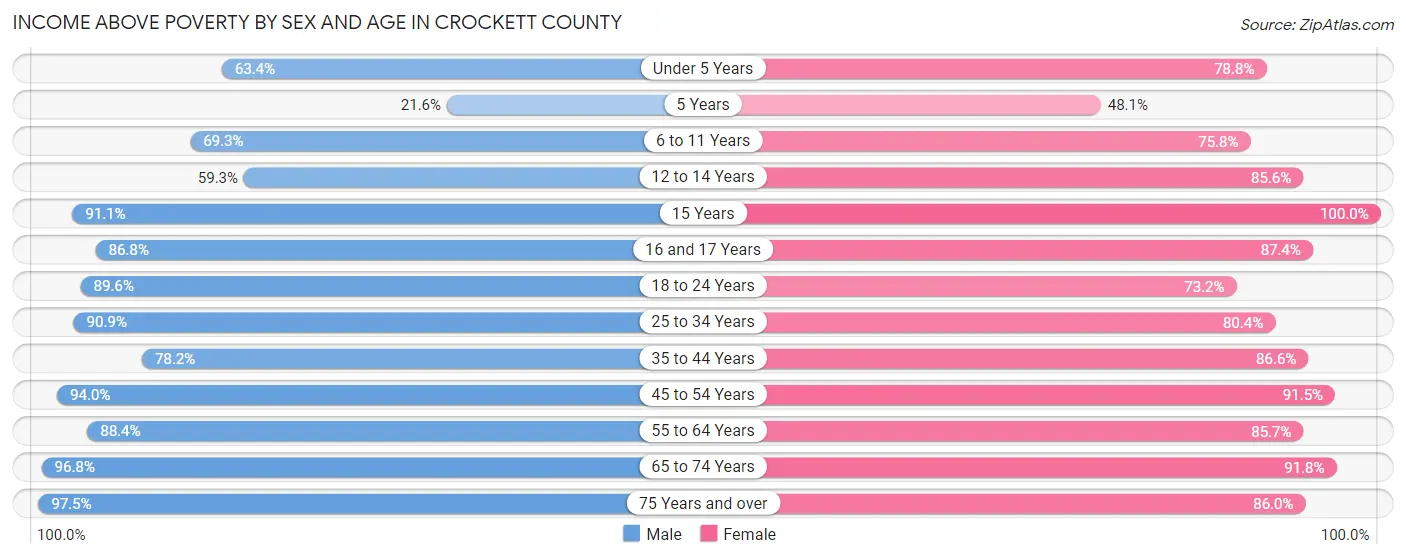
| Age Bracket | Male | Female |
| Under 5 Years | 322 (63.4%) | 245 (78.8%) |
| 5 Years | 8 (21.6%) | 50 (48.1%) |
| 6 to 11 Years | 410 (69.3%) | 395 (75.8%) |
| 12 to 14 Years | 169 (59.3%) | 339 (85.6%) |
| 15 Years | 113 (91.1%) | 88 (100.0%) |
| 16 and 17 Years | 145 (86.8%) | 139 (87.4%) |
| 18 to 24 Years | 526 (89.6%) | 435 (73.2%) |
| 25 to 34 Years | 759 (90.9%) | 702 (80.4%) |
| 35 to 44 Years | 578 (78.2%) | 715 (86.6%) |
| 45 to 54 Years | 778 (94.0%) | 755 (91.5%) |
| 55 to 64 Years | 782 (88.4%) | 824 (85.7%) |
| 65 to 74 Years | 765 (96.8%) | 637 (91.8%) |
| 75 Years and over | 382 (97.5%) | 529 (86.0%) |
| Total | 5,737 (84.8%) | 5,853 (84.0%) |
Income Below Poverty Among Married-Couple Families in Crockett County
The poverty statistics for married-couple families in Crockett County show that 4.6% or 126 of the total 2,727 families live below the poverty line. Families with 5 or more children have the highest poverty rate of 42.4%, comprising of 14 families. On the other hand, families with no children have the lowest poverty rate of 2.2%, which includes 37 families.
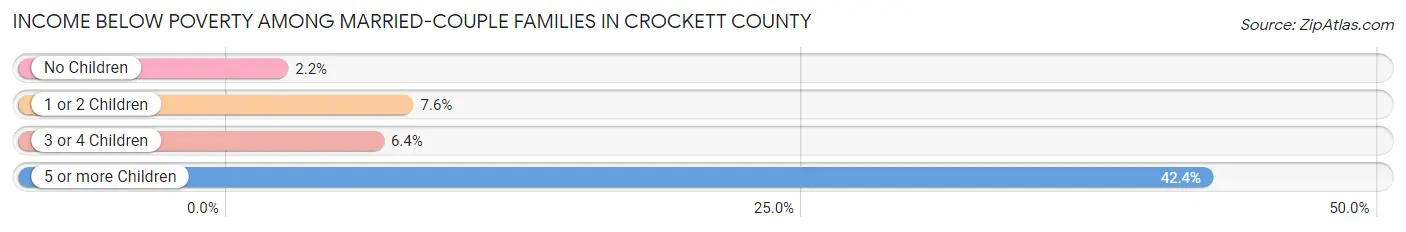
| Children | Above Poverty | Below Poverty |
| No Children | 1,654 (97.8%) | 37 (2.2%) |
| 1 or 2 Children | 810 (92.4%) | 67 (7.6%) |
| 3 or 4 Children | 118 (93.6%) | 8 (6.4%) |
| 5 or more Children | 19 (57.6%) | 14 (42.4%) |
| Total | 2,601 (95.4%) | 126 (4.6%) |
Income Below Poverty Among Single-Parent Households in Crockett County
According to the poverty data in Crockett County, 39.5% or 132 single-father households and 28.8% or 235 single-mother households are living below the poverty line. Among single-father households, those with 5 or more children have the highest poverty rate, with 14 households (100.0%) experiencing poverty. Likewise, among single-mother households, those with 3 or 4 children have the highest poverty rate, with 114 households (90.5%) falling below the poverty line.
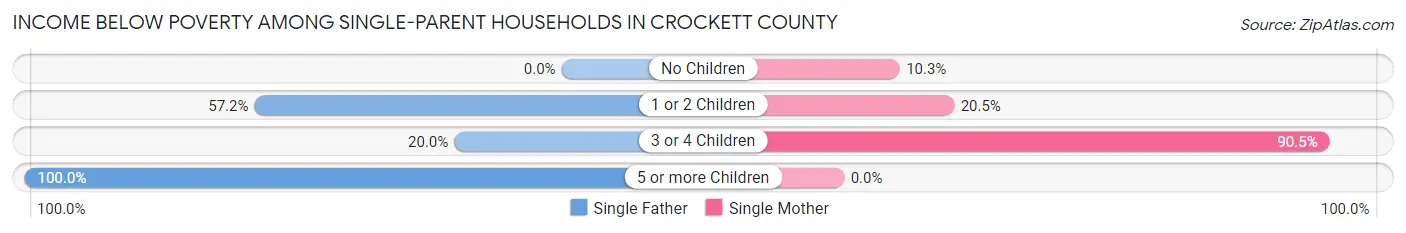
| Children | Single Father | Single Mother |
| No Children | 0 (0.0%) | 21 (10.3%) |
| 1 or 2 Children | 111 (57.2%) | 100 (20.5%) |
| 3 or 4 Children | 7 (20.0%) | 114 (90.5%) |
| 5 or more Children | 14 (100.0%) | 0 (0.0%) |
| Total | 132 (39.5%) | 235 (28.8%) |
Income Below Poverty Among Married-Couple vs Single-Parent Households in Crockett County
The poverty data for Crockett County shows that 126 of the married-couple family households (4.6%) and 367 of the single-parent households (31.9%) are living below the poverty level. Within the married-couple family households, those with 5 or more children have the highest poverty rate, with 14 households (42.4%) falling below the poverty line. Among the single-parent households, those with 5 or more children have the highest poverty rate, with 14 household (100.0%) living below poverty.
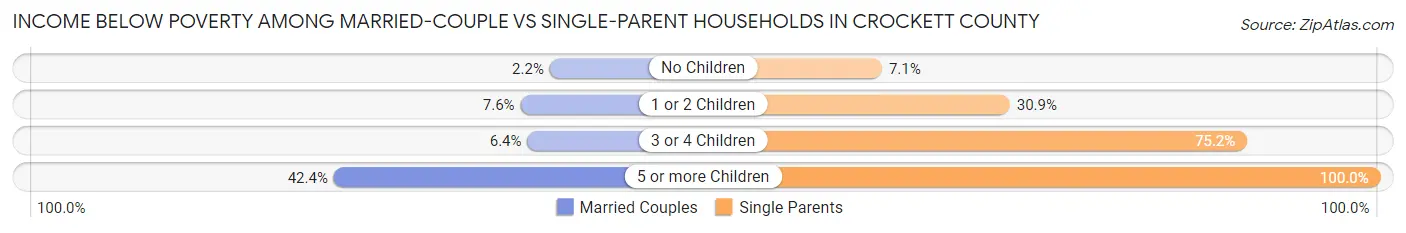
| Children | Married-Couple Families | Single-Parent Households |
| No Children | 37 (2.2%) | 21 (7.1%) |
| 1 or 2 Children | 67 (7.6%) | 211 (30.9%) |
| 3 or 4 Children | 8 (6.4%) | 121 (75.2%) |
| 5 or more Children | 14 (42.4%) | 14 (100.0%) |
| Total | 126 (4.6%) | 367 (31.9%) |
Race in Crockett County
The most populous races in Crockett County are White / Caucasian (10,419 | 74.7%), Hispanic or Latino (1,610 | 11.5%), and Black / African American (1,544 | 11.1%).
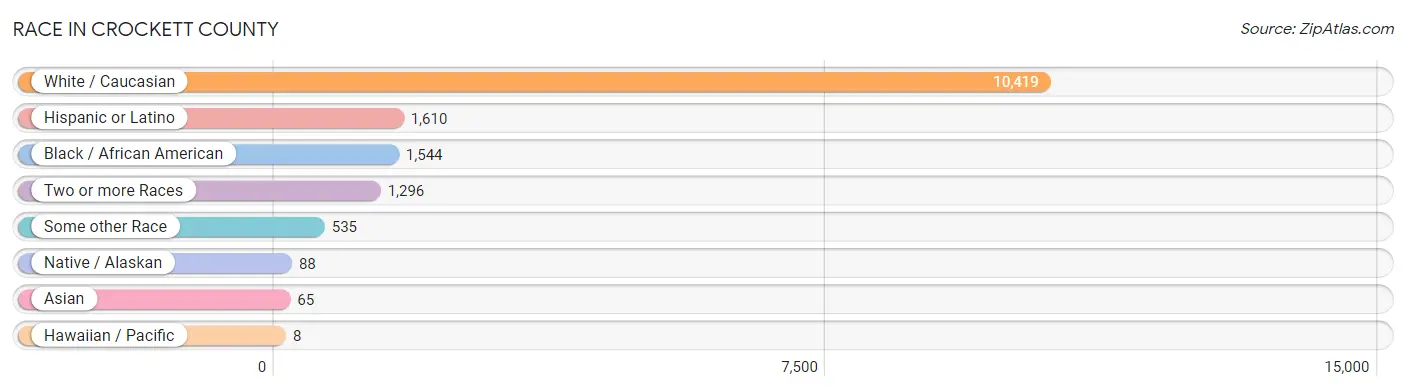
| Race | # Population | % Population |
| Asian | 65 | 0.5% |
| Black / African American | 1,544 | 11.1% |
| Hawaiian / Pacific | 8 | 0.1% |
| Hispanic or Latino | 1,610 | 11.5% |
| Native / Alaskan | 88 | 0.6% |
| White / Caucasian | 10,419 | 74.7% |
| Two or more Races | 1,296 | 9.3% |
| Some other Race | 535 | 3.8% |
| Total | 13,955 | 100.0% |
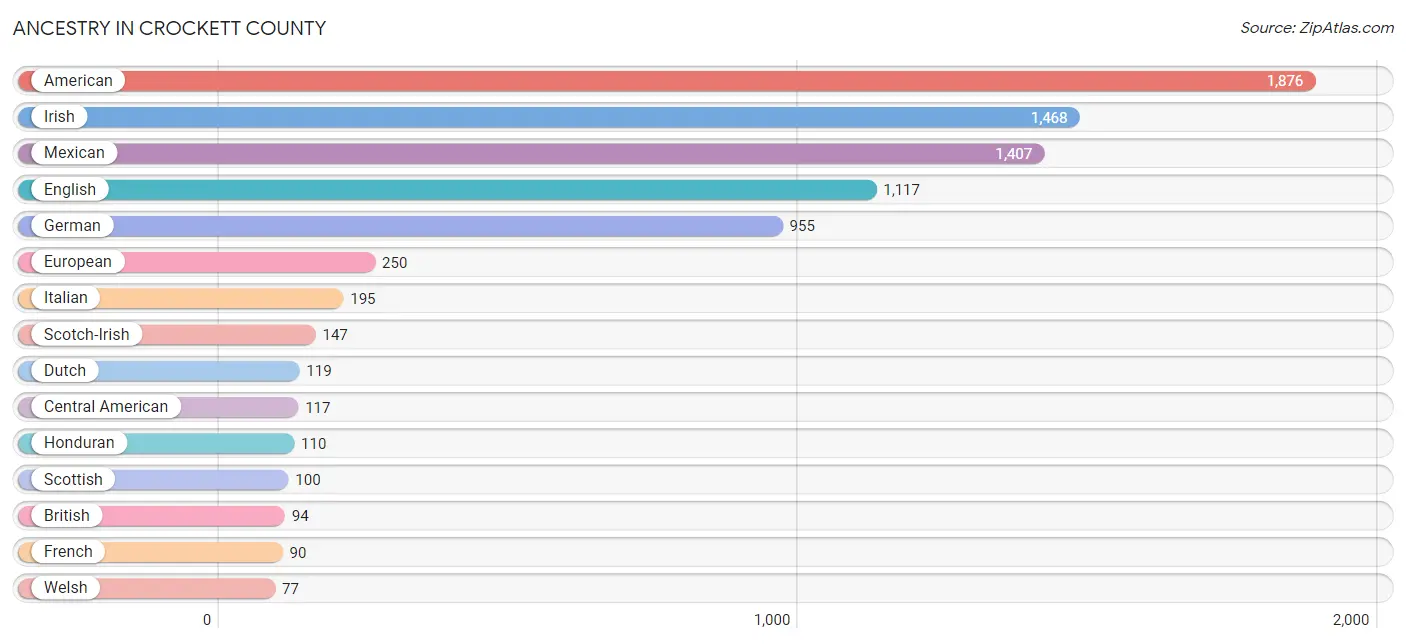
Ancestry in Crockett County
The most populous ancestries reported in Crockett County are American (1,876 | 13.4%), Irish (1,468 | 10.5%), Mexican (1,407 | 10.1%), English (1,117 | 8.0%), and German (955 | 6.8%), together accounting for 48.9% of all Crockett County residents.
| Ancestry | # Population | % Population |
| African | 16 | 0.1% |
| American | 1,876 | 13.4% |
| Austrian | 13 | 0.1% |
| Bhutanese | 11 | 0.1% |
| Blackfeet | 13 | 0.1% |
| British | 94 | 0.7% |
| Burmese | 4 | 0.0% |
| Central American | 117 | 0.8% |
| Cherokee | 71 | 0.5% |
| Cuban | 8 | 0.1% |
| Danish | 11 | 0.1% |
| Dutch | 119 | 0.9% |
| English | 1,117 | 8.0% |
| European | 250 | 1.8% |
| French | 90 | 0.6% |
| German | 955 | 6.8% |
| Guamanian / Chamorro | 15 | 0.1% |
| Honduran | 110 | 0.8% |
| Indian (Asian) | 4 | 0.0% |
| Irish | 1,468 | 10.5% |
| Italian | 195 | 1.4% |
| Korean | 14 | 0.1% |
| Mexican | 1,407 | 10.1% |
| Northern European | 3 | 0.0% |
| Norwegian | 3 | 0.0% |
| Pakistani | 6 | 0.0% |
| Polish | 52 | 0.4% |
| Puerto Rican | 32 | 0.2% |
| Russian | 26 | 0.2% |
| Salvadoran | 7 | 0.1% |
| Samoan | 4 | 0.0% |
| Scandinavian | 30 | 0.2% |
| Scotch-Irish | 147 | 1.1% |
| Scottish | 100 | 0.7% |
| South American | 8 | 0.1% |
| Spanish | 31 | 0.2% |
| Sri Lankan | 17 | 0.1% |
| Subsaharan African | 16 | 0.1% |
| Swedish | 4 | 0.0% |
| Thai | 7 | 0.1% |
| Venezuelan | 8 | 0.1% |
| Welsh | 77 | 0.5% | View All 42 Rows |
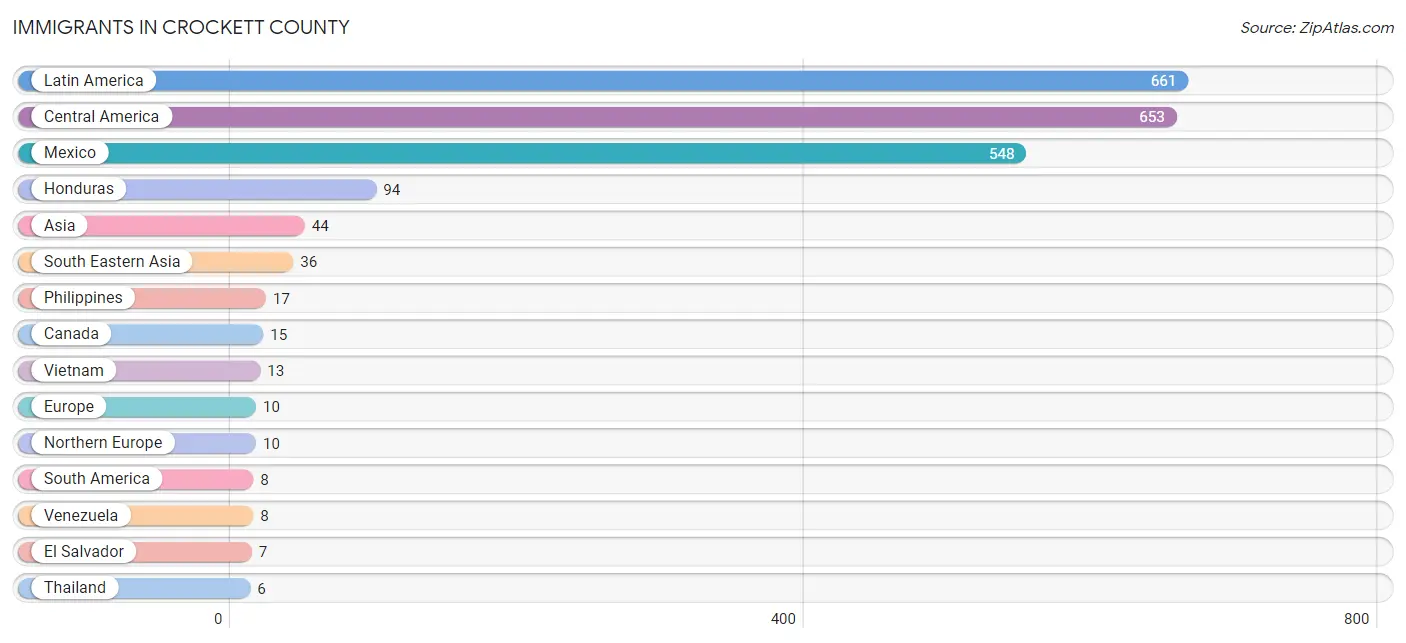
Immigrants in Crockett County
The most numerous immigrant groups reported in Crockett County came from Latin America (661 | 4.7%), Central America (653 | 4.7%), Mexico (548 | 3.9%), Honduras (94 | 0.7%), and Asia (44 | 0.3%), together accounting for 14.3% of all Crockett County residents.
| Immigration Origin | # Population | % Population |
| Asia | 44 | 0.3% |
| Canada | 15 | 0.1% |
| Central America | 653 | 4.7% |
| Eastern Asia | 4 | 0.0% |
| El Salvador | 7 | 0.1% |
| England | 4 | 0.0% |
| Europe | 10 | 0.1% |
| Guatemala | 4 | 0.0% |
| Honduras | 94 | 0.7% |
| India | 4 | 0.0% |
| Korea | 4 | 0.0% |
| Latin America | 661 | 4.7% |
| Mexico | 548 | 3.9% |
| Northern Europe | 10 | 0.1% |
| Philippines | 17 | 0.1% |
| South America | 8 | 0.1% |
| South Central Asia | 4 | 0.0% |
| South Eastern Asia | 36 | 0.3% |
| Thailand | 6 | 0.0% |
| Venezuela | 8 | 0.1% |
| Vietnam | 13 | 0.1% | View All 21 Rows |
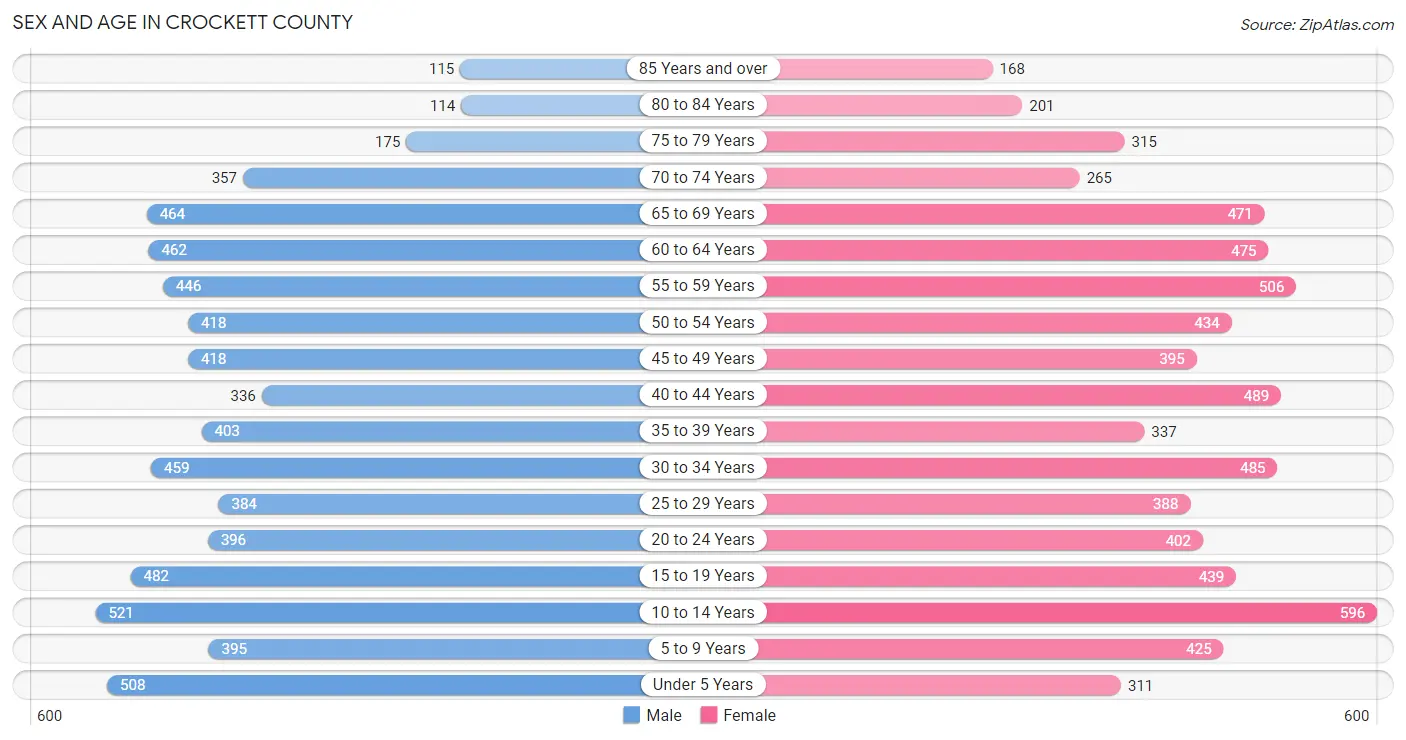
Sex and Age in Crockett County
Sex and Age in Crockett County
The most populous age groups in Crockett County are 10 to 14 Years (521 | 7.6%) for men and 10 to 14 Years (596 | 8.4%) for women.
| Age Bracket | Male | Female |
| Under 5 Years | 508 (7.4%) | 311 (4.4%) |
| 5 to 9 Years | 395 (5.8%) | 425 (6.0%) |
| 10 to 14 Years | 521 (7.6%) | 596 (8.4%) |
| 15 to 19 Years | 482 (7.0%) | 439 (6.2%) |
| 20 to 24 Years | 396 (5.8%) | 402 (5.7%) |
| 25 to 29 Years | 384 (5.6%) | 388 (5.5%) |
| 30 to 34 Years | 459 (6.7%) | 485 (6.8%) |
| 35 to 39 Years | 403 (5.9%) | 337 (4.8%) |
| 40 to 44 Years | 336 (4.9%) | 489 (6.9%) |
| 45 to 49 Years | 418 (6.1%) | 395 (5.6%) |
| 50 to 54 Years | 418 (6.1%) | 434 (6.1%) |
| 55 to 59 Years | 446 (6.5%) | 506 (7.1%) |
| 60 to 64 Years | 462 (6.7%) | 475 (6.7%) |
| 65 to 69 Years | 464 (6.8%) | 471 (6.6%) |
| 70 to 74 Years | 357 (5.2%) | 265 (3.7%) |
| 75 to 79 Years | 175 (2.5%) | 315 (4.4%) |
| 80 to 84 Years | 114 (1.7%) | 201 (2.8%) |
| 85 Years and over | 115 (1.7%) | 168 (2.4%) |
| Total | 6,853 (100.0%) | 7,102 (100.0%) |
Families and Households in Crockett County
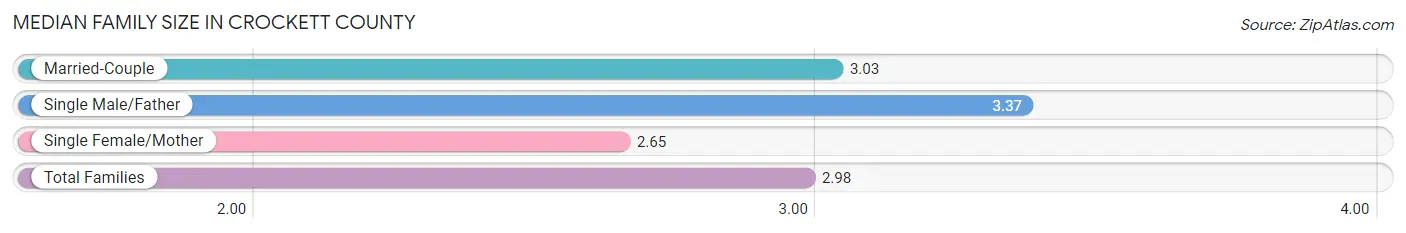
Median Family Size in Crockett County
The median family size in Crockett County is 2.98 persons per family, with single male/father families (334 | 8.6%) accounting for the largest median family size of 3.37 persons per family. On the other hand, single female/mother families (817 | 21.1%) represent the smallest median family size with 2.65 persons per family.
| Family Type | # Families | Family Size |
| Married-Couple | 2,727 (70.3%) | 3.03 |
| Single Male/Father | 334 (8.6%) | 3.37 |
| Single Female/Mother | 817 (21.1%) | 2.65 |
| Total Families | 3,878 (100.0%) | 2.98 |
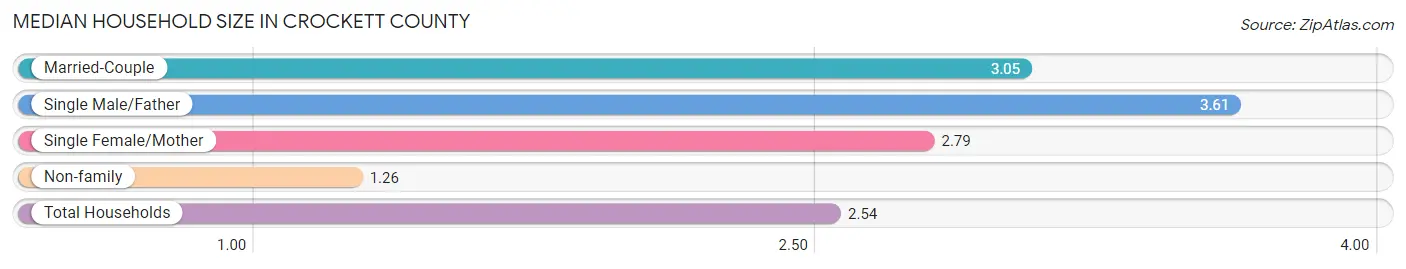
Median Household Size in Crockett County
The median household size in Crockett County is 2.54 persons per household, with single male/father households (334 | 6.2%) accounting for the largest median household size of 3.61 persons per household. non-family households (1,531 | 28.3%) represent the smallest median household size with 1.26 persons per household.
| Household Type | # Households | Household Size |
| Married-Couple | 2,727 (50.4%) | 3.05 |
| Single Male/Father | 334 (6.2%) | 3.61 |
| Single Female/Mother | 817 (15.1%) | 2.79 |
| Non-family | 1,531 (28.3%) | 1.26 |
| Total Households | 5,409 (100.0%) | 2.54 |
Household Size by Marriage Status in Crockett County
Out of a total of 5,409 households in Crockett County, 3,878 (71.7%) are family households, while 1,531 (28.3%) are nonfamily households. The most numerous type of family households are 2-person households, comprising 1,710, and the most common type of nonfamily households are 1-person households, comprising 1,193.
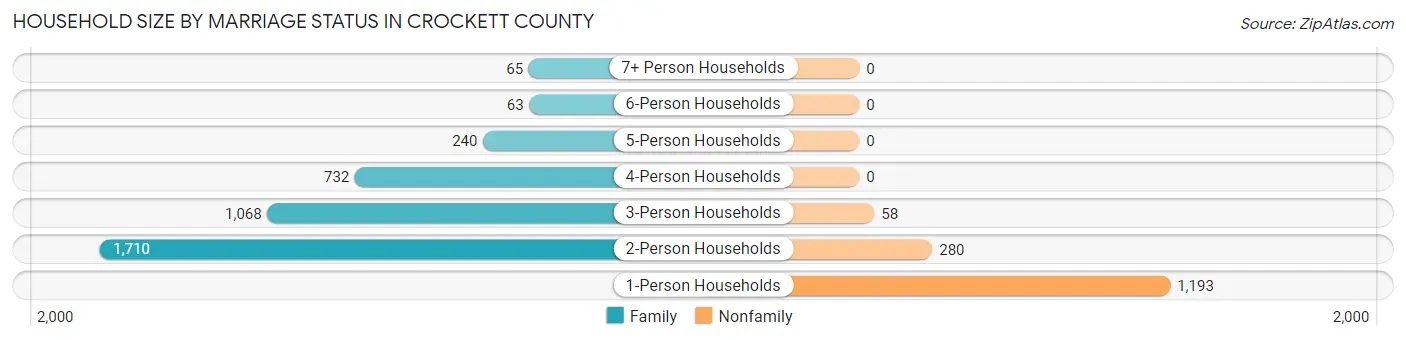
| Household Size | Family Households | Nonfamily Households |
| 1-Person Households | - | 1,193 (22.1%) |
| 2-Person Households | 1,710 (31.6%) | 280 (5.2%) |
| 3-Person Households | 1,068 (19.7%) | 58 (1.1%) |
| 4-Person Households | 732 (13.5%) | 0 (0.0%) |
| 5-Person Households | 240 (4.4%) | 0 (0.0%) |
| 6-Person Households | 63 (1.2%) | 0 (0.0%) |
| 7+ Person Households | 65 (1.2%) | 0 (0.0%) |
| Total | 3,878 (71.7%) | 1,531 (28.3%) |
Female Fertility in Crockett County
Fertility by Age in Crockett County
Average fertility rate in Crockett County is 41.0 births per 1,000 women. Women in the age bracket of 20 to 34 years have the highest fertility rate with 85.0 births per 1,000 women. Women in the age bracket of 20 to 34 years acount for 87.8% of all women with births.
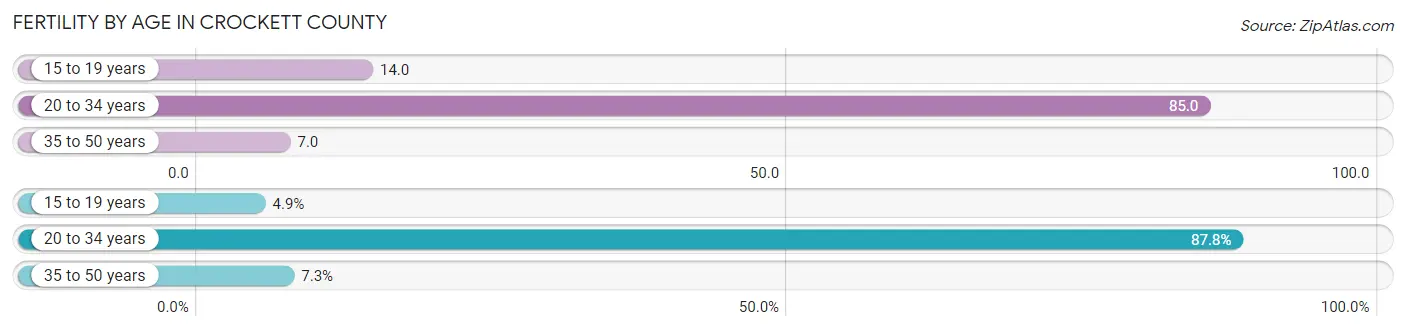
| Age Bracket | Women with Births | Births / 1,000 Women |
| 15 to 19 years | 6 (4.9%) | 14.0 |
| 20 to 34 years | 108 (87.8%) | 85.0 |
| 35 to 50 years | 9 (7.3%) | 7.0 |
| Total | 123 (100.0%) | 41.0 |
Fertility by Age by Marriage Status in Crockett County
69.1% of women with births (123) in Crockett County are married. The highest percentage of unmarried women with births falls into 15 to 19 years age bracket with 100.0% of them unmarried at the time of birth, while the lowest percentage of unmarried women with births belong to 35 to 50 years age bracket with 0.0% of them unmarried.
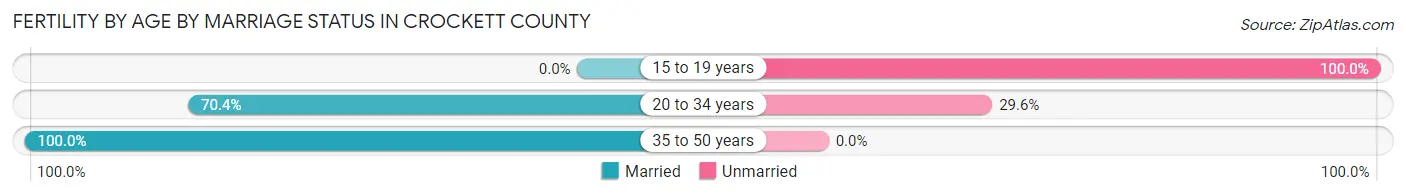
| Age Bracket | Married | Unmarried |
| 15 to 19 years | 0 (0.0%) | 6 (100.0%) |
| 20 to 34 years | 76 (70.4%) | 32 (29.6%) |
| 35 to 50 years | 9 (100.0%) | 0 (0.0%) |
| Total | 85 (69.1%) | 38 (30.9%) |
Fertility by Education in Crockett County
Average fertility rate in Crockett County is 41.0 births per 1,000 women. Women with the education attainment of graduate degree have the highest fertility rate of 66.0 births per 1,000 women, while women with the education attainment of bachelor's degree have the lowest fertility at 14.0 births per 1,000 women. Women with the education attainment of high school diploma represent 50.4% of all women with births.
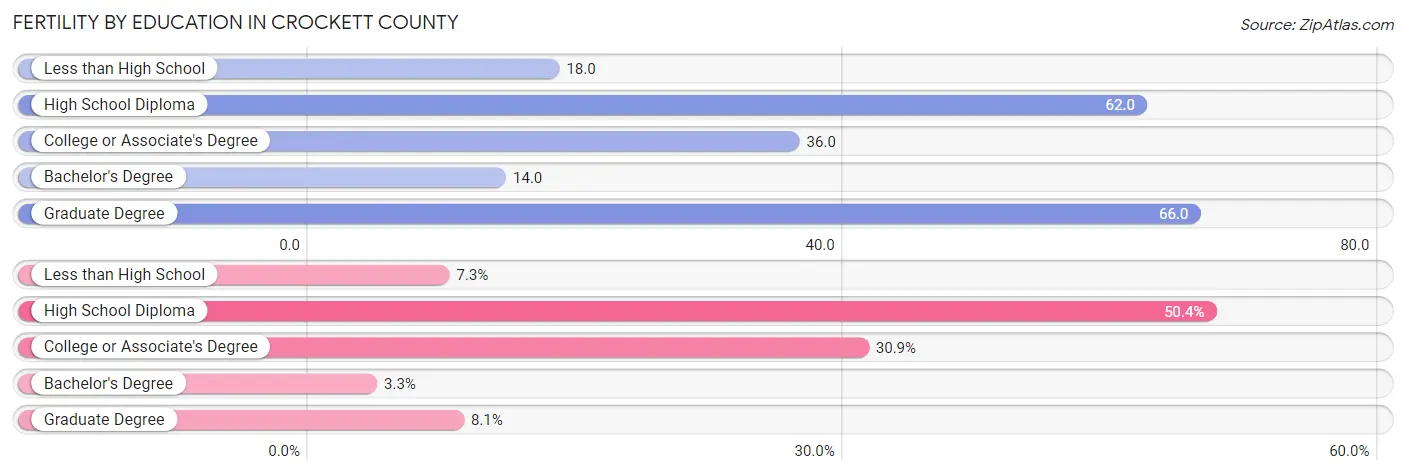
| Educational Attainment | Women with Births | Births / 1,000 Women |
| Less than High School | 9 (7.3%) | 18.0 |
| High School Diploma | 62 (50.4%) | 62.0 |
| College or Associate's Degree | 38 (30.9%) | 36.0 |
| Bachelor's Degree | 4 (3.3%) | 14.0 |
| Graduate Degree | 10 (8.1%) | 66.0 |
| Total | 123 (100.0%) | 41.0 |
Fertility by Education by Marriage Status in Crockett County
30.9% of women with births in Crockett County are unmarried. Women with the educational attainment of graduate degree are most likely to be married with 100.0% of them married at childbirth, while women with the educational attainment of less than high school are least likely to be married with 100.0% of them unmarried at childbirth.
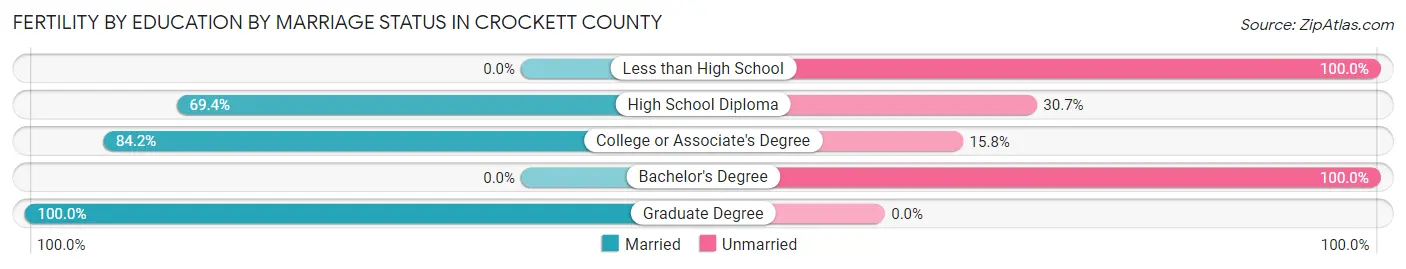
| Educational Attainment | Married | Unmarried |
| Less than High School | 0 (0.0%) | 9 (100.0%) |
| High School Diploma | 43 (69.4%) | 19 (30.6%) |
| College or Associate's Degree | 32 (84.2%) | 6 (15.8%) |
| Bachelor's Degree | 0 (0.0%) | 4 (100.0%) |
| Graduate Degree | 10 (100.0%) | 0 (0.0%) |
| Total | 85 (69.1%) | 38 (30.9%) |
Employment Characteristics in Crockett County
Employment by Class of Employer in Crockett County
Among the 6,377 employed individuals in Crockett County, private company employees (4,222 | 66.2%), self-employed (not incorporated) (714 | 11.2%), and local government employees (530 | 8.3%) make up the most common classes of employment.
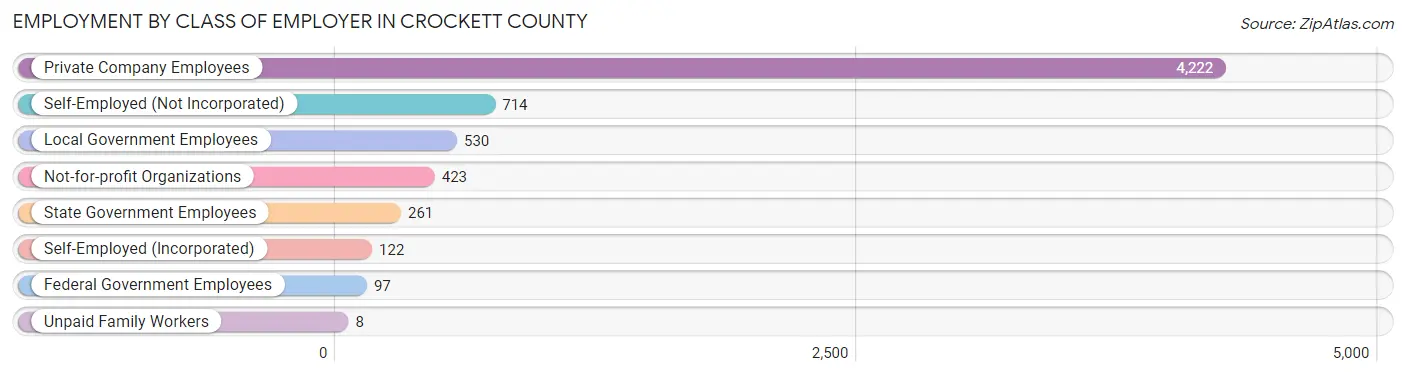
| Employer Class | # Employees | % Employees |
| Private Company Employees | 4,222 | 66.2% |
| Self-Employed (Incorporated) | 122 | 1.9% |
| Self-Employed (Not Incorporated) | 714 | 11.2% |
| Not-for-profit Organizations | 423 | 6.6% |
| Local Government Employees | 530 | 8.3% |
| State Government Employees | 261 | 4.1% |
| Federal Government Employees | 97 | 1.5% |
| Unpaid Family Workers | 8 | 0.1% |
| Total | 6,377 | 100.0% |
Employment Status by Age in Crockett County
According to the labor force statistics for Crockett County, out of the total population over 16 years of age (10,987), 61.1% or 6,713 individuals are in the labor force, with 3.8% or 255 of them unemployed. The age group with the highest labor force participation rate is 35 to 44 years, with 87.1% or 1,363 individuals in the labor force. Within the labor force, the 16 to 19 years age range has the highest percentage of unemployed individuals, with 31.1% or 120 of them being unemployed.
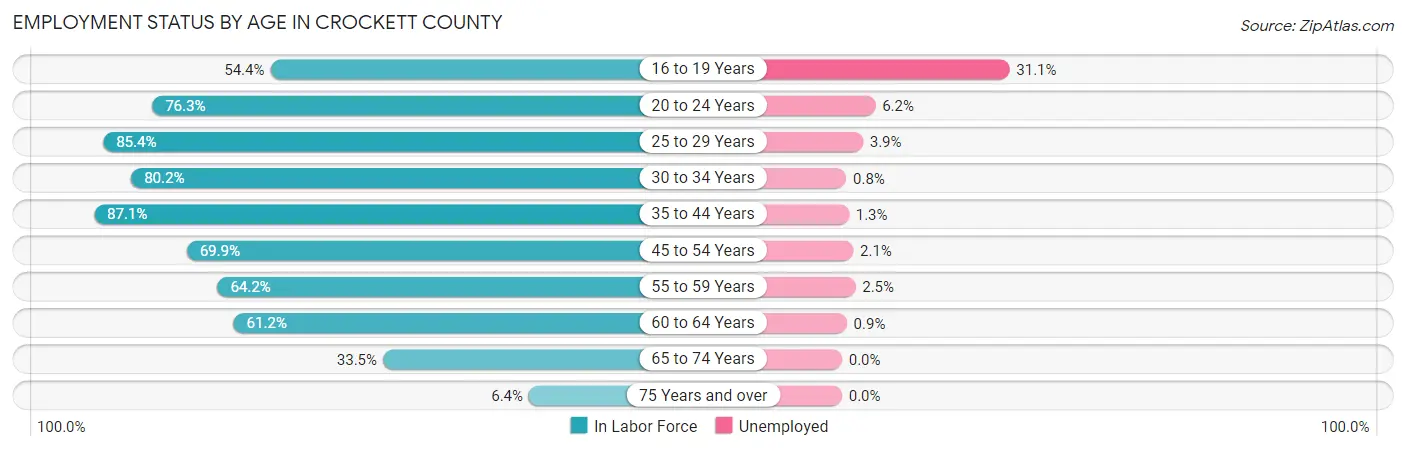
| Age Bracket | In Labor Force | Unemployed |
| 16 to 19 Years | 386 (54.4%) | 120 (31.1%) |
| 20 to 24 Years | 609 (76.3%) | 38 (6.2%) |
| 25 to 29 Years | 659 (85.4%) | 26 (3.9%) |
| 30 to 34 Years | 757 (80.2%) | 6 (0.8%) |
| 35 to 44 Years | 1,363 (87.1%) | 18 (1.3%) |
| 45 to 54 Years | 1,164 (69.9%) | 24 (2.1%) |
| 55 to 59 Years | 611 (64.2%) | 15 (2.5%) |
| 60 to 64 Years | 573 (61.2%) | 5 (0.9%) |
| 65 to 74 Years | 522 (33.5%) | 0 (0.0%) |
| 75 Years and over | 70 (6.4%) | 0 (0.0%) |
| Total | 6,713 (61.1%) | 255 (3.8%) |
Employment Status by Educational Attainment in Crockett County
According to labor force statistics for Crockett County, 75.0% of individuals (5,126) out of the total population between 25 and 64 years of age (6,835) are in the labor force, with 1.8% or 92 of them being unemployed. The group with the highest labor force participation rate are those with the educational attainment of bachelor's degree or higher, with 88.9% or 1,061 individuals in the labor force. Within the labor force, individuals with less than high school education have the highest percentage of unemployment, with 3.5% or 13 of them being unemployed.
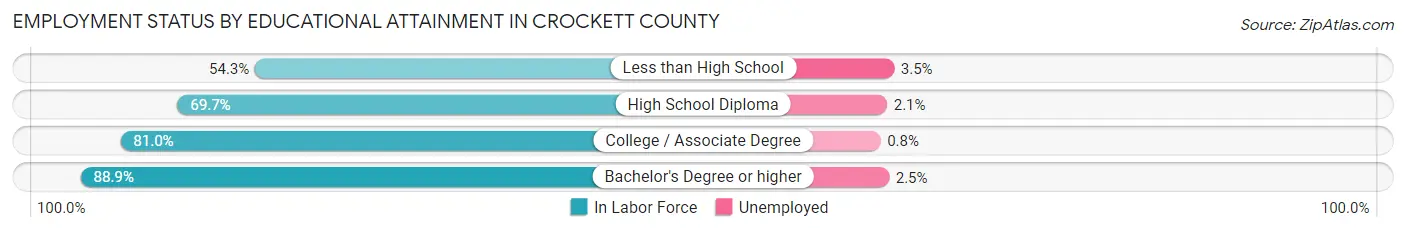
| Educational Attainment | In Labor Force | Unemployed |
| Less than High School | 375 (54.3%) | 24 (3.5%) |
| High School Diploma | 1,976 (69.7%) | 60 (2.1%) |
| College / Associate Degree | 1,713 (81.0%) | 17 (0.8%) |
| Bachelor's Degree or higher | 1,061 (88.9%) | 30 (2.5%) |
| Total | 5,126 (75.0%) | 123 (1.8%) |
Employment Occupations by Sex in Crockett County
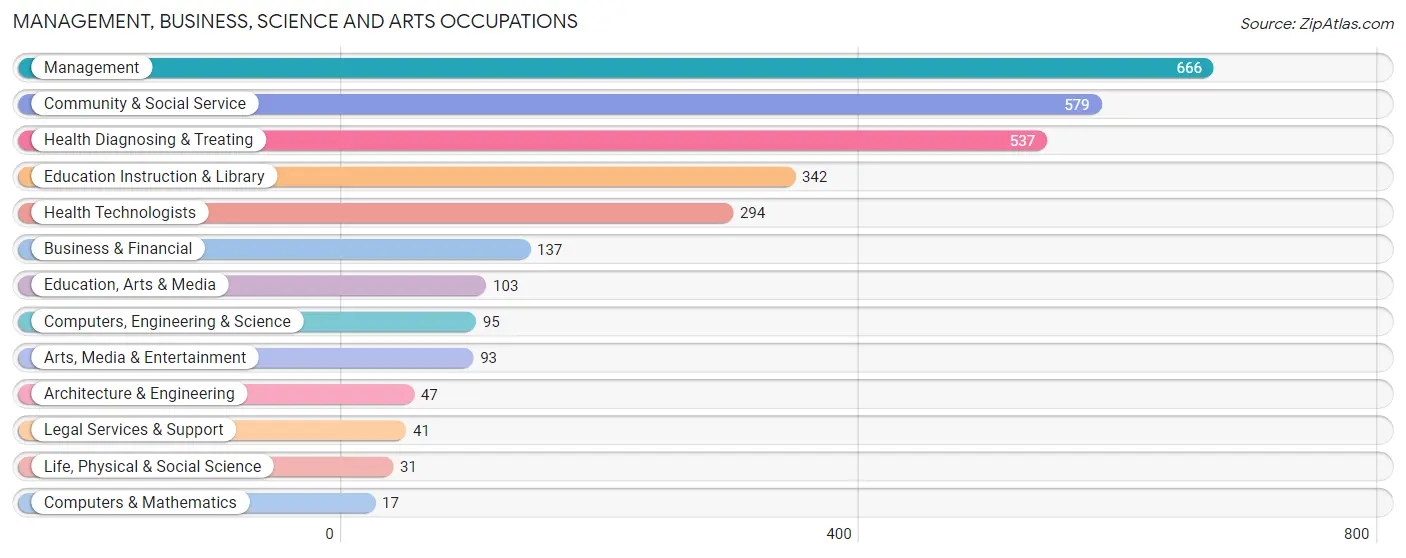
Management, Business, Science and Arts Occupations
The most common Management, Business, Science and Arts occupations in Crockett County are Management (666 | 10.3%), Community & Social Service (579 | 9.0%), Health Diagnosing & Treating (537 | 8.3%), Education Instruction & Library (342 | 5.3%), and Health Technologists (294 | 4.6%).
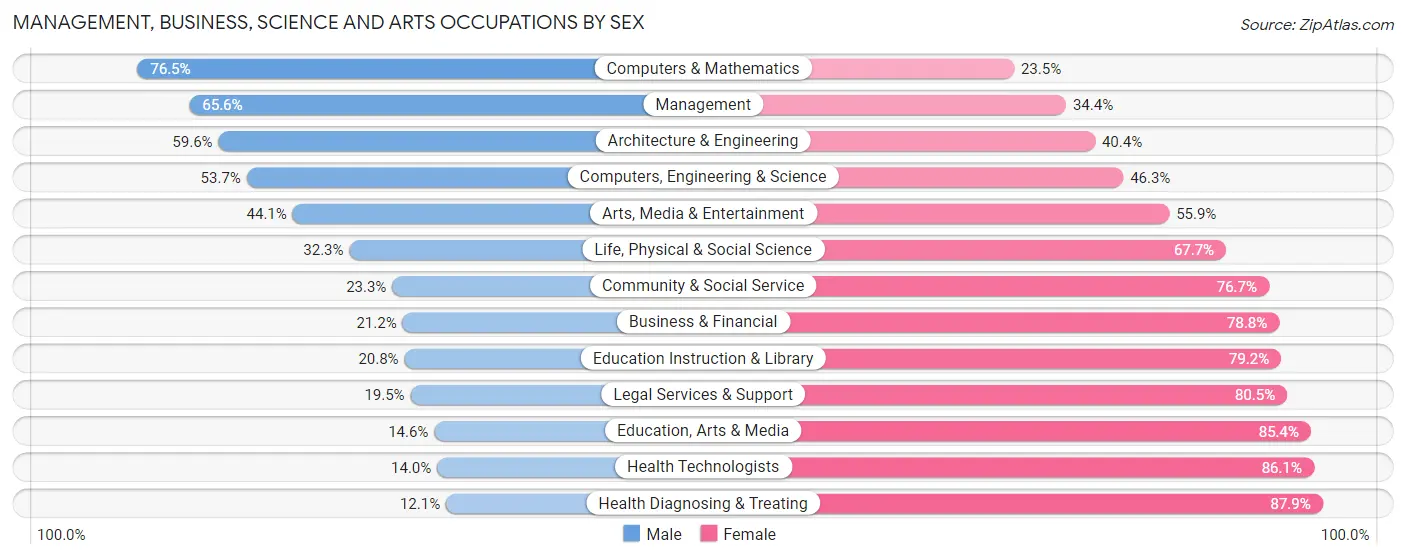
Management, Business, Science and Arts Occupations by Sex
Within the Management, Business, Science and Arts occupations in Crockett County, the most male-oriented occupations are Computers & Mathematics (76.5%), Management (65.6%), and Architecture & Engineering (59.6%), while the most female-oriented occupations are Health Diagnosing & Treating (87.9%), Health Technologists (86.1%), and Education, Arts & Media (85.4%).
| Occupation | Male | Female |
| Management | 437 (65.6%) | 229 (34.4%) |
| Business & Financial | 29 (21.2%) | 108 (78.8%) |
| Computers, Engineering & Science | 51 (53.7%) | 44 (46.3%) |
| Computers & Mathematics | 13 (76.5%) | 4 (23.5%) |
| Architecture & Engineering | 28 (59.6%) | 19 (40.4%) |
| Life, Physical & Social Science | 10 (32.3%) | 21 (67.7%) |
| Community & Social Service | 135 (23.3%) | 444 (76.7%) |
| Education, Arts & Media | 15 (14.6%) | 88 (85.4%) |
| Legal Services & Support | 8 (19.5%) | 33 (80.5%) |
| Education Instruction & Library | 71 (20.8%) | 271 (79.2%) |
| Arts, Media & Entertainment | 41 (44.1%) | 52 (55.9%) |
| Health Diagnosing & Treating | 65 (12.1%) | 472 (87.9%) |
| Health Technologists | 41 (14.0%) | 253 (86.1%) |
| Total (Category) | 717 (35.6%) | 1,297 (64.4%) |
| Total (Overall) | 3,298 (51.1%) | 3,151 (48.9%) |
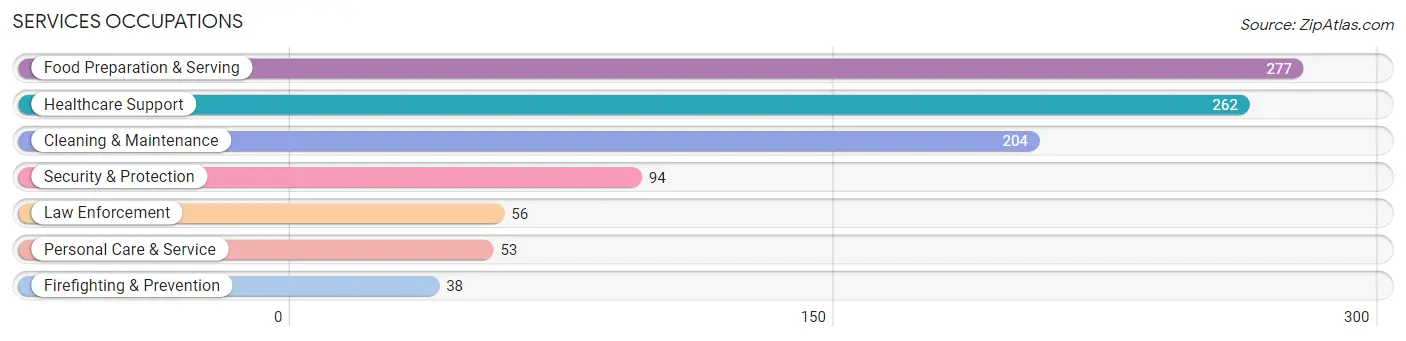
Services Occupations
The most common Services occupations in Crockett County are Food Preparation & Serving (277 | 4.3%), Healthcare Support (262 | 4.1%), Cleaning & Maintenance (204 | 3.2%), Security & Protection (94 | 1.5%), and Law Enforcement (56 | 0.9%).
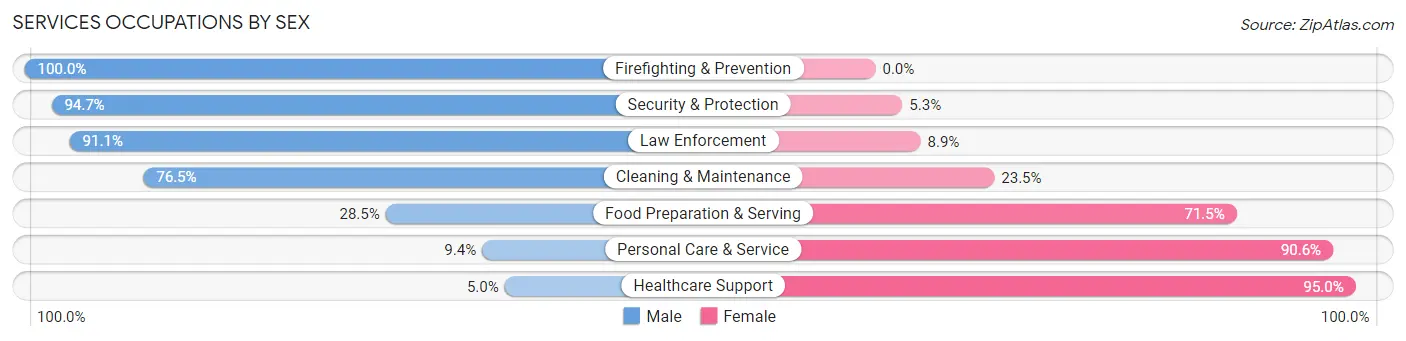
Services Occupations by Sex
Within the Services occupations in Crockett County, the most male-oriented occupations are Firefighting & Prevention (100.0%), Security & Protection (94.7%), and Law Enforcement (91.1%), while the most female-oriented occupations are Healthcare Support (95.0%), Personal Care & Service (90.6%), and Food Preparation & Serving (71.5%).
| Occupation | Male | Female |
| Healthcare Support | 13 (5.0%) | 249 (95.0%) |
| Security & Protection | 89 (94.7%) | 5 (5.3%) |
| Firefighting & Prevention | 38 (100.0%) | 0 (0.0%) |
| Law Enforcement | 51 (91.1%) | 5 (8.9%) |
| Food Preparation & Serving | 79 (28.5%) | 198 (71.5%) |
| Cleaning & Maintenance | 156 (76.5%) | 48 (23.5%) |
| Personal Care & Service | 5 (9.4%) | 48 (90.6%) |
| Total (Category) | 342 (38.4%) | 548 (61.6%) |
| Total (Overall) | 3,298 (51.1%) | 3,151 (48.9%) |
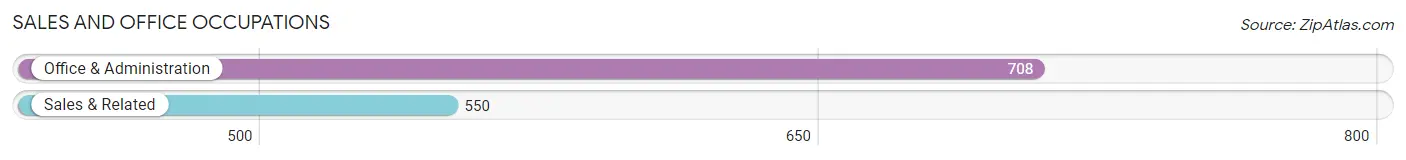
Sales and Office Occupations
The most common Sales and Office occupations in Crockett County are Office & Administration (708 | 11.0%), and Sales & Related (550 | 8.5%).
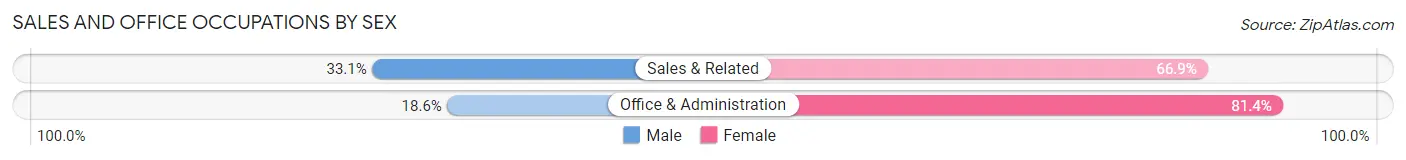
Sales and Office Occupations by Sex
| Occupation | Male | Female |
| Sales & Related | 182 (33.1%) | 368 (66.9%) |
| Office & Administration | 132 (18.6%) | 576 (81.4%) |
| Total (Category) | 314 (25.0%) | 944 (75.0%) |
| Total (Overall) | 3,298 (51.1%) | 3,151 (48.9%) |
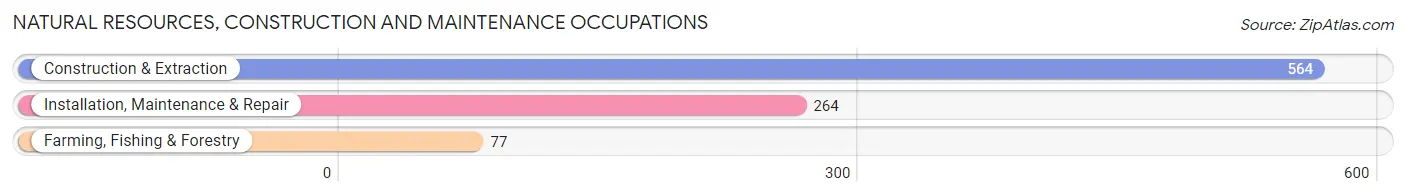
Natural Resources, Construction and Maintenance Occupations
The most common Natural Resources, Construction and Maintenance occupations in Crockett County are Construction & Extraction (564 | 8.7%), Installation, Maintenance & Repair (264 | 4.1%), and Farming, Fishing & Forestry (77 | 1.2%).
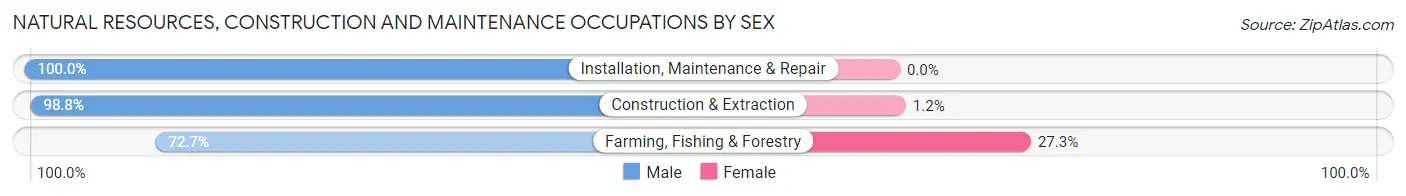
Natural Resources, Construction and Maintenance Occupations by Sex
| Occupation | Male | Female |
| Farming, Fishing & Forestry | 56 (72.7%) | 21 (27.3%) |
| Construction & Extraction | 557 (98.8%) | 7 (1.2%) |
| Installation, Maintenance & Repair | 264 (100.0%) | 0 (0.0%) |
| Total (Category) | 877 (96.9%) | 28 (3.1%) |
| Total (Overall) | 3,298 (51.1%) | 3,151 (48.9%) |
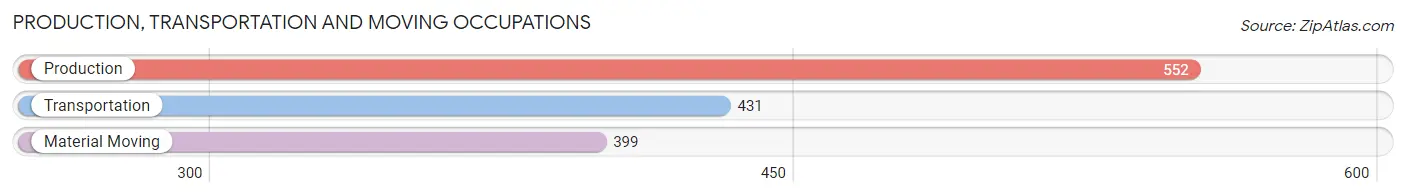
Production, Transportation and Moving Occupations
The most common Production, Transportation and Moving occupations in Crockett County are Production (552 | 8.6%), Transportation (431 | 6.7%), and Material Moving (399 | 6.2%).
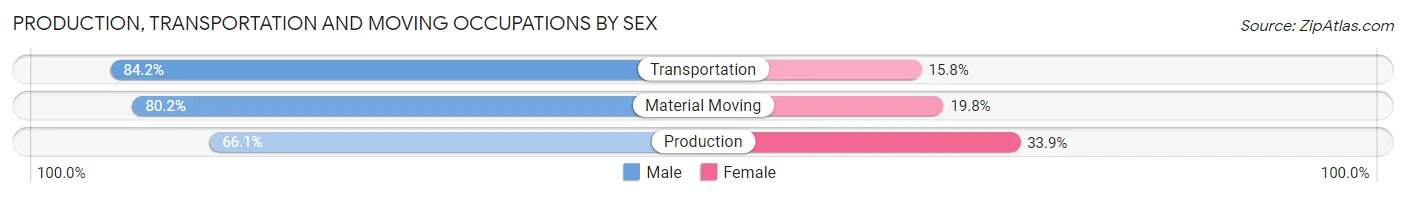
Production, Transportation and Moving Occupations by Sex
| Occupation | Male | Female |
| Production | 365 (66.1%) | 187 (33.9%) |
| Transportation | 363 (84.2%) | 68 (15.8%) |
| Material Moving | 320 (80.2%) | 79 (19.8%) |
| Total (Category) | 1,048 (75.8%) | 334 (24.2%) |
| Total (Overall) | 3,298 (51.1%) | 3,151 (48.9%) |
Employment Industries by Sex in Crockett County
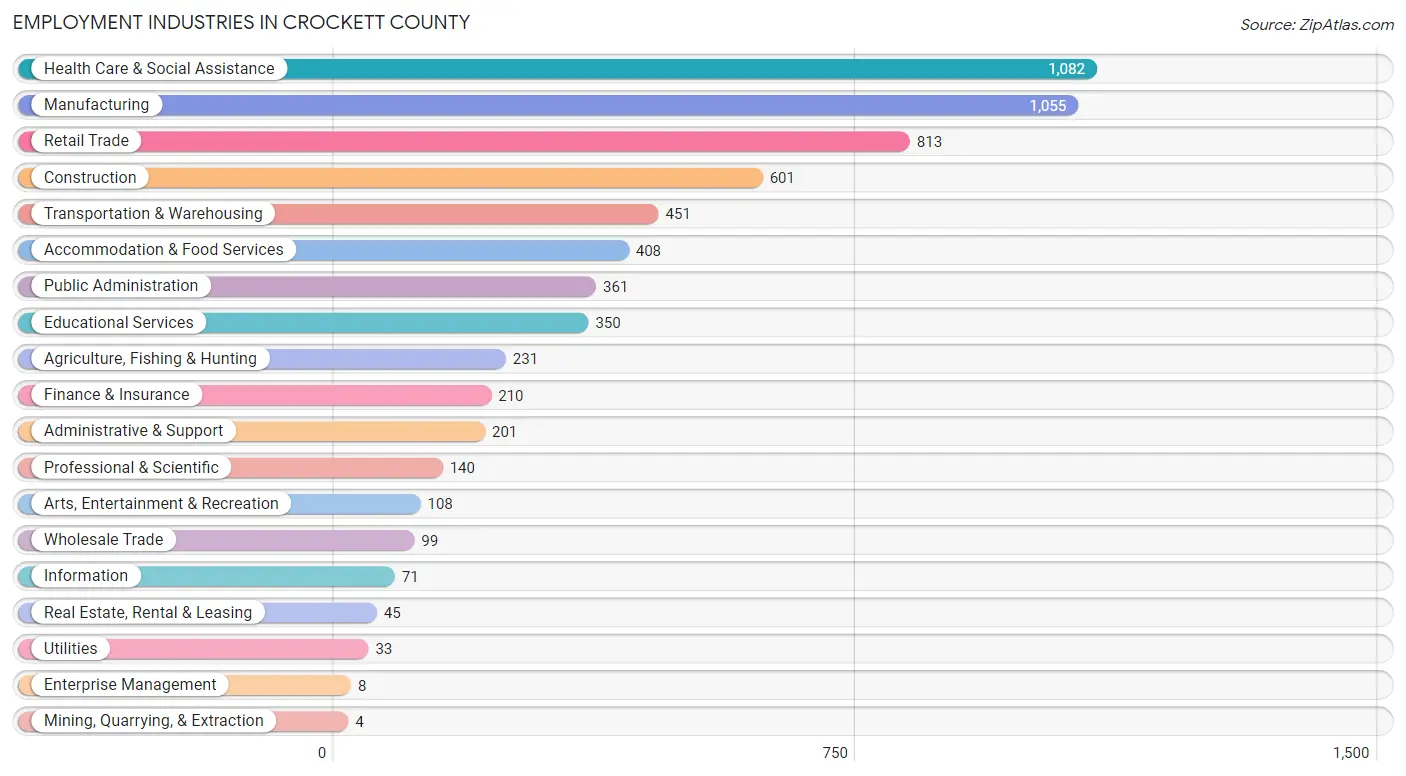
Employment Industries in Crockett County
The major employment industries in Crockett County include Health Care & Social Assistance (1,082 | 16.8%), Manufacturing (1,055 | 16.4%), Retail Trade (813 | 12.6%), Construction (601 | 9.3%), and Transportation & Warehousing (451 | 7.0%).
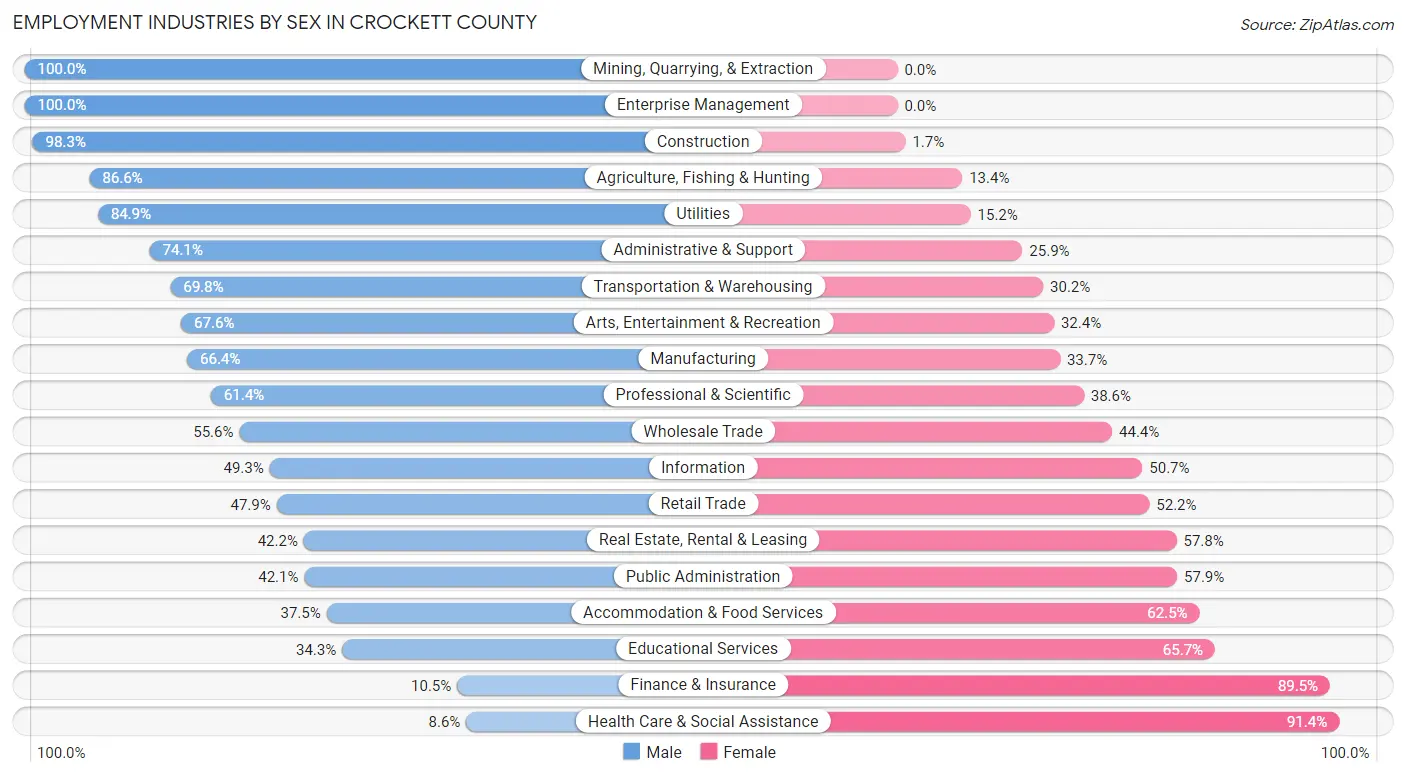
Employment Industries by Sex in Crockett County
The Crockett County industries that see more men than women are Mining, Quarrying, & Extraction (100.0%), Enterprise Management (100.0%), and Construction (98.3%), whereas the industries that tend to have a higher number of women are Health Care & Social Assistance (91.4%), Finance & Insurance (89.5%), and Educational Services (65.7%).
| Industry | Male | Female |
| Agriculture, Fishing & Hunting | 200 (86.6%) | 31 (13.4%) |
| Mining, Quarrying, & Extraction | 4 (100.0%) | 0 (0.0%) |
| Construction | 591 (98.3%) | 10 (1.7%) |
| Manufacturing | 700 (66.3%) | 355 (33.7%) |
| Wholesale Trade | 55 (55.6%) | 44 (44.4%) |
| Retail Trade | 389 (47.8%) | 424 (52.1%) |
| Transportation & Warehousing | 315 (69.8%) | 136 (30.2%) |
| Utilities | 28 (84.9%) | 5 (15.1%) |
| Information | 35 (49.3%) | 36 (50.7%) |
| Finance & Insurance | 22 (10.5%) | 188 (89.5%) |
| Real Estate, Rental & Leasing | 19 (42.2%) | 26 (57.8%) |
| Professional & Scientific | 86 (61.4%) | 54 (38.6%) |
| Enterprise Management | 8 (100.0%) | 0 (0.0%) |
| Administrative & Support | 149 (74.1%) | 52 (25.9%) |
| Educational Services | 120 (34.3%) | 230 (65.7%) |
| Health Care & Social Assistance | 93 (8.6%) | 989 (91.4%) |
| Arts, Entertainment & Recreation | 73 (67.6%) | 35 (32.4%) |
| Accommodation & Food Services | 153 (37.5%) | 255 (62.5%) |
| Public Administration | 152 (42.1%) | 209 (57.9%) |
| Total | 3,298 (51.1%) | 3,151 (48.9%) |
Education in Crockett County
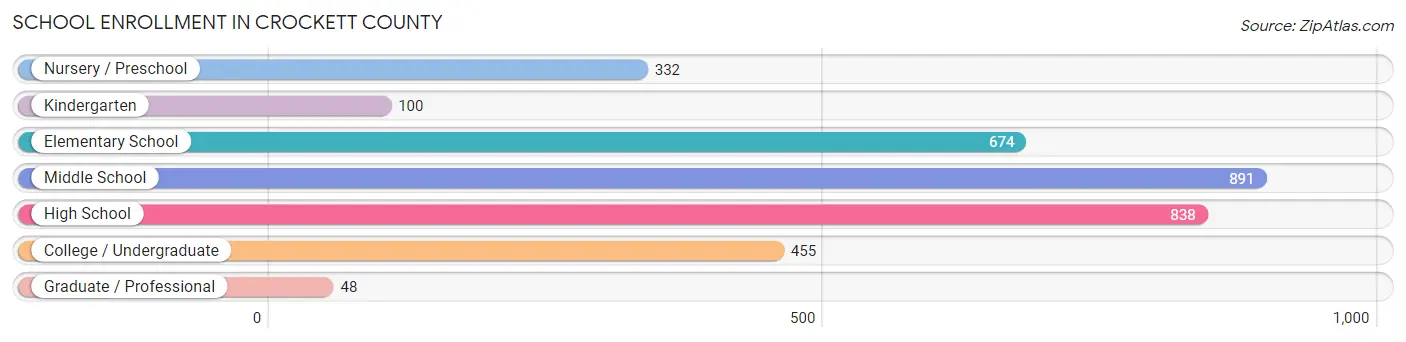
School Enrollment in Crockett County
The most common levels of schooling among the 3,338 students in Crockett County are middle school (891 | 26.7%), high school (838 | 25.1%), and elementary school (674 | 20.2%).
| School Level | # Students | % Students |
| Nursery / Preschool | 332 | 10.0% |
| Kindergarten | 100 | 3.0% |
| Elementary School | 674 | 20.2% |
| Middle School | 891 | 26.7% |
| High School | 838 | 25.1% |
| College / Undergraduate | 455 | 13.6% |
| Graduate / Professional | 48 | 1.4% |
| Total | 3,338 | 100.0% |
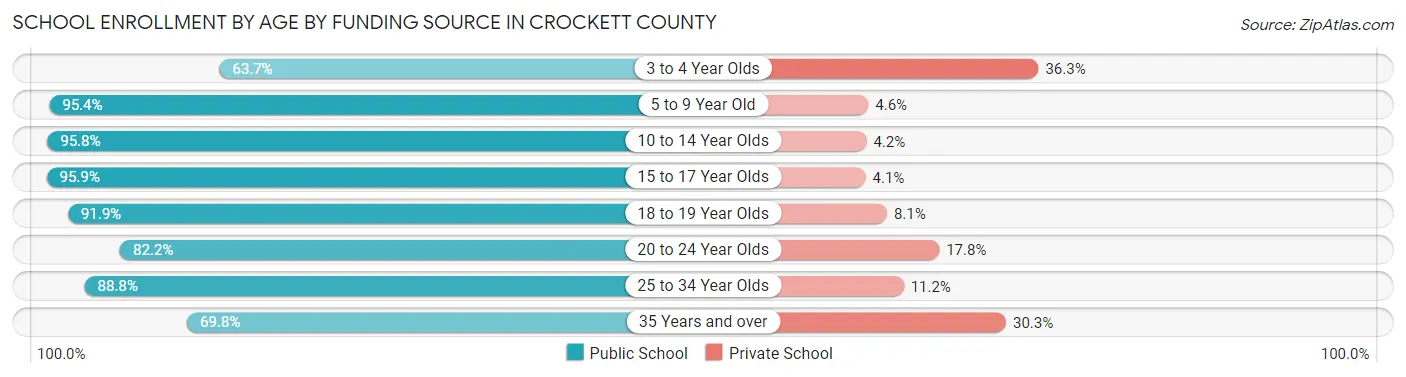
School Enrollment by Age by Funding Source in Crockett County
Out of a total of 3,338 students who are enrolled in schools in Crockett County, 297 (8.9%) attend a private institution, while the remaining 3,041 (91.1%) are enrolled in public schools. The age group of 3 to 4 year olds has the highest likelihood of being enrolled in private schools, with 86 (36.3% in the age bracket) enrolled. Conversely, the age group of 15 to 17 year olds has the lowest likelihood of being enrolled in a private school, with 516 (95.9% in the age bracket) attending a public institution.
| Age Bracket | Public School | Private School |
| 3 to 4 Year Olds | 151 (63.7%) | 86 (36.3%) |
| 5 to 9 Year Old | 726 (95.4%) | 35 (4.6%) |
| 10 to 14 Year Olds | 1,061 (95.8%) | 47 (4.2%) |
| 15 to 17 Year Olds | 516 (95.9%) | 22 (4.1%) |
| 18 to 19 Year Olds | 205 (91.9%) | 18 (8.1%) |
| 20 to 24 Year Olds | 157 (82.2%) | 34 (17.8%) |
| 25 to 34 Year Olds | 143 (88.8%) | 18 (11.2%) |
| 35 Years and over | 83 (69.8%) | 36 (30.2%) |
| Total | 3,041 (91.1%) | 297 (8.9%) |
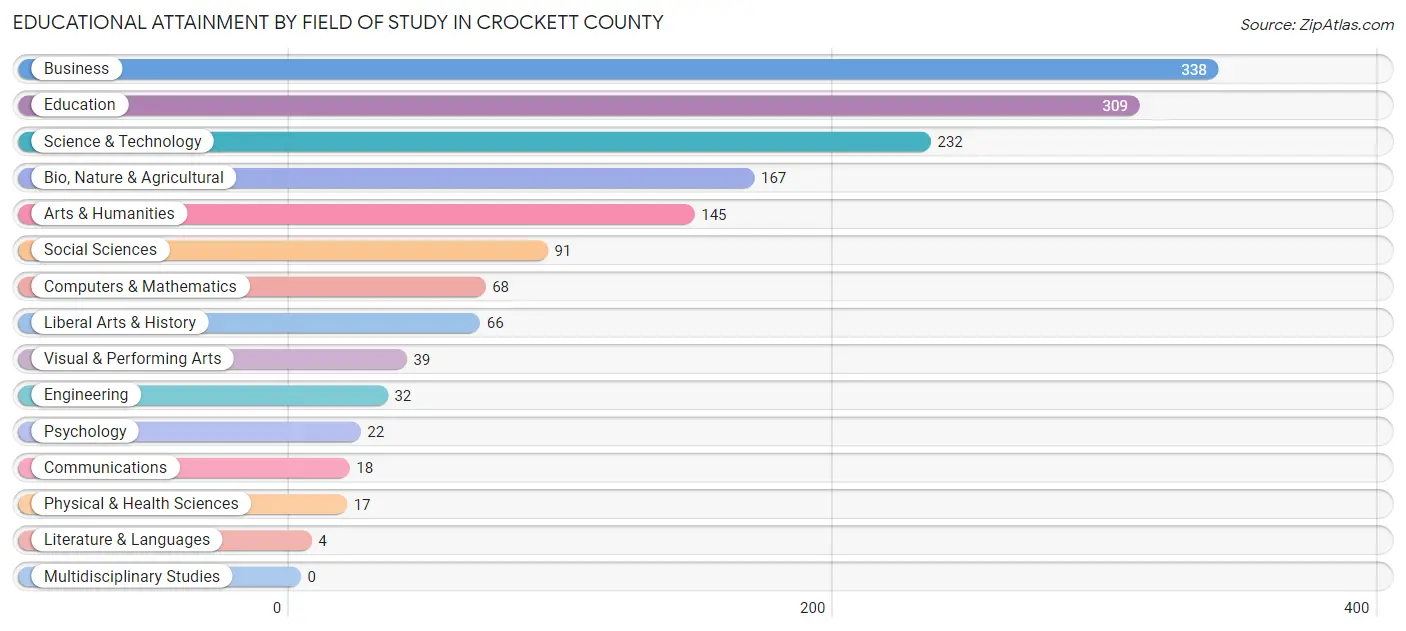
Educational Attainment by Field of Study in Crockett County
Business (338 | 21.8%), education (309 | 20.0%), science & technology (232 | 15.0%), bio, nature & agricultural (167 | 10.8%), and arts & humanities (145 | 9.4%) are the most common fields of study among 1,548 individuals in Crockett County who have obtained a bachelor's degree or higher.
| Field of Study | # Graduates | % Graduates |
| Computers & Mathematics | 68 | 4.4% |
| Bio, Nature & Agricultural | 167 | 10.8% |
| Physical & Health Sciences | 17 | 1.1% |
| Psychology | 22 | 1.4% |
| Social Sciences | 91 | 5.9% |
| Engineering | 32 | 2.1% |
| Multidisciplinary Studies | 0 | 0.0% |
| Science & Technology | 232 | 15.0% |
| Business | 338 | 21.8% |
| Education | 309 | 20.0% |
| Literature & Languages | 4 | 0.3% |
| Liberal Arts & History | 66 | 4.3% |
| Visual & Performing Arts | 39 | 2.5% |
| Communications | 18 | 1.2% |
| Arts & Humanities | 145 | 9.4% |
| Total | 1,548 | 100.0% |
Transportation & Commute in Crockett County
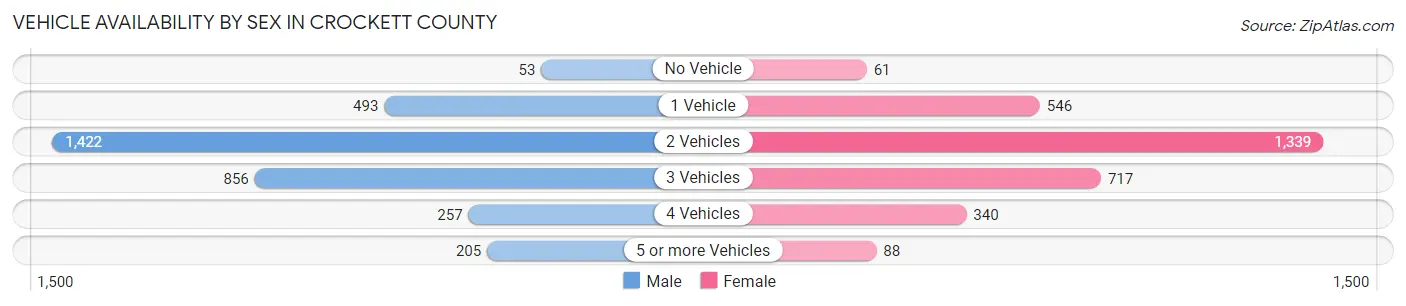
Vehicle Availability by Sex in Crockett County
The most prevalent vehicle ownership categories in Crockett County are males with 2 vehicles (1,422, accounting for 43.3%) and females with 2 vehicles (1,339, making up 46.0%).
| Vehicles Available | Male | Female |
| No Vehicle | 53 (1.6%) | 61 (2.0%) |
| 1 Vehicle | 493 (15.0%) | 546 (17.7%) |
| 2 Vehicles | 1,422 (43.3%) | 1,339 (43.3%) |
| 3 Vehicles | 856 (26.1%) | 717 (23.2%) |
| 4 Vehicles | 257 (7.8%) | 340 (11.0%) |
| 5 or more Vehicles | 205 (6.2%) | 88 (2.9%) |
| Total | 3,286 (100.0%) | 3,091 (100.0%) |
Commute Time in Crockett County
The most frequently occuring commute durations in Crockett County are 30 to 34 minutes (1,237 commuters, 20.0%), 20 to 24 minutes (894 commuters, 14.5%), and 15 to 19 minutes (750 commuters, 12.1%).
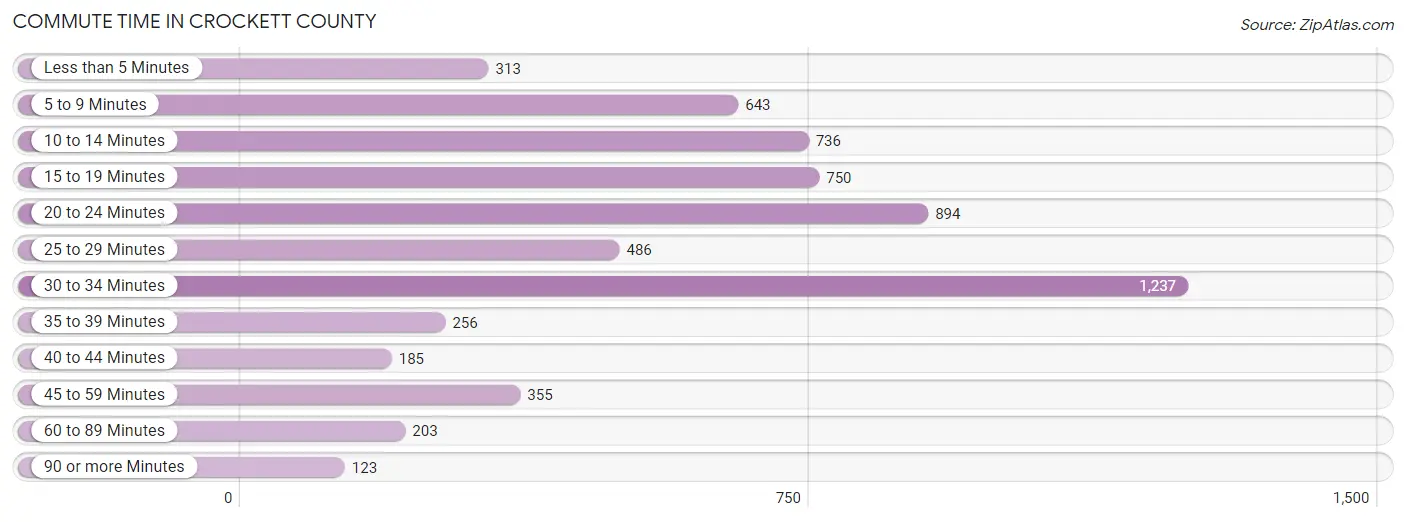
| Commute Time | # Commuters | % Commuters |
| Less than 5 Minutes | 313 | 5.1% |
| 5 to 9 Minutes | 643 | 10.4% |
| 10 to 14 Minutes | 736 | 11.9% |
| 15 to 19 Minutes | 750 | 12.1% |
| 20 to 24 Minutes | 894 | 14.5% |
| 25 to 29 Minutes | 486 | 7.9% |
| 30 to 34 Minutes | 1,237 | 20.0% |
| 35 to 39 Minutes | 256 | 4.1% |
| 40 to 44 Minutes | 185 | 3.0% |
| 45 to 59 Minutes | 355 | 5.7% |
| 60 to 89 Minutes | 203 | 3.3% |
| 90 or more Minutes | 123 | 2.0% |
Commute Time by Sex in Crockett County
The most common commute times in Crockett County are 30 to 34 minutes (688 commuters, 21.6%) for males and 30 to 34 minutes (549 commuters, 18.3%) for females.
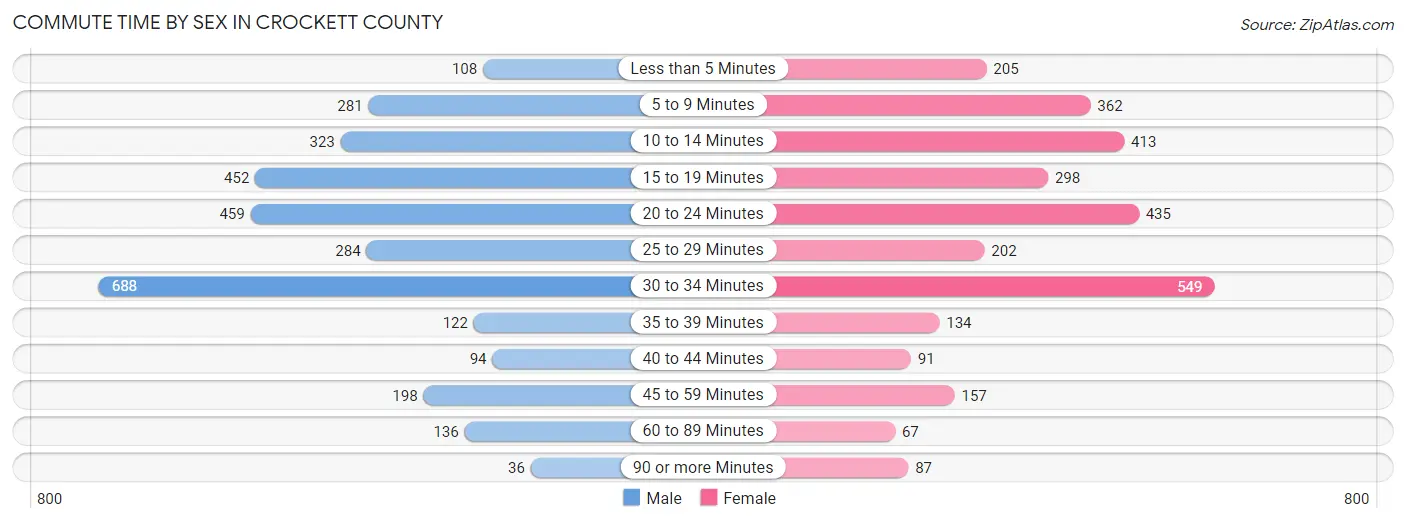
| Commute Time | Male | Female |
| Less than 5 Minutes | 108 (3.4%) | 205 (6.8%) |
| 5 to 9 Minutes | 281 (8.8%) | 362 (12.1%) |
| 10 to 14 Minutes | 323 (10.2%) | 413 (13.8%) |
| 15 to 19 Minutes | 452 (14.2%) | 298 (9.9%) |
| 20 to 24 Minutes | 459 (14.4%) | 435 (14.5%) |
| 25 to 29 Minutes | 284 (8.9%) | 202 (6.7%) |
| 30 to 34 Minutes | 688 (21.6%) | 549 (18.3%) |
| 35 to 39 Minutes | 122 (3.8%) | 134 (4.5%) |
| 40 to 44 Minutes | 94 (3.0%) | 91 (3.0%) |
| 45 to 59 Minutes | 198 (6.2%) | 157 (5.2%) |
| 60 to 89 Minutes | 136 (4.3%) | 67 (2.2%) |
| 90 or more Minutes | 36 (1.1%) | 87 (2.9%) |
Time of Departure to Work by Sex in Crockett County
The most frequent times of departure to work in Crockett County are 6:00 AM to 6:29 AM (485, 15.2%) for males and 7:00 AM to 7:29 AM (727, 24.2%) for females.
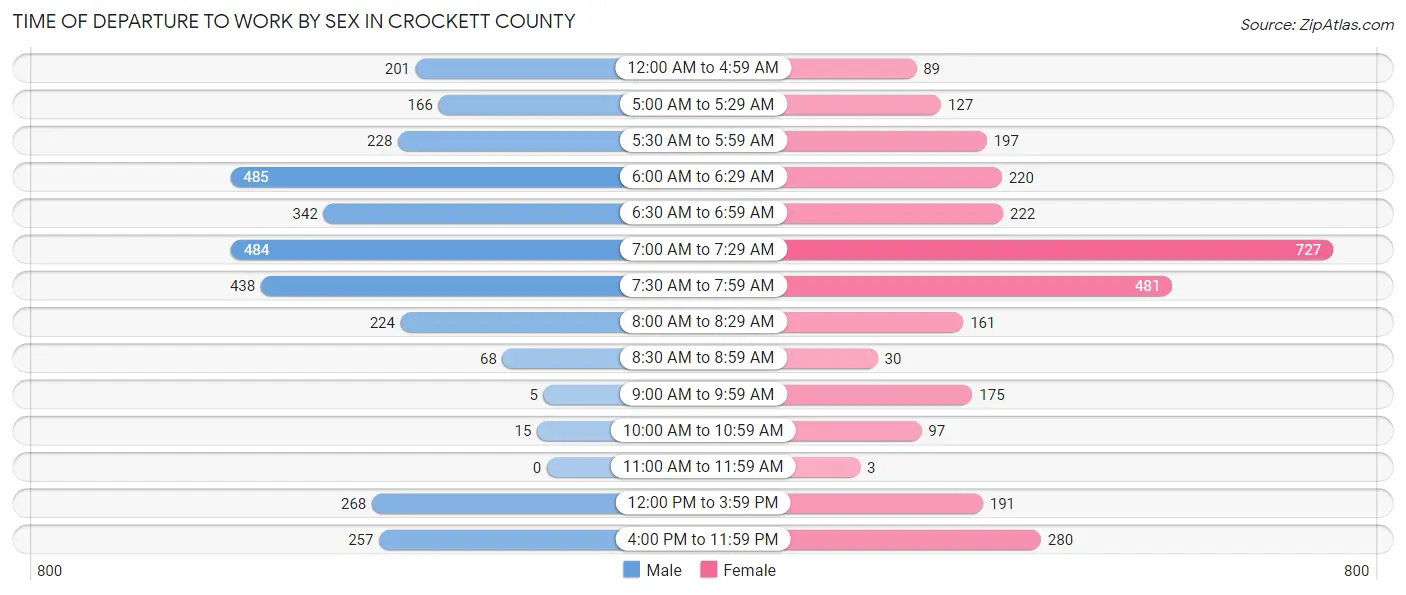
| Time of Departure | Male | Female |
| 12:00 AM to 4:59 AM | 201 (6.3%) | 89 (3.0%) |
| 5:00 AM to 5:29 AM | 166 (5.2%) | 127 (4.2%) |
| 5:30 AM to 5:59 AM | 228 (7.2%) | 197 (6.6%) |
| 6:00 AM to 6:29 AM | 485 (15.2%) | 220 (7.3%) |
| 6:30 AM to 6:59 AM | 342 (10.7%) | 222 (7.4%) |
| 7:00 AM to 7:29 AM | 484 (15.2%) | 727 (24.2%) |
| 7:30 AM to 7:59 AM | 438 (13.8%) | 481 (16.0%) |
| 8:00 AM to 8:29 AM | 224 (7.0%) | 161 (5.4%) |
| 8:30 AM to 8:59 AM | 68 (2.1%) | 30 (1.0%) |
| 9:00 AM to 9:59 AM | 5 (0.2%) | 175 (5.8%) |
| 10:00 AM to 10:59 AM | 15 (0.5%) | 97 (3.2%) |
| 11:00 AM to 11:59 AM | 0 (0.0%) | 3 (0.1%) |
| 12:00 PM to 3:59 PM | 268 (8.4%) | 191 (6.4%) |
| 4:00 PM to 11:59 PM | 257 (8.1%) | 280 (9.3%) |
| Total | 3,181 (100.0%) | 3,000 (100.0%) |
Housing Occupancy in Crockett County
Occupancy by Ownership in Crockett County
Of the total 5,409 dwellings in Crockett County, owner-occupied units account for 3,723 (68.8%), while renter-occupied units make up 1,686 (31.2%).
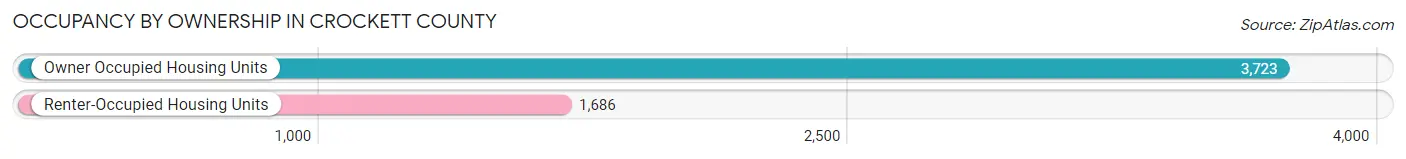
| Occupancy | # Housing Units | % Housing Units |
| Owner Occupied Housing Units | 3,723 | 68.8% |
| Renter-Occupied Housing Units | 1,686 | 31.2% |
| Total Occupied Housing Units | 5,409 | 100.0% |
Occupancy by Household Size in Crockett County
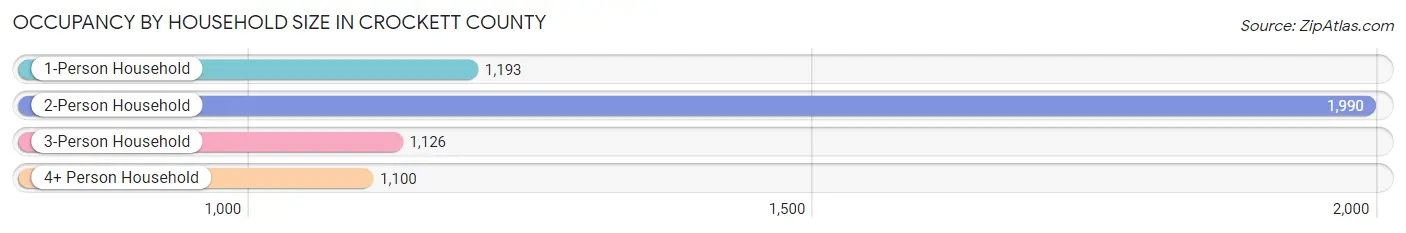
| Household Size | # Housing Units | % Housing Units |
| 1-Person Household | 1,193 | 22.1% |
| 2-Person Household | 1,990 | 36.8% |
| 3-Person Household | 1,126 | 20.8% |
| 4+ Person Household | 1,100 | 20.3% |
| Total Housing Units | 5,409 | 100.0% |
Occupancy by Ownership by Household Size in Crockett County
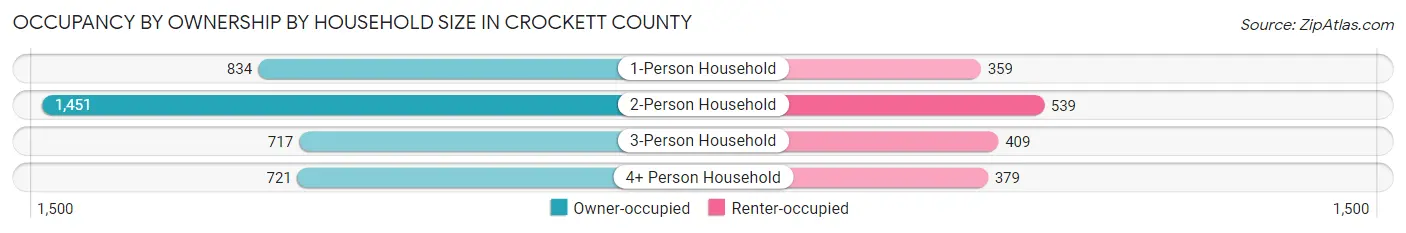
| Household Size | Owner-occupied | Renter-occupied |
| 1-Person Household | 834 (69.9%) | 359 (30.1%) |
| 2-Person Household | 1,451 (72.9%) | 539 (27.1%) |
| 3-Person Household | 717 (63.7%) | 409 (36.3%) |
| 4+ Person Household | 721 (65.5%) | 379 (34.4%) |
| Total Housing Units | 3,723 (68.8%) | 1,686 (31.2%) |
Occupancy by Educational Attainment in Crockett County
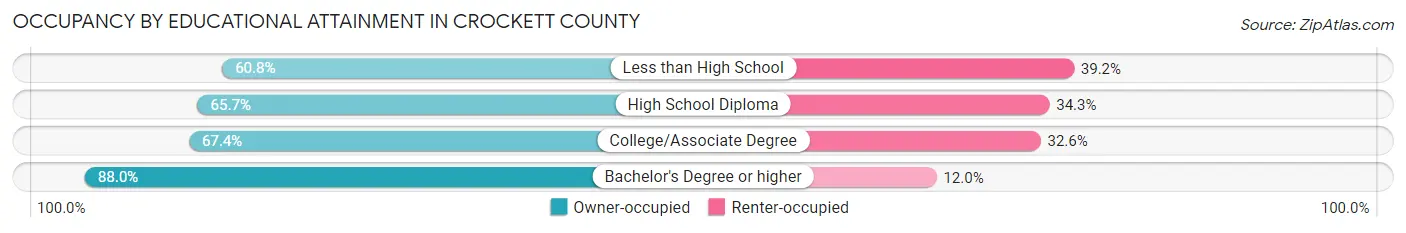
| Household Size | Owner-occupied | Renter-occupied |
| Less than High School | 436 (60.8%) | 281 (39.2%) |
| High School Diploma | 1,506 (65.7%) | 787 (34.3%) |
| College/Associate Degree | 1,082 (67.4%) | 523 (32.6%) |
| Bachelor's Degree or higher | 699 (88.0%) | 95 (12.0%) |
Occupancy by Age of Householder in Crockett County
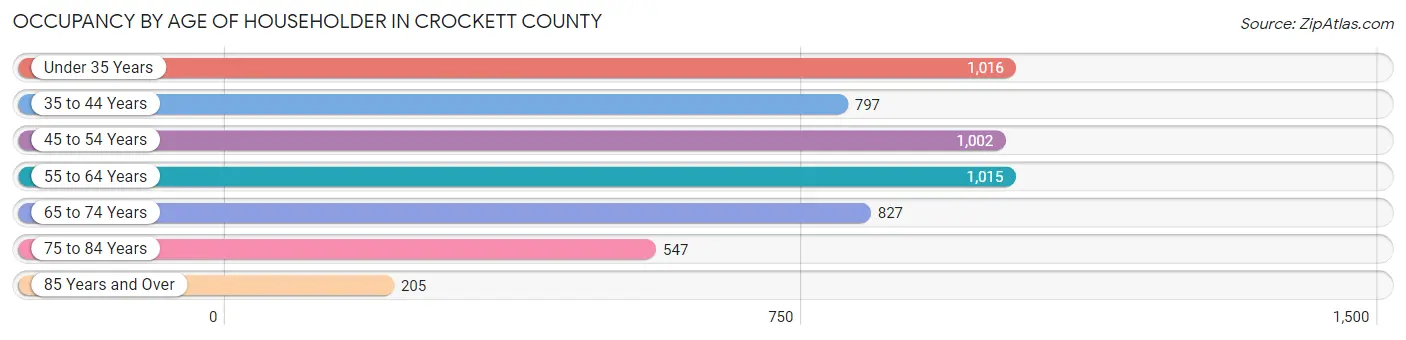
| Age Bracket | # Households | % Households |
| Under 35 Years | 1,016 | 18.8% |
| 35 to 44 Years | 797 | 14.7% |
| 45 to 54 Years | 1,002 | 18.5% |
| 55 to 64 Years | 1,015 | 18.8% |
| 65 to 74 Years | 827 | 15.3% |
| 75 to 84 Years | 547 | 10.1% |
| 85 Years and Over | 205 | 3.8% |
| Total | 5,409 | 100.0% |
Housing Finances in Crockett County
Median Income by Occupancy in Crockett County
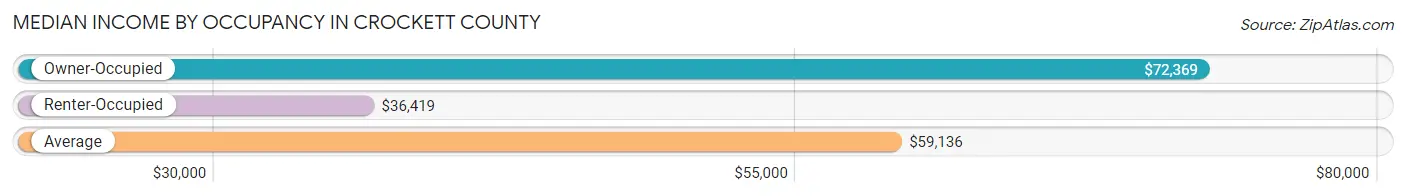
| Occupancy Type | # Households | Median Income |
| Owner-Occupied | 3,723 (68.8%) | $72,369 |
| Renter-Occupied | 1,686 (31.2%) | $36,419 |
| Average | 5,409 (100.0%) | $59,136 |
Occupancy by Householder Income Bracket in Crockett County
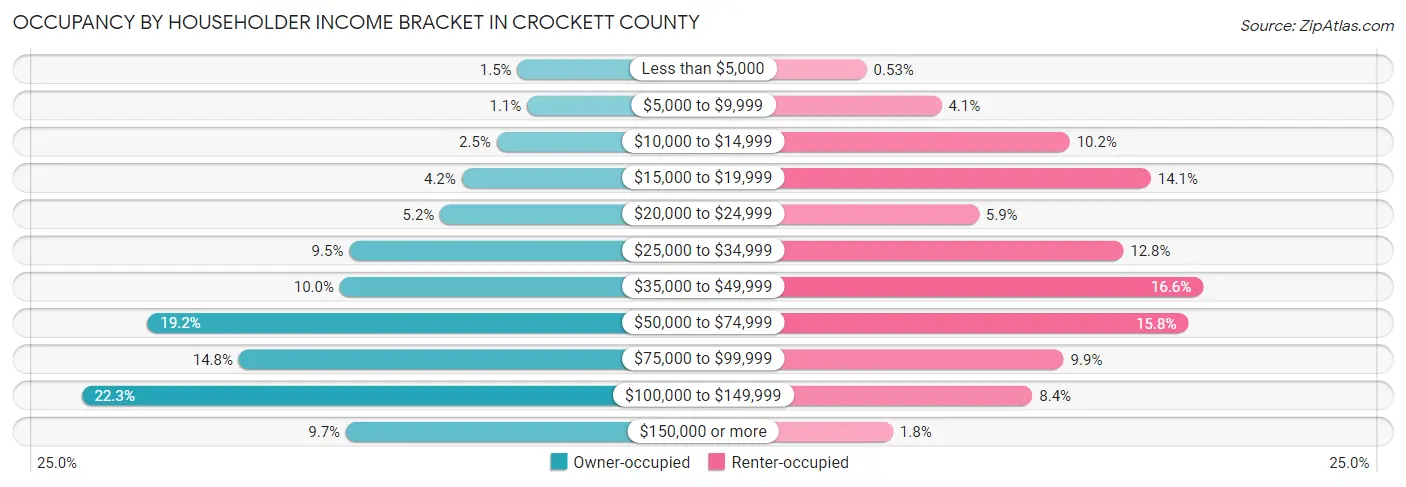
| Income Bracket | Owner-occupied | Renter-occupied |
| Less than $5,000 | 57 (1.5%) | 9 (0.5%) |
| $5,000 to $9,999 | 40 (1.1%) | 69 (4.1%) |
| $10,000 to $14,999 | 94 (2.5%) | 172 (10.2%) |
| $15,000 to $19,999 | 156 (4.2%) | 237 (14.1%) |
| $20,000 to $24,999 | 194 (5.2%) | 99 (5.9%) |
| $25,000 to $34,999 | 355 (9.5%) | 215 (12.8%) |
| $35,000 to $49,999 | 372 (10.0%) | 279 (16.6%) |
| $50,000 to $74,999 | 713 (19.2%) | 267 (15.8%) |
| $75,000 to $99,999 | 551 (14.8%) | 167 (9.9%) |
| $100,000 to $149,999 | 830 (22.3%) | 142 (8.4%) |
| $150,000 or more | 361 (9.7%) | 30 (1.8%) |
| Total | 3,723 (100.0%) | 1,686 (100.0%) |
Monthly Housing Cost Tiers in Crockett County
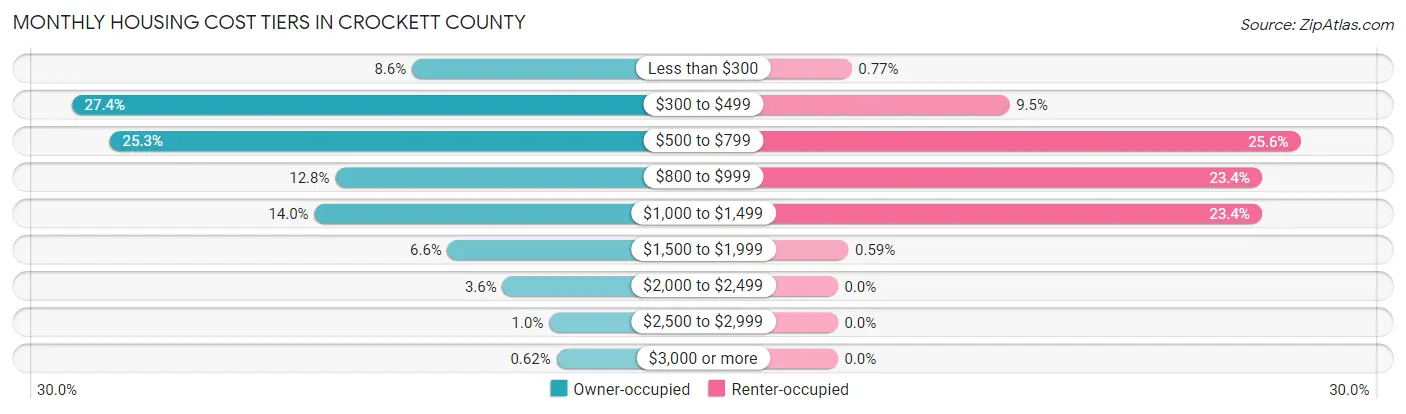
| Monthly Cost | Owner-occupied | Renter-occupied |
| Less than $300 | 320 (8.6%) | 13 (0.8%) |
| $300 to $499 | 1,020 (27.4%) | 160 (9.5%) |
| $500 to $799 | 942 (25.3%) | 431 (25.6%) |
| $800 to $999 | 478 (12.8%) | 395 (23.4%) |
| $1,000 to $1,499 | 521 (14.0%) | 395 (23.4%) |
| $1,500 to $1,999 | 247 (6.6%) | 10 (0.6%) |
| $2,000 to $2,499 | 134 (3.6%) | 0 (0.0%) |
| $2,500 to $2,999 | 38 (1.0%) | 0 (0.0%) |
| $3,000 or more | 23 (0.6%) | 0 (0.0%) |
| Total | 3,723 (100.0%) | 1,686 (100.0%) |
Physical Housing Characteristics in Crockett County
Housing Structures in Crockett County
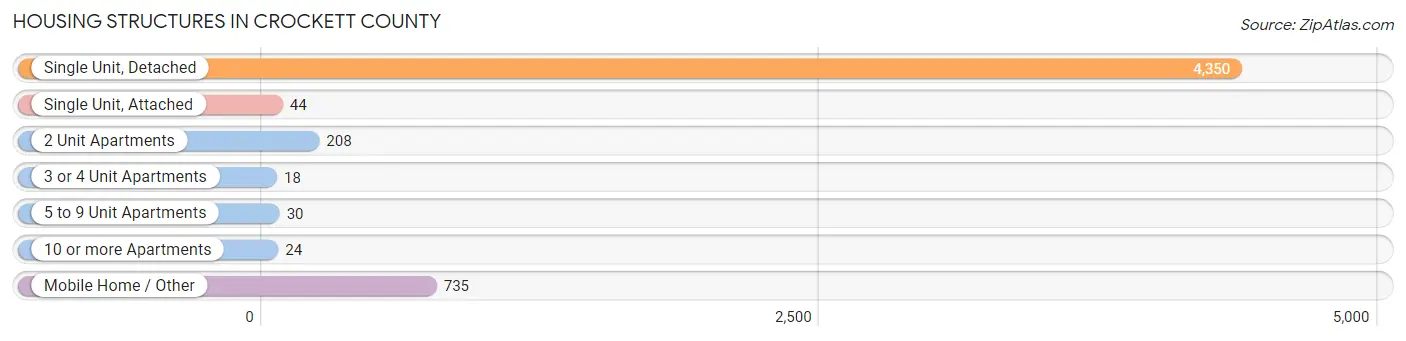
| Structure Type | # Housing Units | % Housing Units |
| Single Unit, Detached | 4,350 | 80.4% |
| Single Unit, Attached | 44 | 0.8% |
| 2 Unit Apartments | 208 | 3.8% |
| 3 or 4 Unit Apartments | 18 | 0.3% |
| 5 to 9 Unit Apartments | 30 | 0.5% |
| 10 or more Apartments | 24 | 0.4% |
| Mobile Home / Other | 735 | 13.6% |
| Total | 5,409 | 100.0% |
Housing Structures by Occupancy in Crockett County
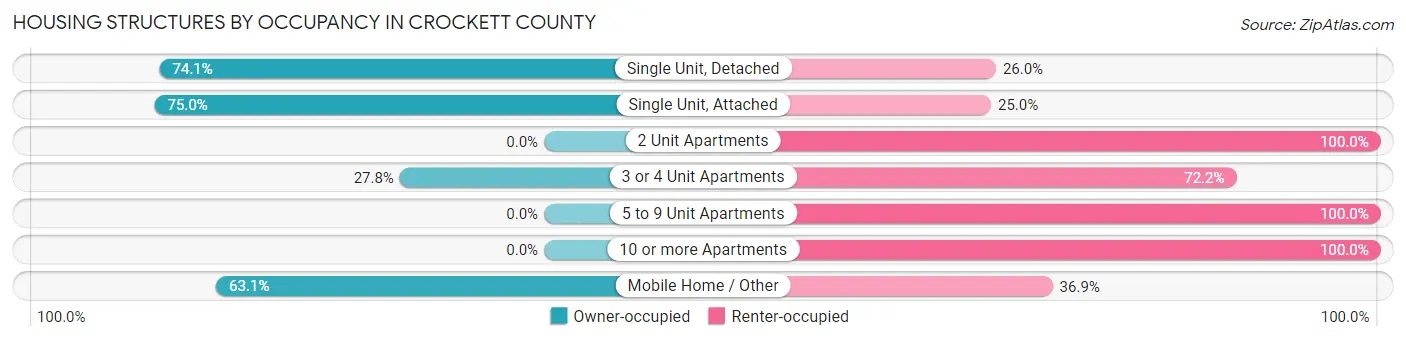
| Structure Type | Owner-occupied | Renter-occupied |
| Single Unit, Detached | 3,221 (74.1%) | 1,129 (26.0%) |
| Single Unit, Attached | 33 (75.0%) | 11 (25.0%) |
| 2 Unit Apartments | 0 (0.0%) | 208 (100.0%) |
| 3 or 4 Unit Apartments | 5 (27.8%) | 13 (72.2%) |
| 5 to 9 Unit Apartments | 0 (0.0%) | 30 (100.0%) |
| 10 or more Apartments | 0 (0.0%) | 24 (100.0%) |
| Mobile Home / Other | 464 (63.1%) | 271 (36.9%) |
| Total | 3,723 (68.8%) | 1,686 (31.2%) |
Housing Structures by Number of Rooms in Crockett County
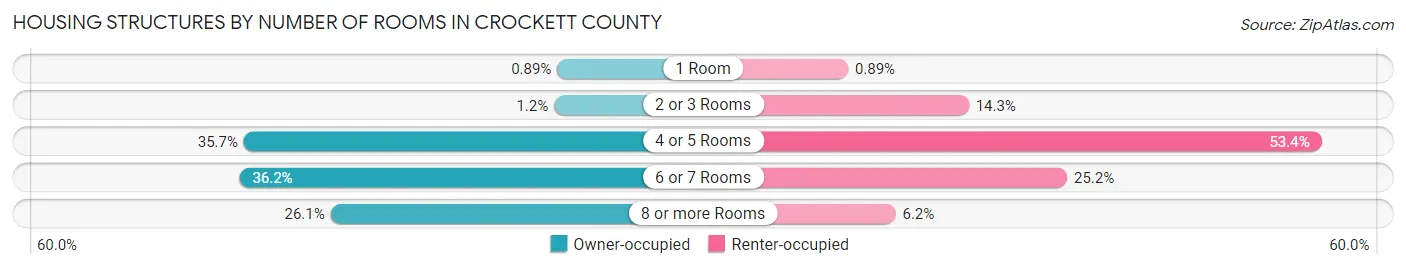
| Number of Rooms | Owner-occupied | Renter-occupied |
| 1 Room | 33 (0.9%) | 15 (0.9%) |
| 2 or 3 Rooms | 46 (1.2%) | 241 (14.3%) |
| 4 or 5 Rooms | 1,328 (35.7%) | 901 (53.4%) |
| 6 or 7 Rooms | 1,346 (36.1%) | 425 (25.2%) |
| 8 or more Rooms | 970 (26.1%) | 104 (6.2%) |
| Total | 3,723 (100.0%) | 1,686 (100.0%) |
Housing Structure by Heating Type in Crockett County
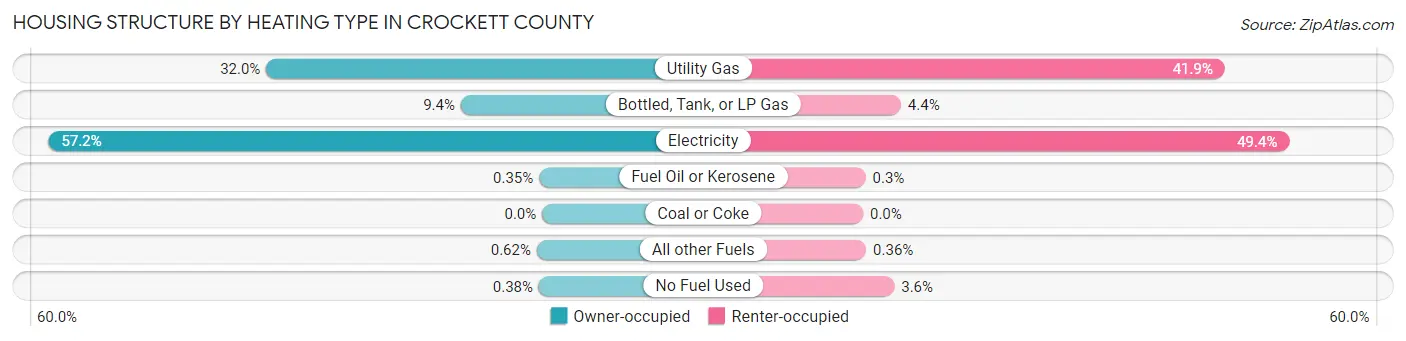
| Heating Type | Owner-occupied | Renter-occupied |
| Utility Gas | 1,191 (32.0%) | 707 (41.9%) |
| Bottled, Tank, or LP Gas | 351 (9.4%) | 74 (4.4%) |
| Electricity | 2,131 (57.2%) | 833 (49.4%) |
| Fuel Oil or Kerosene | 13 (0.4%) | 5 (0.3%) |
| Coal or Coke | 0 (0.0%) | 0 (0.0%) |
| All other Fuels | 23 (0.6%) | 6 (0.4%) |
| No Fuel Used | 14 (0.4%) | 61 (3.6%) |
| Total | 3,723 (100.0%) | 1,686 (100.0%) |
Household Vehicle Usage in Crockett County
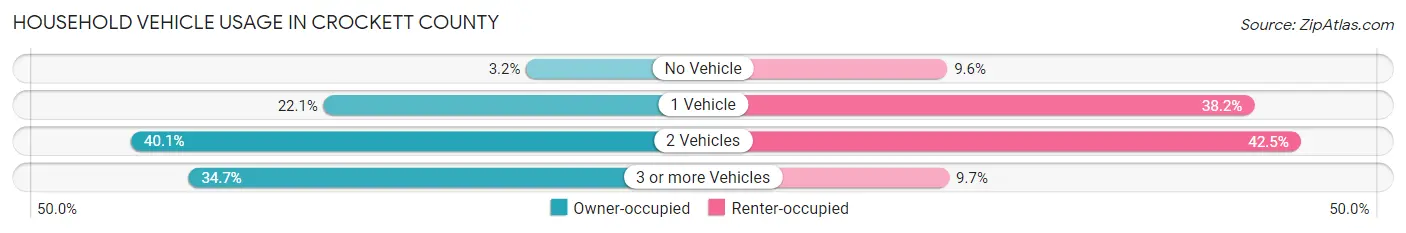
| Vehicles per Household | Owner-occupied | Renter-occupied |
| No Vehicle | 118 (3.2%) | 161 (9.6%) |
| 1 Vehicle | 822 (22.1%) | 644 (38.2%) |
| 2 Vehicles | 1,491 (40.1%) | 717 (42.5%) |
| 3 or more Vehicles | 1,292 (34.7%) | 164 (9.7%) |
| Total | 3,723 (100.0%) | 1,686 (100.0%) |
Real Estate & Mortgages in Crockett County
Real Estate and Mortgage Overview in Crockett County
| Characteristic | Without Mortgage | With Mortgage |
| Housing Units | 2,041 | 1,682 |
| Median Property Value | $115,400 | $149,500 |
| Median Household Income | $67,571 | $265 |
| Monthly Housing Costs | $453 | $23 |
| Real Estate Taxes | $743 | $91 |
Property Value by Mortgage Status in Crockett County
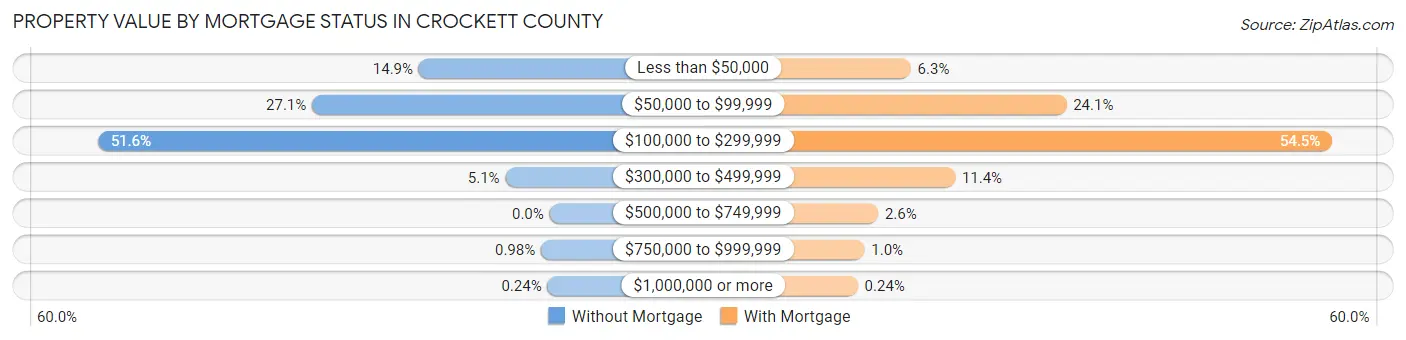
| Property Value | Without Mortgage | With Mortgage |
| Less than $50,000 | 305 (14.9%) | 106 (6.3%) |
| $50,000 to $99,999 | 554 (27.1%) | 405 (24.1%) |
| $100,000 to $299,999 | 1,054 (51.6%) | 916 (54.5%) |
| $300,000 to $499,999 | 103 (5.1%) | 191 (11.4%) |
| $500,000 to $749,999 | 0 (0.0%) | 43 (2.6%) |
| $750,000 to $999,999 | 20 (1.0%) | 17 (1.0%) |
| $1,000,000 or more | 5 (0.2%) | 4 (0.2%) |
| Total | 2,041 (100.0%) | 1,682 (100.0%) |
Household Income by Mortgage Status in Crockett County
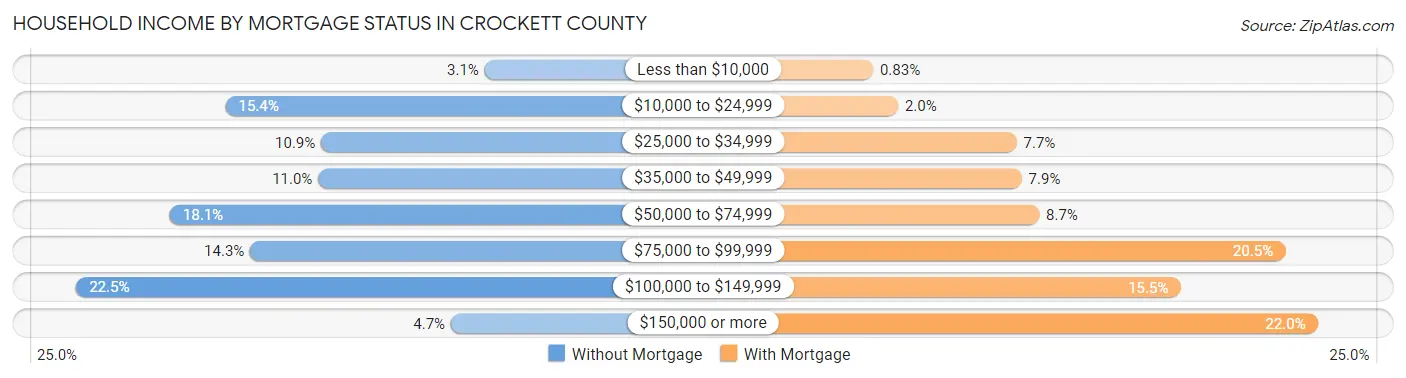
| Household Income | Without Mortgage | With Mortgage |
| Less than $10,000 | 63 (3.1%) | 14 (0.8%) |
| $10,000 to $24,999 | 315 (15.4%) | 34 (2.0%) |
| $25,000 to $34,999 | 222 (10.9%) | 129 (7.7%) |
| $35,000 to $49,999 | 225 (11.0%) | 133 (7.9%) |
| $50,000 to $74,999 | 369 (18.1%) | 147 (8.7%) |
| $75,000 to $99,999 | 291 (14.3%) | 344 (20.4%) |
| $100,000 to $149,999 | 460 (22.5%) | 260 (15.5%) |
| $150,000 or more | 96 (4.7%) | 370 (22.0%) |
| Total | 2,041 (100.0%) | 1,682 (100.0%) |
Property Value to Household Income Ratio in Crockett County
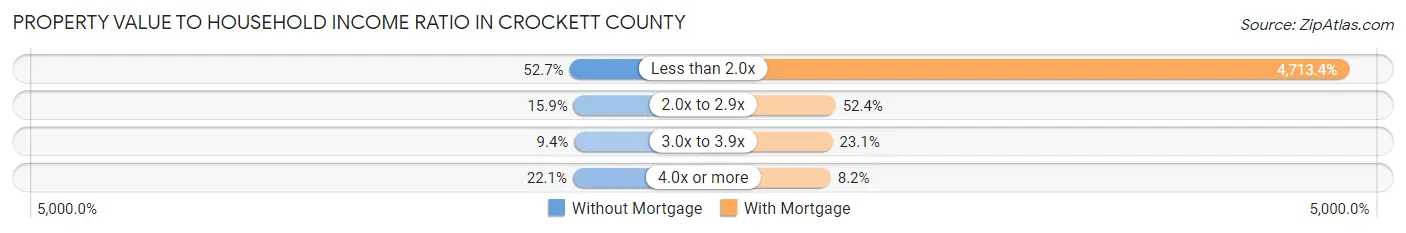
| Value-to-Income Ratio | Without Mortgage | With Mortgage |
| Less than 2.0x | 1,076 (52.7%) | 79,279 (4,713.4%) |
| 2.0x to 2.9x | 324 (15.9%) | 882 (52.4%) |
| 3.0x to 3.9x | 191 (9.4%) | 389 (23.1%) |
| 4.0x or more | 450 (22.1%) | 137 (8.2%) |
| Total | 2,041 (100.0%) | 1,682 (100.0%) |
Real Estate Taxes by Mortgage Status in Crockett County
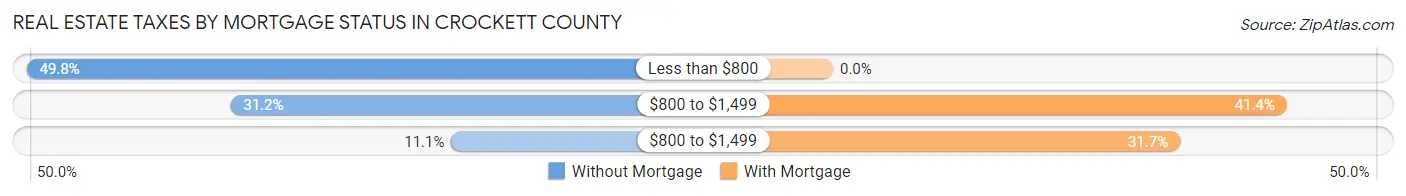
| Property Taxes | Without Mortgage | With Mortgage |
| Less than $800 | 1,017 (49.8%) | 0 (0.0%) |
| $800 to $1,499 | 637 (31.2%) | 697 (41.4%) |
| $800 to $1,499 | 227 (11.1%) | 533 (31.7%) |
| Total | 2,041 (100.0%) | 1,682 (100.0%) |
Health & Disability in Crockett County
Health Insurance Coverage by Age in Crockett County
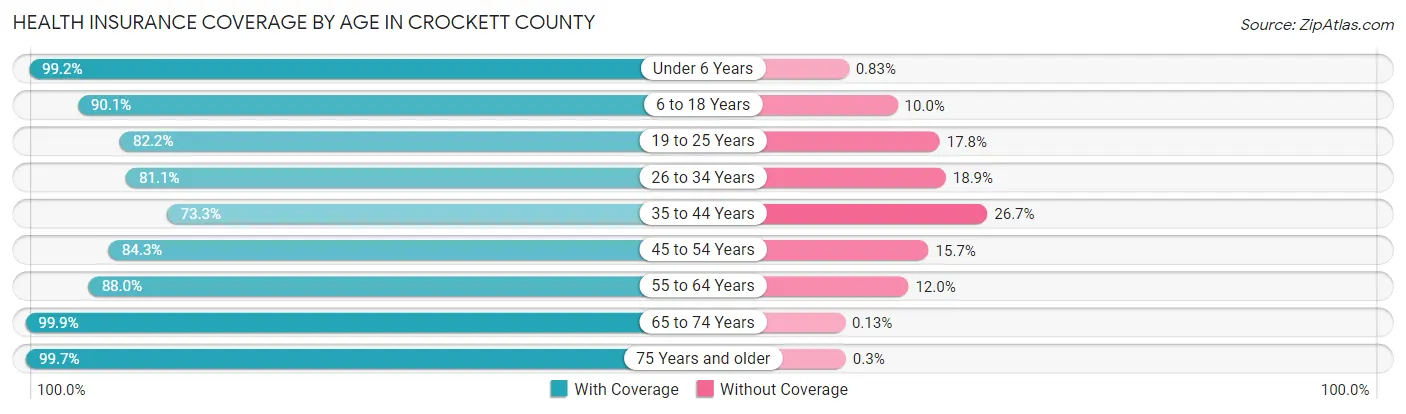
| Age Bracket | With Coverage | Without Coverage |
| Under 6 Years | 952 (99.2%) | 8 (0.8%) |
| 6 to 18 Years | 2,271 (90.0%) | 251 (10.0%) |
| 19 to 25 Years | 927 (82.2%) | 201 (17.8%) |
| 26 to 34 Years | 1,275 (81.1%) | 298 (18.9%) |
| 35 to 44 Years | 1,138 (73.3%) | 414 (26.7%) |
| 45 to 54 Years | 1,393 (84.3%) | 260 (15.7%) |
| 55 to 64 Years | 1,626 (88.0%) | 221 (12.0%) |
| 65 to 74 Years | 1,482 (99.9%) | 2 (0.1%) |
| 75 Years and older | 1,004 (99.7%) | 3 (0.3%) |
| Total | 12,068 (87.9%) | 1,658 (12.1%) |
Health Insurance Coverage by Citizenship Status in Crockett County
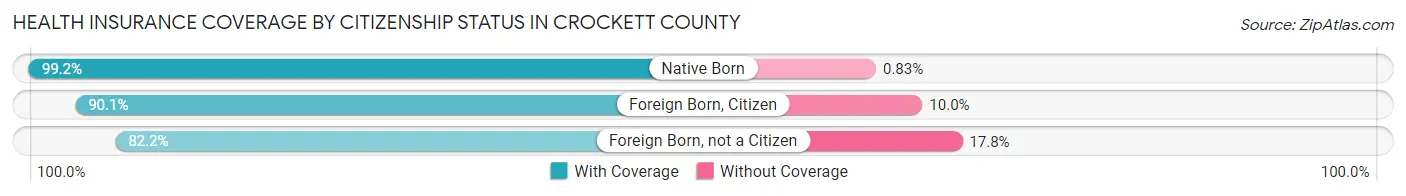
| Citizenship Status | With Coverage | Without Coverage |
| Native Born | 952 (99.2%) | 8 (0.8%) |
| Foreign Born, Citizen | 2,271 (90.0%) | 251 (10.0%) |
| Foreign Born, not a Citizen | 927 (82.2%) | 201 (17.8%) |
Health Insurance Coverage by Household Income in Crockett County
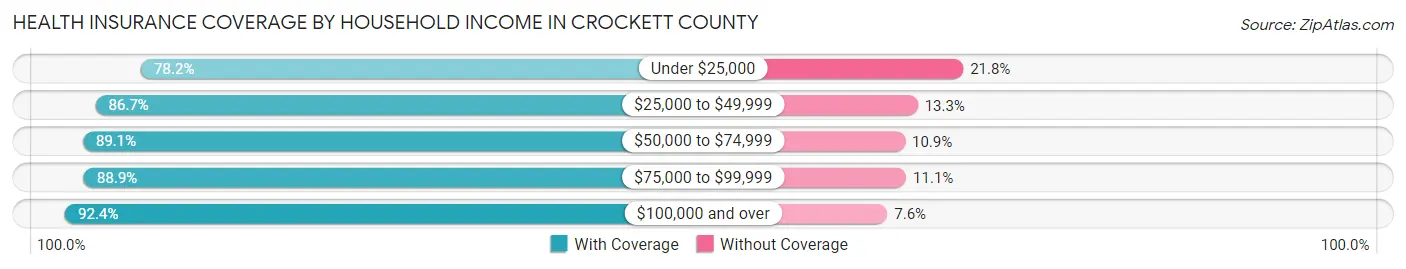
| Household Income | With Coverage | Without Coverage |
| Under $25,000 | 1,656 (78.2%) | 462 (21.8%) |
| $25,000 to $49,999 | 2,384 (86.7%) | 365 (13.3%) |
| $50,000 to $74,999 | 2,065 (89.1%) | 253 (10.9%) |
| $75,000 to $99,999 | 2,054 (88.9%) | 257 (11.1%) |
| $100,000 and over | 3,902 (92.4%) | 321 (7.6%) |
Public vs Private Health Insurance Coverage by Age in Crockett County
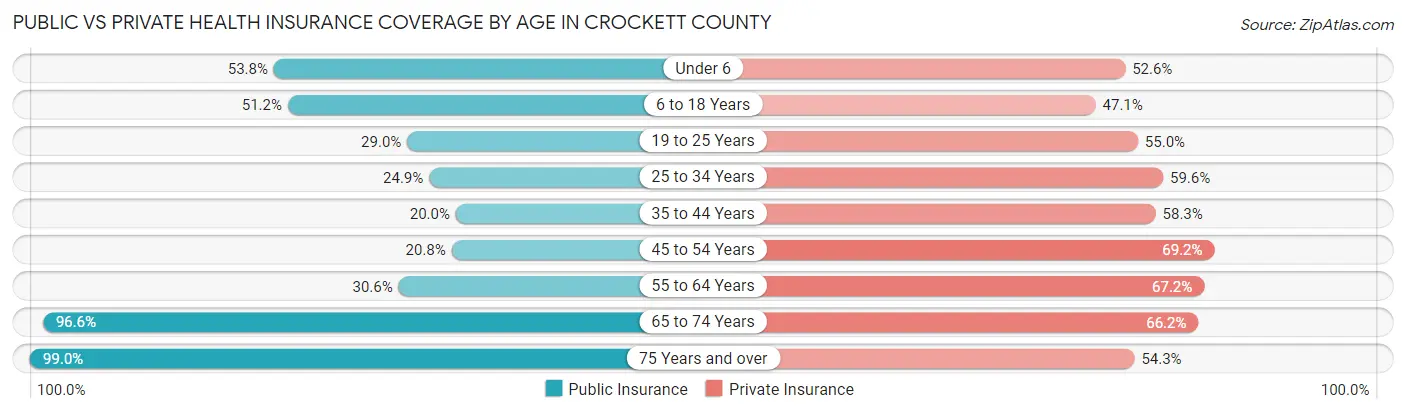
| Age Bracket | Public Insurance | Private Insurance |
| Under 6 | 516 (53.7%) | 505 (52.6%) |
| 6 to 18 Years | 1,290 (51.1%) | 1,188 (47.1%) |
| 19 to 25 Years | 327 (29.0%) | 620 (55.0%) |
| 25 to 34 Years | 392 (24.9%) | 938 (59.6%) |
| 35 to 44 Years | 310 (20.0%) | 904 (58.3%) |
| 45 to 54 Years | 343 (20.7%) | 1,143 (69.2%) |
| 55 to 64 Years | 565 (30.6%) | 1,242 (67.2%) |
| 65 to 74 Years | 1,434 (96.6%) | 982 (66.2%) |
| 75 Years and over | 997 (99.0%) | 547 (54.3%) |
| Total | 6,174 (45.0%) | 8,069 (58.8%) |
Disability Status by Sex by Age in Crockett County
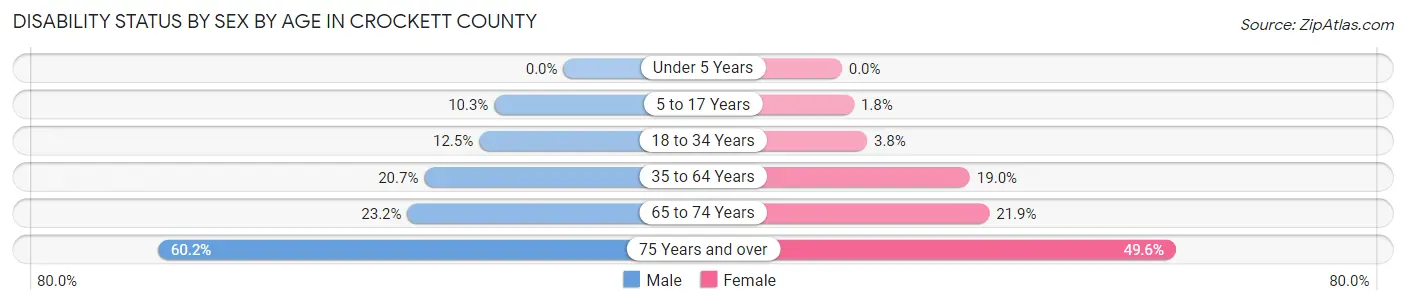
| Age Bracket | Male | Female |
| Under 5 Years | 0 (0.0%) | 0 (0.0%) |
| 5 to 17 Years | 124 (10.3%) | 23 (1.8%) |
| 18 to 34 Years | 178 (12.5%) | 55 (3.7%) |
| 35 to 64 Years | 504 (20.7%) | 497 (19.0%) |
| 65 to 74 Years | 183 (23.2%) | 152 (21.9%) |
| 75 Years and over | 236 (60.2%) | 305 (49.6%) |
Disability Class by Sex by Age in Crockett County
Disability Class: Hearing Difficulty
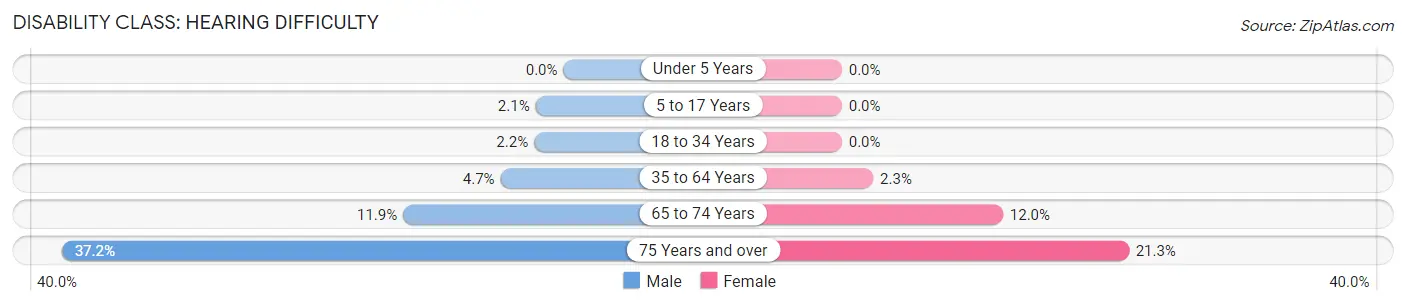
| Age Bracket | Male | Female |
| Under 5 Years | 0 (0.0%) | 0 (0.0%) |
| 5 to 17 Years | 25 (2.1%) | 0 (0.0%) |
| 18 to 34 Years | 31 (2.2%) | 0 (0.0%) |
| 35 to 64 Years | 114 (4.7%) | 61 (2.3%) |
| 65 to 74 Years | 94 (11.9%) | 83 (12.0%) |
| 75 Years and over | 146 (37.2%) | 131 (21.3%) |
Disability Class: Vision Difficulty
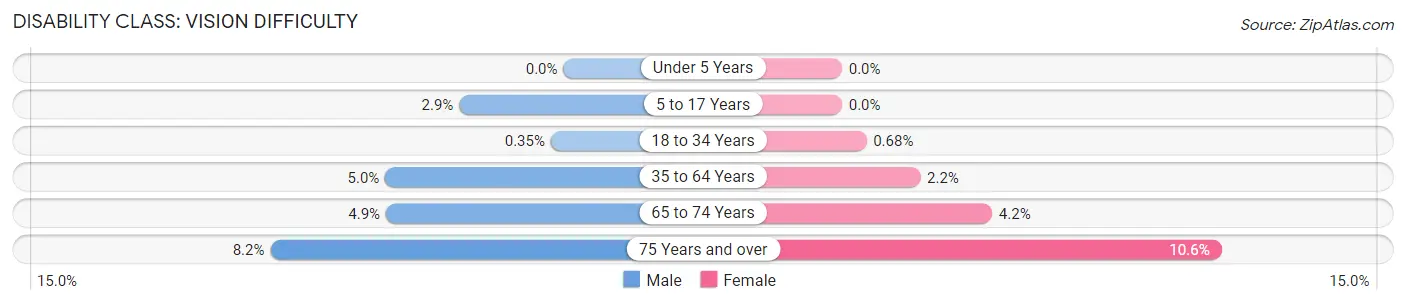
| Age Bracket | Male | Female |
| Under 5 Years | 0 (0.0%) | 0 (0.0%) |
| 5 to 17 Years | 35 (2.9%) | 0 (0.0%) |
| 18 to 34 Years | 5 (0.4%) | 10 (0.7%) |
| 35 to 64 Years | 121 (5.0%) | 57 (2.2%) |
| 65 to 74 Years | 39 (4.9%) | 29 (4.2%) |
| 75 Years and over | 32 (8.2%) | 65 (10.6%) |
Disability Class: Cognitive Difficulty
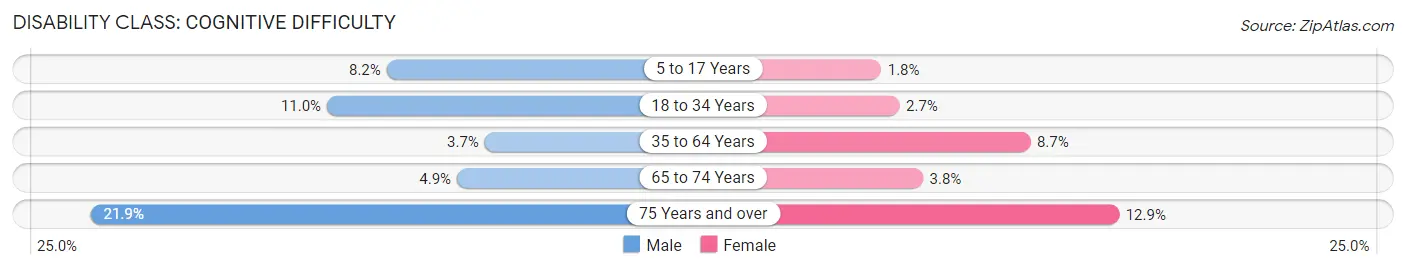
| Age Bracket | Male | Female |
| 5 to 17 Years | 99 (8.2%) | 23 (1.8%) |
| 18 to 34 Years | 156 (11.0%) | 39 (2.7%) |
| 35 to 64 Years | 89 (3.6%) | 228 (8.7%) |
| 65 to 74 Years | 39 (4.9%) | 26 (3.7%) |
| 75 Years and over | 86 (21.9%) | 79 (12.9%) |
Disability Class: Ambulatory Difficulty
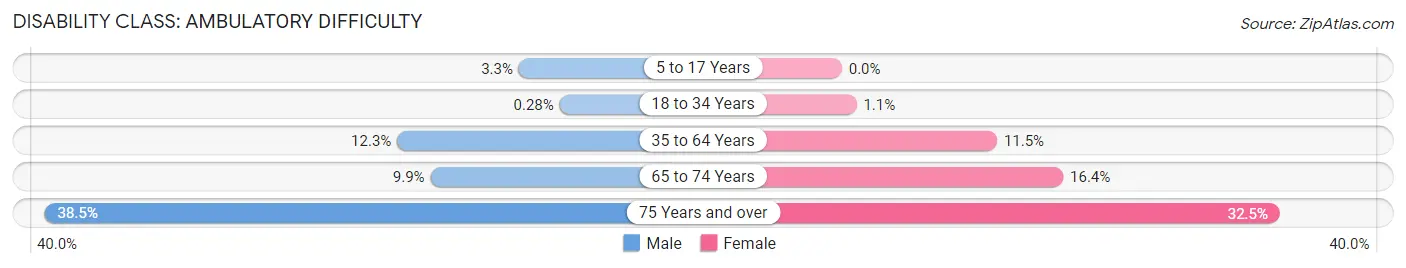
| Age Bracket | Male | Female |
| 5 to 17 Years | 40 (3.3%) | 0 (0.0%) |
| 18 to 34 Years | 4 (0.3%) | 16 (1.1%) |
| 35 to 64 Years | 301 (12.3%) | 301 (11.5%) |
| 65 to 74 Years | 78 (9.9%) | 114 (16.4%) |
| 75 Years and over | 151 (38.5%) | 200 (32.5%) |
Disability Class: Self-Care Difficulty
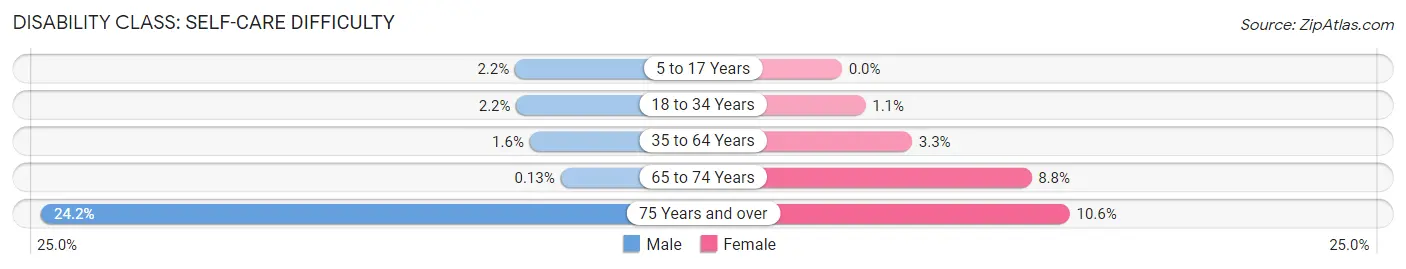
| Age Bracket | Male | Female |
| 5 to 17 Years | 27 (2.2%) | 0 (0.0%) |
| 18 to 34 Years | 31 (2.2%) | 16 (1.1%) |
| 35 to 64 Years | 38 (1.6%) | 85 (3.3%) |
| 65 to 74 Years | 1 (0.1%) | 61 (8.8%) |
| 75 Years and over | 95 (24.2%) | 65 (10.6%) |
Technology Access in Crockett County
Computing Device Access in Crockett County
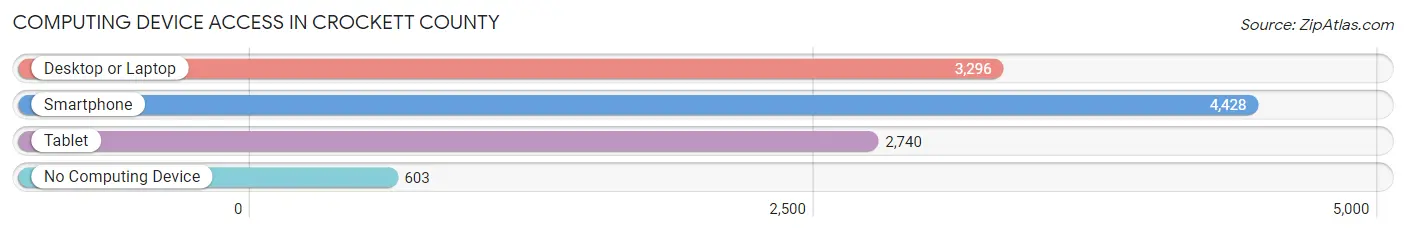
| Device Type | # Households | % Households |
| Desktop or Laptop | 3,296 | 60.9% |
| Smartphone | 4,428 | 81.9% |
| Tablet | 2,740 | 50.7% |
| No Computing Device | 603 | 11.2% |
| Total | 5,409 | 100.0% |
Internet Access in Crockett County
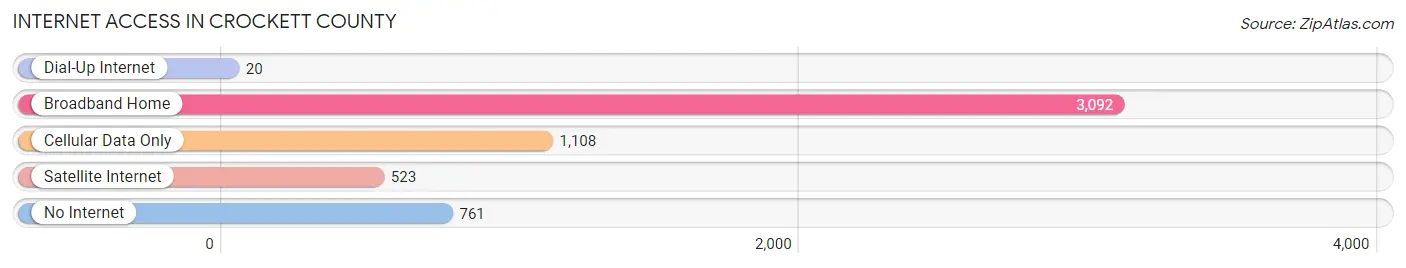
| Internet Type | # Households | % Households |
| Dial-Up Internet | 20 | 0.4% |
| Broadband Home | 3,092 | 57.2% |
| Cellular Data Only | 1,108 | 20.5% |
| Satellite Internet | 523 | 9.7% |
| No Internet | 761 | 14.1% |
| Total | 5,409 | 100.0% |
Crockett County Summary
Crockett County is located in the western part of Tennessee, in the United States. It is bordered by Madison County to the north, Haywood County to the east, Gibson County to the south, and Dyer County to the west. The county seat is Alamo, and the largest city is Bells. The county was named after David Crockett, a famous frontiersman and politician.
History
Crockett County was established in 1871 from parts of Haywood and Madison counties. It was named after David Crockett, a famous frontiersman and politician who represented Tennessee in the United States House of Representatives. The county was originally part of the Chickasaw Cession of 1818, which was a treaty between the Chickasaw Nation and the United States government.
The county was largely rural until the early 20th century, when the lumber industry began to boom. The lumber industry brought jobs and economic growth to the area, and the population began to grow. The county was also home to several cotton plantations, which were important to the local economy.
In the late 19th century, the county was home to several African-American churches, schools, and businesses. The county was also home to several African-American newspapers, including the Crockett County News and the Crockett County Star.
Geography
Crockett County is located in the western part of Tennessee, in the United States. It is bordered by Madison County to the north, Haywood County to the east, Gibson County to the south, and Dyer County to the west. The county has a total area of 517 square miles, of which 514 square miles is land and 3 square miles is water.
The county is mostly flat, with some rolling hills in the northern and eastern parts. The highest point in the county is located in the northern part, at an elevation of 890 feet. The county is drained by the Forked Deer River, which flows through the county from north to south.
Economy
The economy of Crockett County is largely based on agriculture and manufacturing. The county is home to several large farms, which produce corn, soybeans, cotton, and other crops. The county is also home to several manufacturing plants, which produce a variety of products, including furniture, clothing, and automotive parts.
The county is also home to several tourist attractions, including the David Crockett State Park, the Crockett County Museum, and the Crockett County Fair. These attractions bring in visitors from all over the state and the country.
Demographics
As of the 2010 United States Census, there were 14,586 people, 5,717 households, and 4,039 families living in the county. The population density was 28.5 people per square mile. The racial makeup of the county was 87.2% White, 9.7% Black or African American, 0.3% Native American, 0.3% Asian, 0.1% Pacific Islander, 1.2% from other races, and 1.3% from two or more races.
The median income for a household in the county was $35,945, and the median income for a family was $43,945. The per capita income for the county was $17,845. About 17.2% of the population was below the poverty line.
Conclusion
Crockett County is located in the western part of Tennessee, in the United States. It was established in 1871 and named after David Crockett, a famous frontiersman and politician. The county is mostly flat, with some rolling hills in the northern and eastern parts. The economy of the county is largely based on agriculture and manufacturing, and it is home to several tourist attractions. As of the 2010 United States Census, the population of the county was 14,586. The median income for a household in the county was $35,945, and the per capita income was $17,845.
Common Questions
What is Per Capita Income in Crockett County?
Per Capita income in Crockett County is $30,362.
What is the Median Family Income in Crockett County?
Median Family Income in Crockett County is $71,375.
What is the Median Household income in Crockett County?
Median Household Income in Crockett County is $59,136.
What is Income or Wage Gap in Crockett County?
Income or Wage Gap in Crockett County is 19.6%.
Women in Crockett County earn 80.4 cents for every dollar earned by a man.
What is Family Income Deficit in Crockett County?
Family Income Deficit in Crockett County is $8,952.
Families that are below poverty line in Crockett County earn $8,952 less on average than the poverty threshold level.
What is Inequality or Gini Index in Crockett County?
Inequality or Gini Index in Crockett County is 0.44.
What is the Total Population of Crockett County?
Total Population of Crockett County is 13,955.
What is the Total Male Population of Crockett County?
Total Male Population of Crockett County is 6,853.
What is the Total Female Population of Crockett County?
Total Female Population of Crockett County is 7,102.
What is the Ratio of Males per 100 Females in Crockett County?
There are 96.49 Males per 100 Females in Crockett County.
What is the Ratio of Females per 100 Males in Crockett County?
There are 103.63 Females per 100 Males in Crockett County.
What is the Median Population Age in Crockett County?
Median Population Age in Crockett County is 40.2 Years.
What is the Average Family Size in Crockett County
Average Family Size in Crockett County is 3.0 People.
What is the Average Household Size in Crockett County
Average Household Size in Crockett County is 2.5 People.
How Large is the Labor Force in Crockett County?
There are 6,713 People in the Labor Forcein in Crockett County.
What is the Percentage of People in the Labor Force in Crockett County?
61.1% of People are in the Labor Force in Crockett County.
What is the Unemployment Rate in Crockett County?
Unemployment Rate in Crockett County is 3.8%.