Cheatham County, TN Map & Demographics
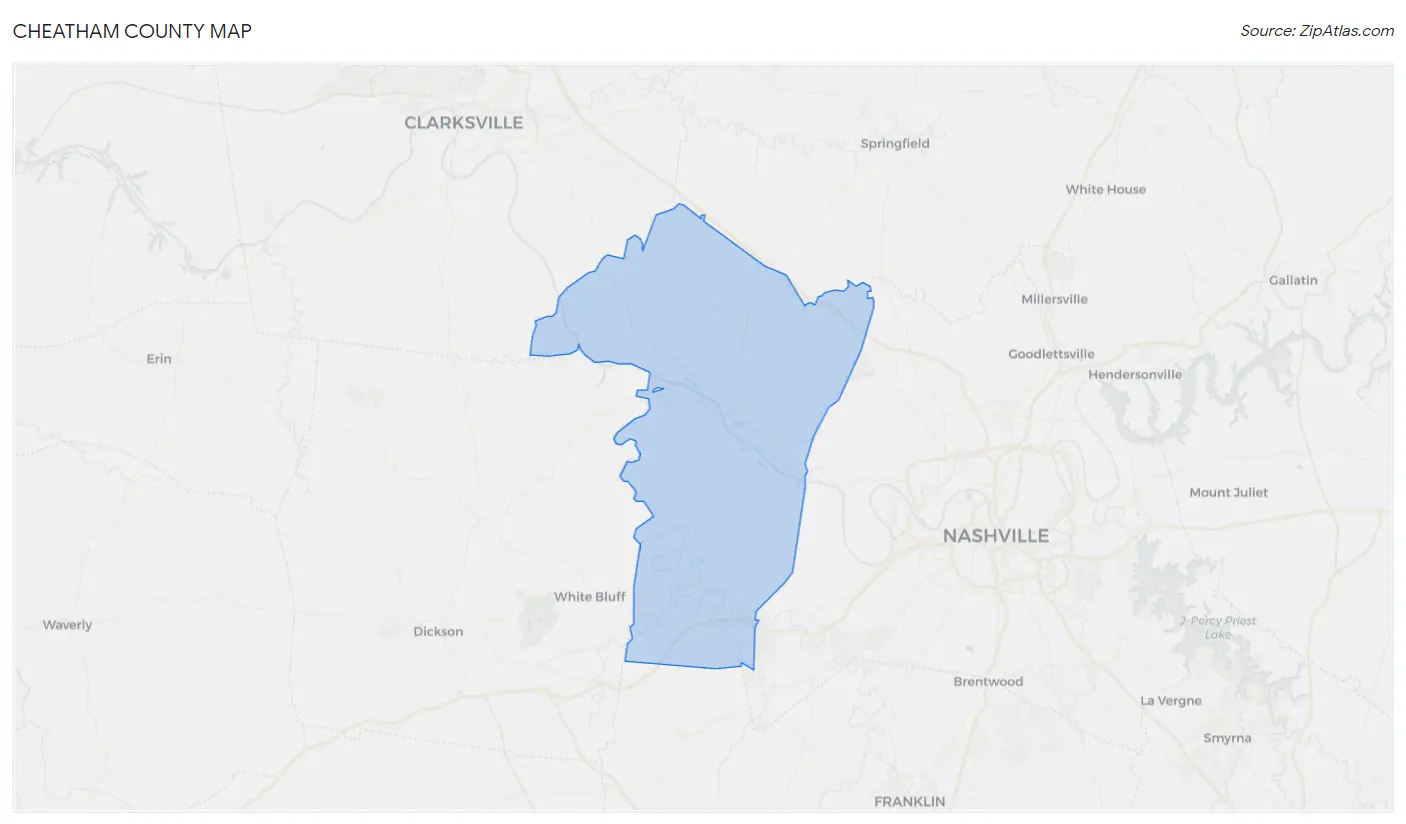
Cheatham County Map
Cheatham County Overview
$35,852
PER CAPITA INCOME
$87,184
AVG FAMILY INCOME
$77,014
AVG HOUSEHOLD INCOME
23.8%
WAGE / INCOME GAP [ % ]
76.2¢/ $1
WAGE / INCOME GAP [ $ ]
$11,566
FAMILY INCOME DEFICIT
0.40
INEQUALITY / GINI INDEX
41,184
TOTAL POPULATION
20,853
MALE POPULATION
20,331
FEMALE POPULATION
102.57
MALES / 100 FEMALES
97.50
FEMALES / 100 MALES
40.9
MEDIAN AGE
3.0
AVG FAMILY SIZE
2.6
AVG HOUSEHOLD SIZE
21,635
LABOR FORCE [ PEOPLE ]
64.8%
PERCENT IN LABOR FORCE
3.7%
UNEMPLOYMENT RATE
Income in Cheatham County
Income Overview in Cheatham County
Per Capita Income in Cheatham County is $35,852, while median incomes of families and households are $87,184 and $77,014 respectively.
| Characteristic | Number | Measure |
| Per Capita Income | 41,184 | $35,852 |
| Median Family Income | 11,377 | $87,184 |
| Mean Family Income | 11,377 | $102,149 |
| Median Household Income | 15,708 | $77,014 |
| Mean Household Income | 15,708 | $92,149 |
| Income Deficit | 11,377 | $11,566 |
| Wage / Income Gap (%) | 41,184 | 23.84% |
| Wage / Income Gap ($) | 41,184 | 76.16¢ per $1 |
| Gini / Inequality Index | 41,184 | 0.40 |
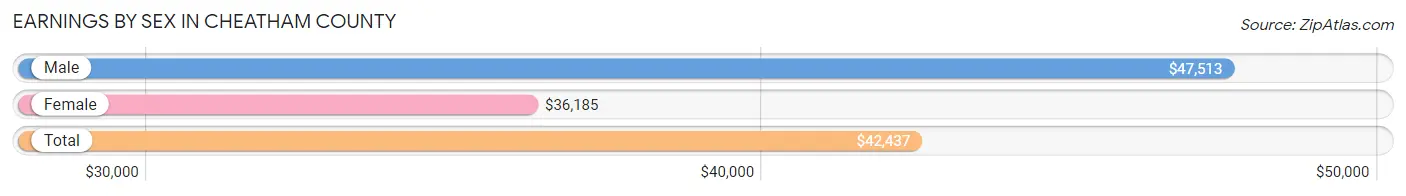
Earnings by Sex in Cheatham County
Average Earnings in Cheatham County are $42,437, $47,513 for men and $36,185 for women, a difference of 23.8%.
| Sex | Number | Average Earnings |
| Male | 12,227 (53.7%) | $47,513 |
| Female | 10,555 (46.3%) | $36,185 |
| Total | 22,782 (100.0%) | $42,437 |
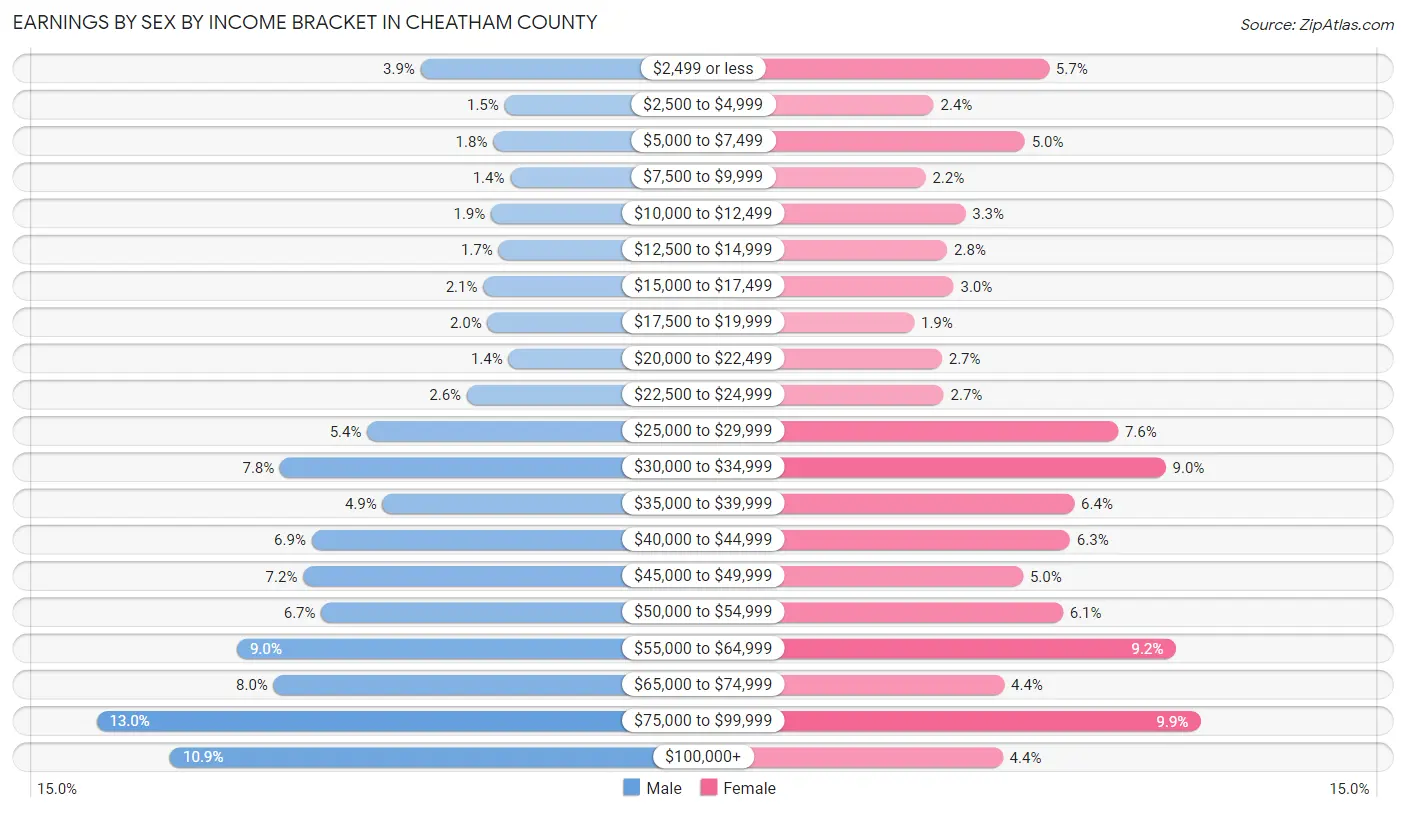
Earnings by Sex by Income Bracket in Cheatham County
The most common earnings brackets in Cheatham County are $75,000 to $99,999 for men (1,587 | 13.0%) and $75,000 to $99,999 for women (1,048 | 9.9%).
| Income | Male | Female |
| $2,499 or less | 473 (3.9%) | 599 (5.7%) |
| $2,500 to $4,999 | 185 (1.5%) | 258 (2.4%) |
| $5,000 to $7,499 | 224 (1.8%) | 528 (5.0%) |
| $7,500 to $9,999 | 165 (1.3%) | 233 (2.2%) |
| $10,000 to $12,499 | 231 (1.9%) | 352 (3.3%) |
| $12,500 to $14,999 | 206 (1.7%) | 298 (2.8%) |
| $15,000 to $17,499 | 258 (2.1%) | 317 (3.0%) |
| $17,500 to $19,999 | 243 (2.0%) | 200 (1.9%) |
| $20,000 to $22,499 | 171 (1.4%) | 282 (2.7%) |
| $22,500 to $24,999 | 314 (2.6%) | 287 (2.7%) |
| $25,000 to $29,999 | 656 (5.4%) | 804 (7.6%) |
| $30,000 to $34,999 | 956 (7.8%) | 946 (9.0%) |
| $35,000 to $39,999 | 604 (4.9%) | 674 (6.4%) |
| $40,000 to $44,999 | 847 (6.9%) | 662 (6.3%) |
| $45,000 to $49,999 | 877 (7.2%) | 523 (5.0%) |
| $50,000 to $54,999 | 814 (6.7%) | 641 (6.1%) |
| $55,000 to $64,999 | 1,104 (9.0%) | 974 (9.2%) |
| $65,000 to $74,999 | 978 (8.0%) | 467 (4.4%) |
| $75,000 to $99,999 | 1,587 (13.0%) | 1,048 (9.9%) |
| $100,000+ | 1,334 (10.9%) | 462 (4.4%) |
| Total | 12,227 (100.0%) | 10,555 (100.0%) |
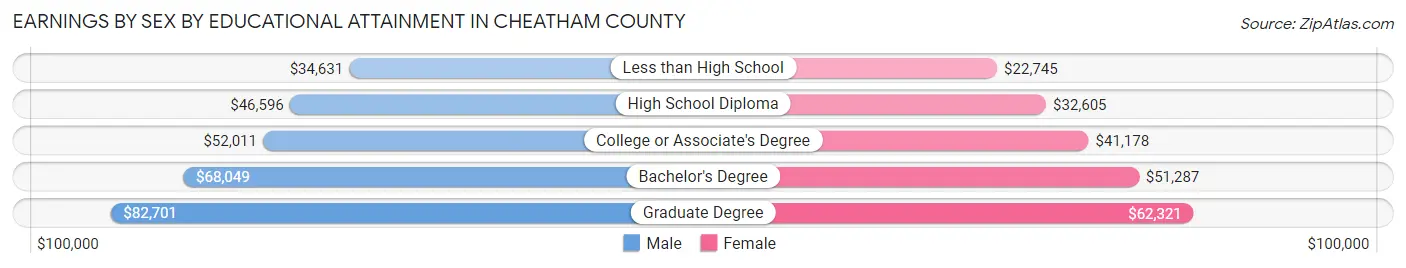
Earnings by Sex by Educational Attainment in Cheatham County
Average earnings in Cheatham County are $51,204 for men and $40,245 for women, a difference of 21.4%. Men with an educational attainment of graduate degree enjoy the highest average annual earnings of $82,701, while those with less than high school education earn the least with $34,631. Women with an educational attainment of graduate degree earn the most with the average annual earnings of $62,321, while those with less than high school education have the smallest earnings of $22,745.
| Educational Attainment | Male Income | Female Income |
| Less than High School | $34,631 | $22,745 |
| High School Diploma | $46,596 | $32,605 |
| College or Associate's Degree | $52,011 | $41,178 |
| Bachelor's Degree | $68,049 | $51,287 |
| Graduate Degree | $82,701 | $62,321 |
| Total | $51,204 | $40,245 |
Family Income in Cheatham County
Family Income Brackets in Cheatham County
According to the Cheatham County family income data, there are 2,969 families falling into the $100,000 to $149,999 income range, which is the most common income bracket and makes up 26.1% of all families. Conversely, the $10,000 to $14,999 income bracket is the least frequent group with only 91 families (0.8%) belonging to this category.
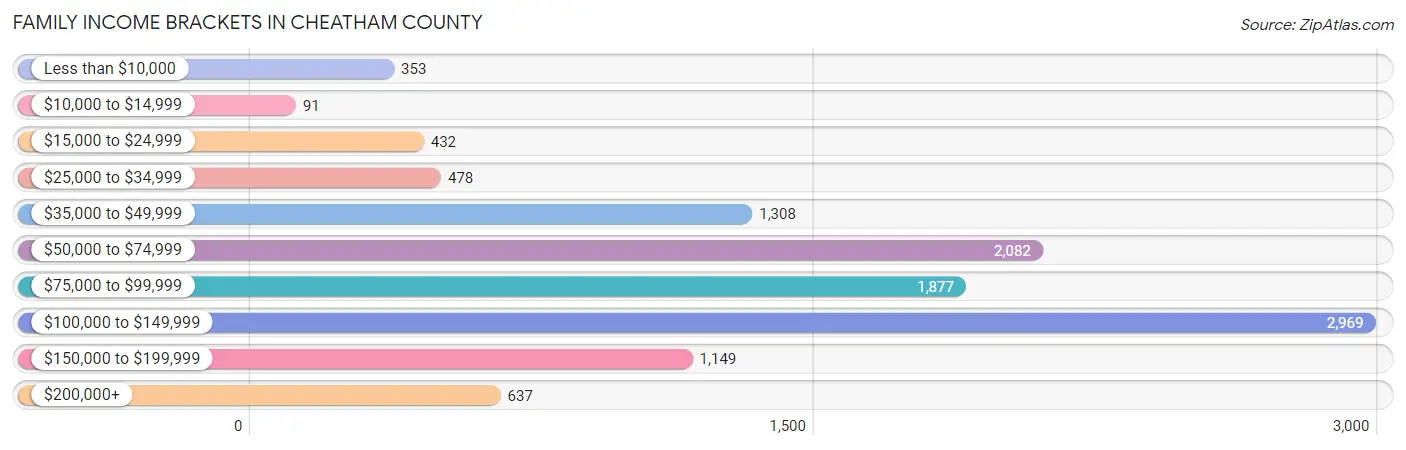
| Income Bracket | # Families | % Families |
| Less than $10,000 | 353 | 3.1% |
| $10,000 to $14,999 | 91 | 0.8% |
| $15,000 to $24,999 | 432 | 3.8% |
| $25,000 to $34,999 | 478 | 4.2% |
| $35,000 to $49,999 | 1,308 | 11.5% |
| $50,000 to $74,999 | 2,082 | 18.3% |
| $75,000 to $99,999 | 1,877 | 16.5% |
| $100,000 to $149,999 | 2,969 | 26.1% |
| $150,000 to $199,999 | 1,149 | 10.1% |
| $200,000+ | 637 | 5.6% |
Family Income by Famaliy Size in Cheatham County
7+ person families (235 | 2.1%) account for the highest median family income in Cheatham County with $133,859 per family, while 2-person families (5,507 | 48.4%) have the highest median income of $38,252 per family member.
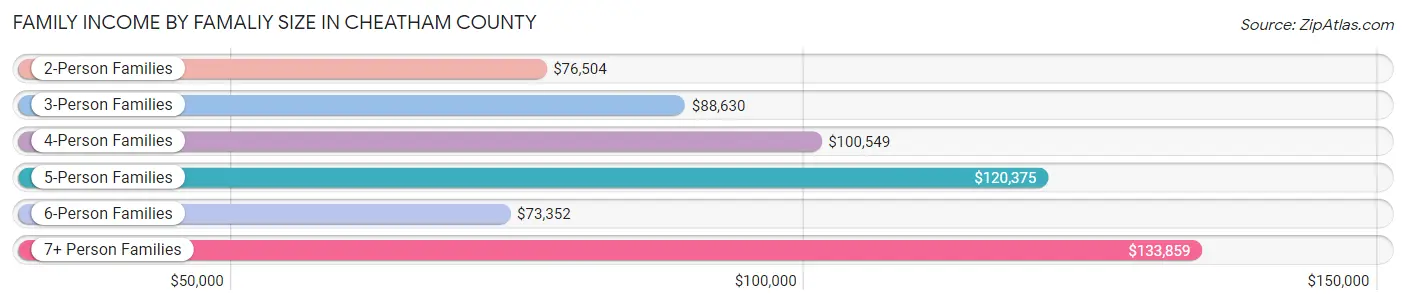
| Income Bracket | # Families | Median Income |
| 2-Person Families | 5,507 (48.4%) | $76,504 |
| 3-Person Families | 2,847 (25.0%) | $88,630 |
| 4-Person Families | 1,662 (14.6%) | $100,549 |
| 5-Person Families | 742 (6.5%) | $120,375 |
| 6-Person Families | 384 (3.4%) | $73,352 |
| 7+ Person Families | 235 (2.1%) | $133,859 |
| Total | 11,377 (100.0%) | $87,184 |
Family Income by Number of Earners in Cheatham County
The median family income in Cheatham County is $87,184, with families comprising 3+ earners (1,348) having the highest median family income of $139,063, while families with no earners (1,340) have the lowest median family income of $45,154, accounting for 11.8% and 11.8% of families, respectively.
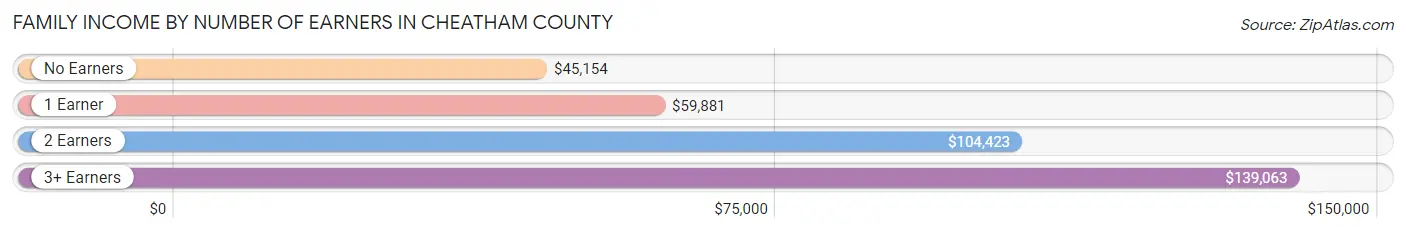
| Number of Earners | # Families | Median Income |
| No Earners | 1,340 (11.8%) | $45,154 |
| 1 Earner | 3,676 (32.3%) | $59,881 |
| 2 Earners | 5,013 (44.1%) | $104,423 |
| 3+ Earners | 1,348 (11.8%) | $139,063 |
| Total | 11,377 (100.0%) | $87,184 |
Household Income in Cheatham County
Household Income Brackets in Cheatham County
With 3,707 households falling in the category, the $100,000 to $149,999 income range is the most frequent in Cheatham County, accounting for 23.6% of all households. In contrast, only 298 households (1.9%) fall into the $10,000 to $14,999 income bracket, making it the least populous group.
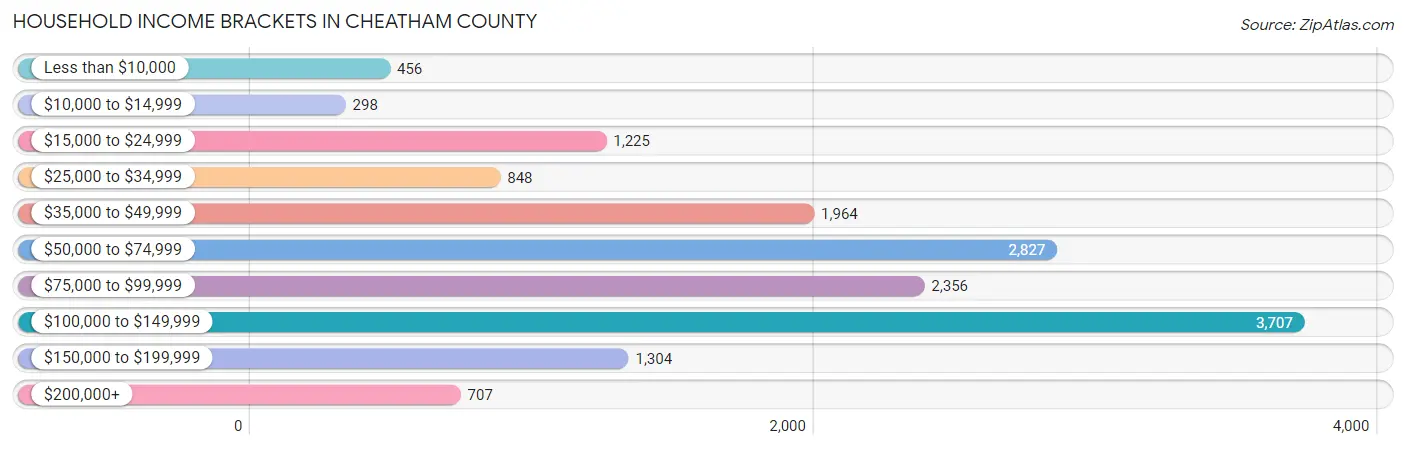
| Income Bracket | # Households | % Households |
| Less than $10,000 | 456 | 2.9% |
| $10,000 to $14,999 | 298 | 1.9% |
| $15,000 to $24,999 | 1,225 | 7.8% |
| $25,000 to $34,999 | 848 | 5.4% |
| $35,000 to $49,999 | 1,964 | 12.5% |
| $50,000 to $74,999 | 2,827 | 18.0% |
| $75,000 to $99,999 | 2,356 | 15.0% |
| $100,000 to $149,999 | 3,707 | 23.6% |
| $150,000 to $199,999 | 1,304 | 8.3% |
| $200,000+ | 707 | 4.5% |
Household Income by Householder Age in Cheatham County
The median household income in Cheatham County is $77,014, with the highest median household income of $87,188 found in the 45 to 64 years age bracket for the primary householder. A total of 6,800 households (43.3%) fall into this category. Meanwhile, the 65+ years age bracket for the primary householder has the lowest median household income of $54,189, with 3,872 households (24.6%) in this group.
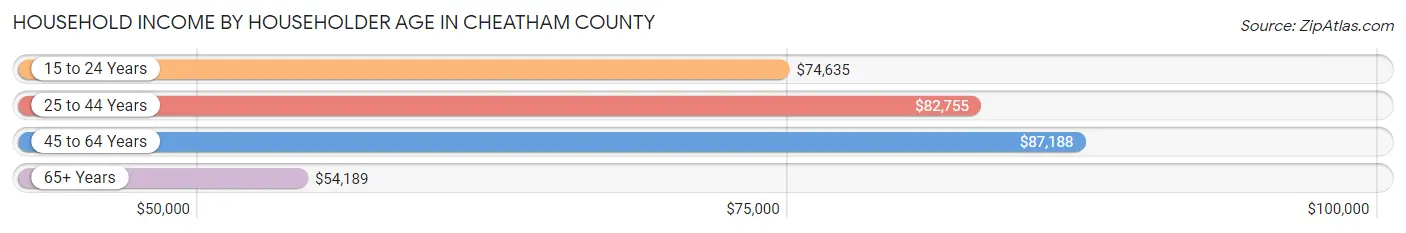
| Income Bracket | # Households | Median Income |
| 15 to 24 Years | 307 (1.9%) | $74,635 |
| 25 to 44 Years | 4,729 (30.1%) | $82,755 |
| 45 to 64 Years | 6,800 (43.3%) | $87,188 |
| 65+ Years | 3,872 (24.6%) | $54,189 |
| Total | 15,708 (100.0%) | $77,014 |
Poverty in Cheatham County
Income Below Poverty by Sex and Age in Cheatham County
With 6.4% poverty level for males and 12.4% for females among the residents of Cheatham County, 5 year old males and 18 to 24 year old females are the most vulnerable to poverty, with 33 males (16.2%) and 366 females (26.1%) in their respective age groups living below the poverty level.
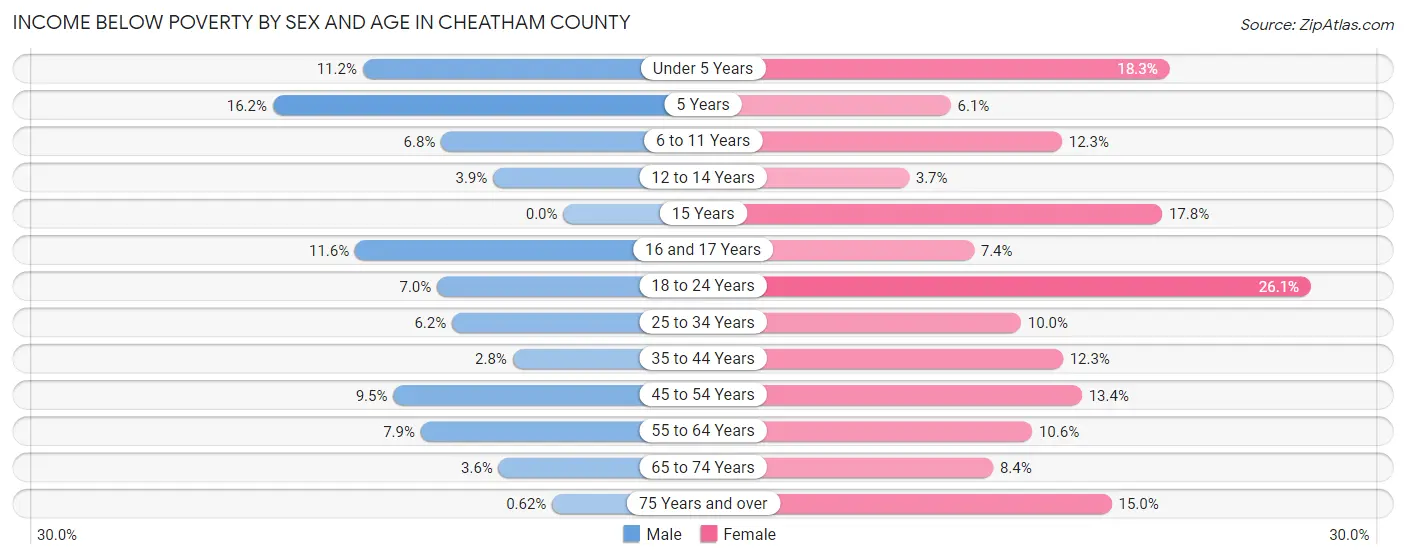
| Age Bracket | Male | Female |
| Under 5 Years | 138 (11.2%) | 186 (18.2%) |
| 5 Years | 33 (16.2%) | 10 (6.1%) |
| 6 to 11 Years | 93 (6.8%) | 137 (12.2%) |
| 12 to 14 Years | 36 (3.9%) | 33 (3.7%) |
| 15 Years | 0 (0.0%) | 46 (17.8%) |
| 16 and 17 Years | 55 (11.6%) | 41 (7.3%) |
| 18 to 24 Years | 111 (7.0%) | 366 (26.1%) |
| 25 to 34 Years | 165 (6.2%) | 254 (10.0%) |
| 35 to 44 Years | 74 (2.8%) | 336 (12.3%) |
| 45 to 54 Years | 286 (9.5%) | 382 (13.4%) |
| 55 to 64 Years | 245 (7.9%) | 347 (10.6%) |
| 65 to 74 Years | 74 (3.6%) | 175 (8.4%) |
| 75 Years and over | 6 (0.6%) | 173 (15.0%) |
| Total | 1,316 (6.4%) | 2,486 (12.4%) |
Income Above Poverty by Sex and Age in Cheatham County
According to the poverty statistics in Cheatham County, males aged 15 years and females aged 12 to 14 years are the age groups that are most secure financially, with 100.0% of males and 96.3% of females in these age groups living above the poverty line.
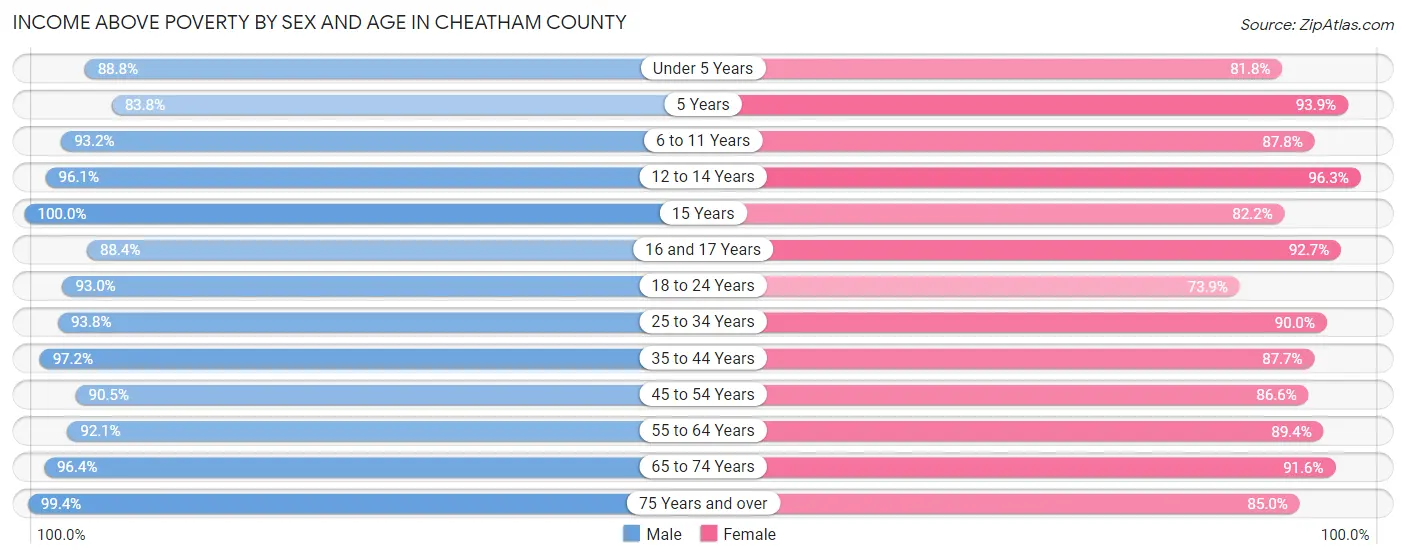
| Age Bracket | Male | Female |
| Under 5 Years | 1,097 (88.8%) | 833 (81.8%) |
| 5 Years | 171 (83.8%) | 155 (93.9%) |
| 6 to 11 Years | 1,274 (93.2%) | 981 (87.7%) |
| 12 to 14 Years | 885 (96.1%) | 851 (96.3%) |
| 15 Years | 445 (100.0%) | 212 (82.2%) |
| 16 and 17 Years | 419 (88.4%) | 517 (92.6%) |
| 18 to 24 Years | 1,469 (93.0%) | 1,035 (73.9%) |
| 25 to 34 Years | 2,497 (93.8%) | 2,293 (90.0%) |
| 35 to 44 Years | 2,553 (97.2%) | 2,396 (87.7%) |
| 45 to 54 Years | 2,733 (90.5%) | 2,477 (86.6%) |
| 55 to 64 Years | 2,842 (92.1%) | 2,931 (89.4%) |
| 65 to 74 Years | 1,982 (96.4%) | 1,903 (91.6%) |
| 75 Years and over | 965 (99.4%) | 979 (85.0%) |
| Total | 19,332 (93.6%) | 17,563 (87.6%) |
Income Below Poverty Among Married-Couple Families in Cheatham County
The poverty statistics for married-couple families in Cheatham County show that 3.5% or 304 of the total 8,683 families live below the poverty line. Families with 3 or 4 children have the highest poverty rate of 5.9%, comprising of 41 families. On the other hand, families with 5 or more children have the lowest poverty rate of 0.0%, which includes 0 families.
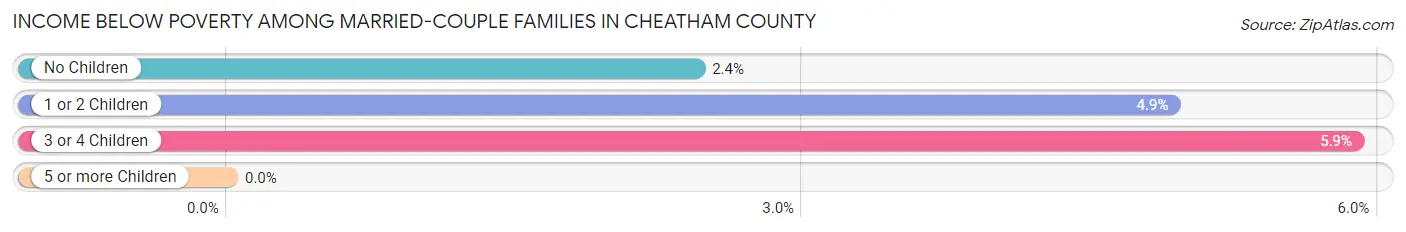
| Children | Above Poverty | Below Poverty |
| No Children | 5,071 (97.6%) | 127 (2.4%) |
| 1 or 2 Children | 2,629 (95.1%) | 136 (4.9%) |
| 3 or 4 Children | 656 (94.1%) | 41 (5.9%) |
| 5 or more Children | 23 (100.0%) | 0 (0.0%) |
| Total | 8,379 (96.5%) | 304 (3.5%) |
Income Below Poverty Among Single-Parent Households in Cheatham County
According to the poverty data in Cheatham County, 6.3% or 65 single-father households and 24.5% or 407 single-mother households are living below the poverty line. Among single-father households, those with no children have the highest poverty rate, with 56 households (14.1%) experiencing poverty. Likewise, among single-mother households, those with 1 or 2 children have the highest poverty rate, with 252 households (29.5%) falling below the poverty line.
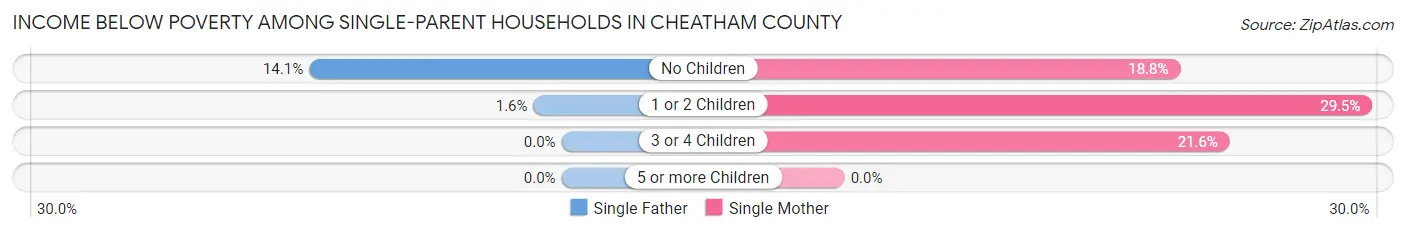
| Children | Single Father | Single Mother |
| No Children | 56 (14.1%) | 133 (18.8%) |
| 1 or 2 Children | 9 (1.6%) | 252 (29.5%) |
| 3 or 4 Children | 0 (0.0%) | 22 (21.6%) |
| 5 or more Children | 0 (0.0%) | 0 (0.0%) |
| Total | 65 (6.3%) | 407 (24.5%) |
Income Below Poverty Among Married-Couple vs Single-Parent Households in Cheatham County
The poverty data for Cheatham County shows that 304 of the married-couple family households (3.5%) and 472 of the single-parent households (17.5%) are living below the poverty level. Within the married-couple family households, those with 3 or 4 children have the highest poverty rate, with 41 households (5.9%) falling below the poverty line. Among the single-parent households, those with 1 or 2 children have the highest poverty rate, with 261 household (18.3%) living below poverty.
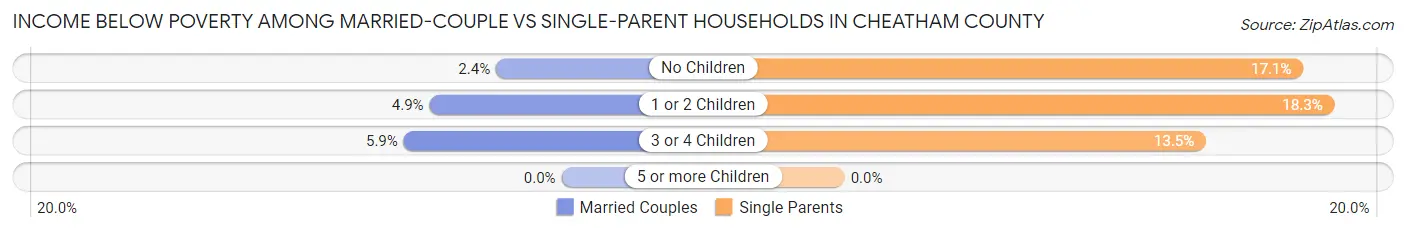
| Children | Married-Couple Families | Single-Parent Households |
| No Children | 127 (2.4%) | 189 (17.1%) |
| 1 or 2 Children | 136 (4.9%) | 261 (18.3%) |
| 3 or 4 Children | 41 (5.9%) | 22 (13.5%) |
| 5 or more Children | 0 (0.0%) | 0 (0.0%) |
| Total | 304 (3.5%) | 472 (17.5%) |
Race in Cheatham County
The most populous races in Cheatham County are White / Caucasian (37,902 | 92.0%), Hispanic or Latino (1,580 | 3.8%), and Two or more Races (1,444 | 3.5%).
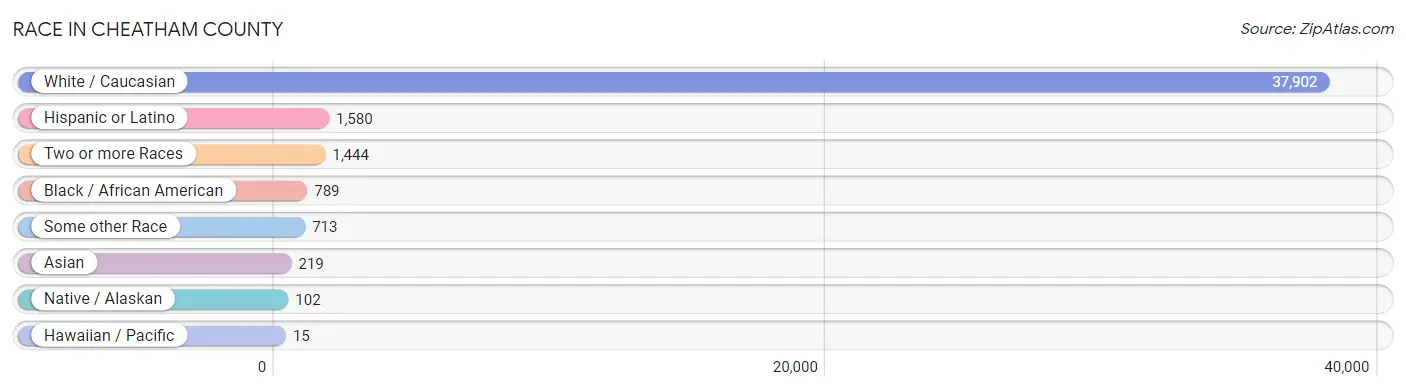
| Race | # Population | % Population |
| Asian | 219 | 0.5% |
| Black / African American | 789 | 1.9% |
| Hawaiian / Pacific | 15 | 0.0% |
| Hispanic or Latino | 1,580 | 3.8% |
| Native / Alaskan | 102 | 0.3% |
| White / Caucasian | 37,902 | 92.0% |
| Two or more Races | 1,444 | 3.5% |
| Some other Race | 713 | 1.7% |
| Total | 41,184 | 100.0% |
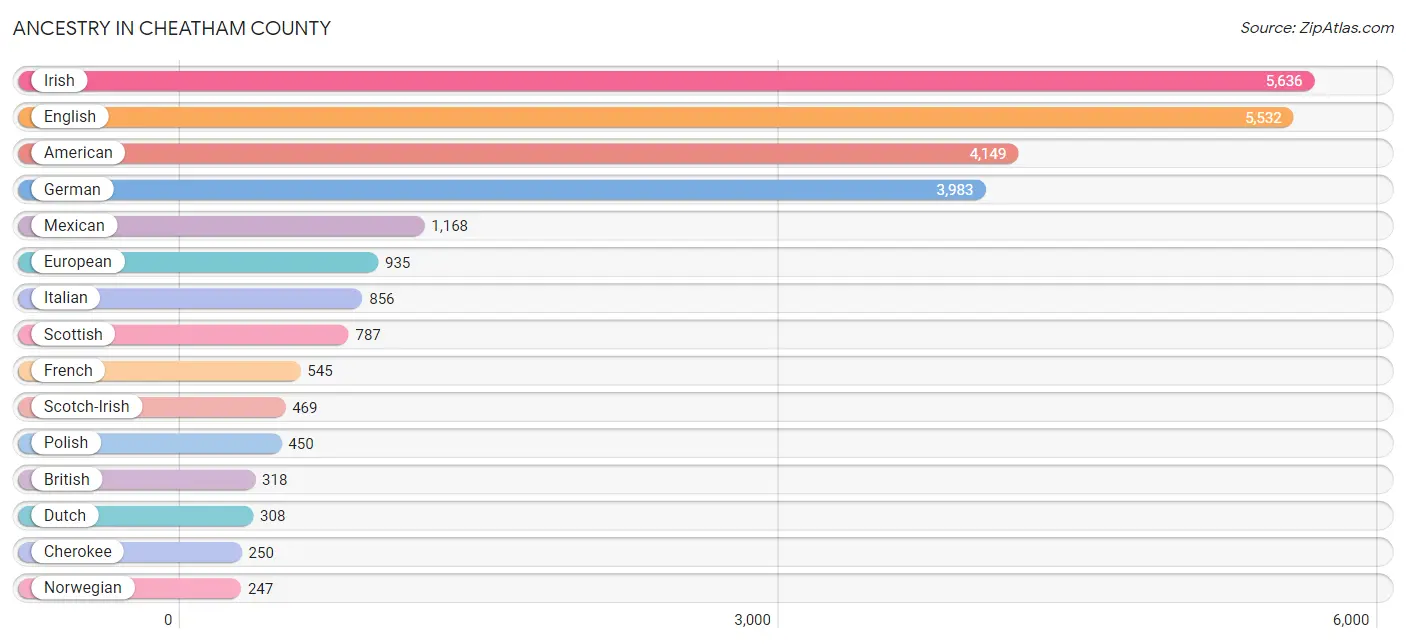
Ancestry in Cheatham County
The most populous ancestries reported in Cheatham County are Irish (5,636 | 13.7%), English (5,532 | 13.4%), American (4,149 | 10.1%), German (3,983 | 9.7%), and Mexican (1,168 | 2.8%), together accounting for 49.7% of all Cheatham County residents.
| Ancestry | # Population | % Population |
| African | 99 | 0.2% |
| Alaskan Athabascan | 13 | 0.0% |
| American | 4,149 | 10.1% |
| Arab | 234 | 0.6% |
| Armenian | 16 | 0.0% |
| Austrian | 11 | 0.0% |
| Belgian | 24 | 0.1% |
| Blackfeet | 1 | 0.0% |
| British | 318 | 0.8% |
| Burmese | 44 | 0.1% |
| Cajun | 52 | 0.1% |
| Canadian | 174 | 0.4% |
| Central American | 179 | 0.4% |
| Cherokee | 250 | 0.6% |
| Choctaw | 71 | 0.2% |
| Colombian | 3 | 0.0% |
| Costa Rican | 45 | 0.1% |
| Croatian | 8 | 0.0% |
| Crow | 18 | 0.0% |
| Cuban | 29 | 0.1% |
| Czech | 35 | 0.1% |
| Czechoslovakian | 11 | 0.0% |
| Danish | 53 | 0.1% |
| Dominican | 2 | 0.0% |
| Dutch | 308 | 0.7% |
| Eastern European | 47 | 0.1% |
| English | 5,532 | 13.4% |
| European | 935 | 2.3% |
| Finnish | 56 | 0.1% |
| French | 545 | 1.3% |
| French Canadian | 120 | 0.3% |
| German | 3,983 | 9.7% |
| Greek | 99 | 0.2% |
| Guamanian / Chamorro | 15 | 0.0% |
| Guatemalan | 23 | 0.1% |
| Honduran | 30 | 0.1% |
| Houma | 12 | 0.0% |
| Hungarian | 132 | 0.3% |
| Icelander | 31 | 0.1% |
| Indian (Asian) | 31 | 0.1% |
| Inupiat | 10 | 0.0% |
| Iranian | 5 | 0.0% |
| Irish | 5,636 | 13.7% |
| Italian | 856 | 2.1% |
| Jamaican | 72 | 0.2% |
| Korean | 75 | 0.2% |
| Lithuanian | 6 | 0.0% |
| Mexican | 1,168 | 2.8% |
| Nicaraguan | 22 | 0.1% |
| Norwegian | 247 | 0.6% |
| Palestinian | 37 | 0.1% |
| Pennsylvania German | 12 | 0.0% |
| Polish | 450 | 1.1% |
| Potawatomi | 18 | 0.0% |
| Puerto Rican | 106 | 0.3% |
| Russian | 100 | 0.2% |
| Salvadoran | 59 | 0.1% |
| Scandinavian | 51 | 0.1% |
| Scotch-Irish | 469 | 1.1% |
| Scottish | 787 | 1.9% |
| Slovak | 13 | 0.0% |
| Slovene | 10 | 0.0% |
| South American | 3 | 0.0% |
| Spaniard | 31 | 0.1% |
| Spanish | 12 | 0.0% |
| Sri Lankan | 66 | 0.2% |
| Subsaharan African | 99 | 0.2% |
| Swedish | 177 | 0.4% |
| Swiss | 40 | 0.1% |
| Thai | 60 | 0.2% |
| Ukrainian | 10 | 0.0% |
| Welsh | 156 | 0.4% | View All 72 Rows |
Immigrants in Cheatham County
The most numerous immigrant groups reported in Cheatham County came from Latin America (1,005 | 2.4%), Central America (873 | 2.1%), Mexico (605 | 1.5%), Asia (319 | 0.8%), and Europe (180 | 0.4%), together accounting for 7.2% of all Cheatham County residents.
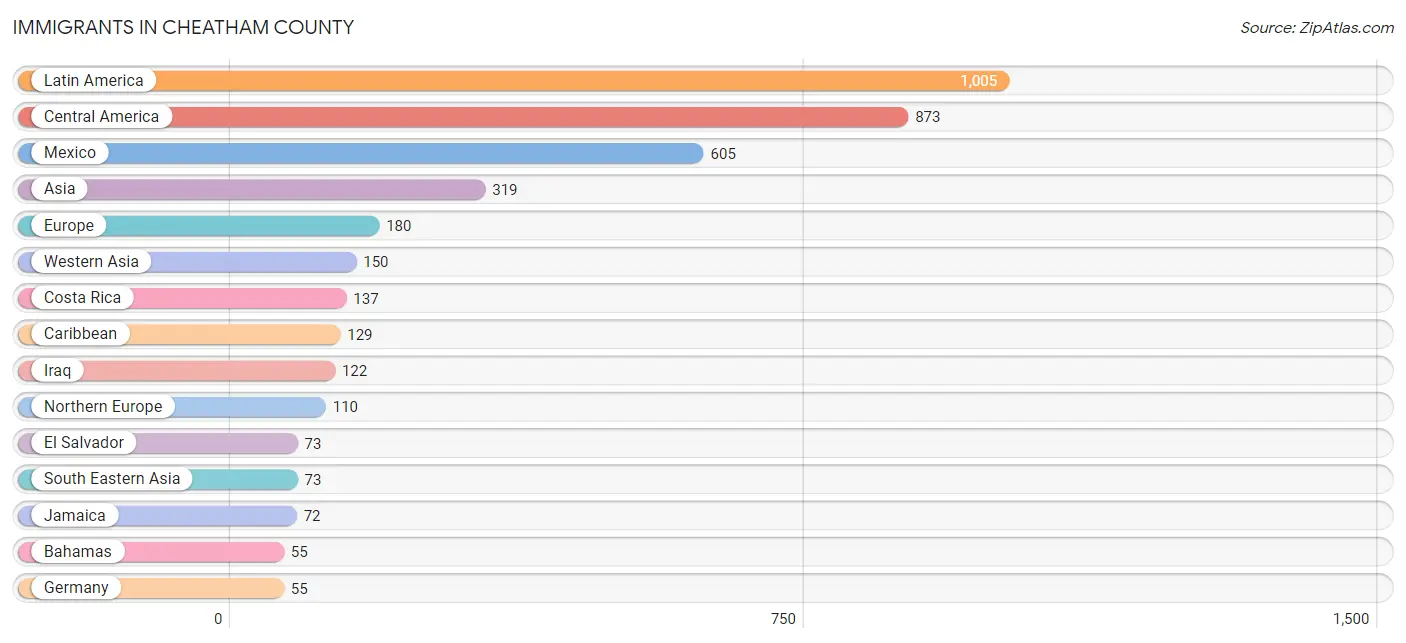
| Immigration Origin | # Population | % Population |
| Africa | 18 | 0.0% |
| Asia | 319 | 0.8% |
| Australia | 3 | 0.0% |
| Bahamas | 55 | 0.1% |
| Caribbean | 129 | 0.3% |
| Central America | 873 | 2.1% |
| China | 31 | 0.1% |
| Colombia | 3 | 0.0% |
| Costa Rica | 137 | 0.3% |
| Dominican Republic | 2 | 0.0% |
| Eastern Africa | 18 | 0.0% |
| Eastern Asia | 48 | 0.1% |
| Eastern Europe | 15 | 0.0% |
| El Salvador | 73 | 0.2% |
| England | 47 | 0.1% |
| Europe | 180 | 0.4% |
| Germany | 55 | 0.1% |
| Guatemala | 23 | 0.1% |
| Honduras | 3 | 0.0% |
| India | 38 | 0.1% |
| Iran | 5 | 0.0% |
| Iraq | 122 | 0.3% |
| Jamaica | 72 | 0.2% |
| Korea | 17 | 0.0% |
| Latin America | 1,005 | 2.4% |
| Lebanon | 12 | 0.0% |
| Mexico | 605 | 1.5% |
| Nicaragua | 32 | 0.1% |
| Northern Europe | 110 | 0.3% |
| Oceania | 3 | 0.0% |
| Philippines | 31 | 0.1% |
| Russia | 15 | 0.0% |
| Scotland | 8 | 0.0% |
| South America | 3 | 0.0% |
| South Central Asia | 43 | 0.1% |
| South Eastern Asia | 73 | 0.2% |
| Vietnam | 42 | 0.1% |
| Western Asia | 150 | 0.4% |
| Western Europe | 55 | 0.1% | View All 39 Rows |
Sex and Age in Cheatham County
Sex and Age in Cheatham County
The most populous age groups in Cheatham County are 50 to 54 Years (1,686 | 8.1%) for men and 35 to 39 Years (1,692 | 8.3%) for women.
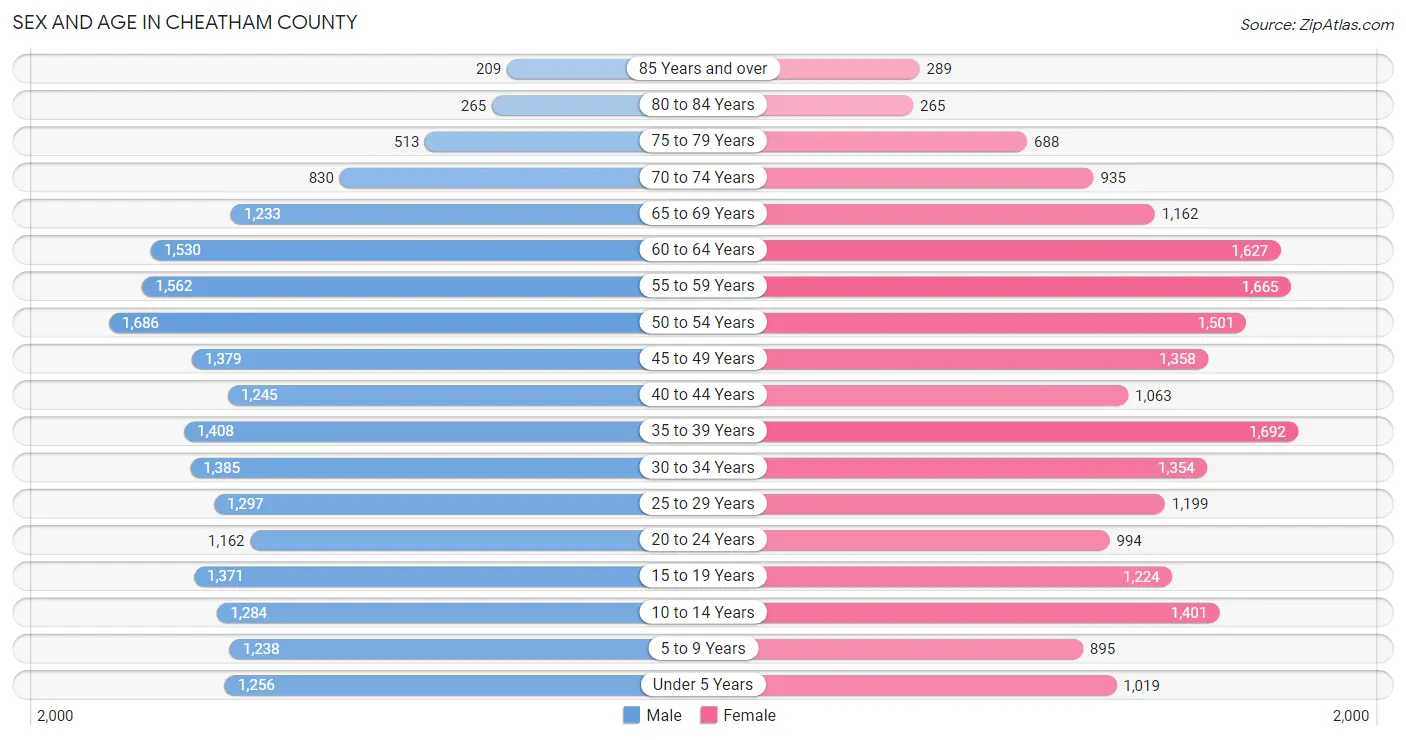
| Age Bracket | Male | Female |
| Under 5 Years | 1,256 (6.0%) | 1,019 (5.0%) |
| 5 to 9 Years | 1,238 (5.9%) | 895 (4.4%) |
| 10 to 14 Years | 1,284 (6.2%) | 1,401 (6.9%) |
| 15 to 19 Years | 1,371 (6.6%) | 1,224 (6.0%) |
| 20 to 24 Years | 1,162 (5.6%) | 994 (4.9%) |
| 25 to 29 Years | 1,297 (6.2%) | 1,199 (5.9%) |
| 30 to 34 Years | 1,385 (6.6%) | 1,354 (6.7%) |
| 35 to 39 Years | 1,408 (6.8%) | 1,692 (8.3%) |
| 40 to 44 Years | 1,245 (6.0%) | 1,063 (5.2%) |
| 45 to 49 Years | 1,379 (6.6%) | 1,358 (6.7%) |
| 50 to 54 Years | 1,686 (8.1%) | 1,501 (7.4%) |
| 55 to 59 Years | 1,562 (7.5%) | 1,665 (8.2%) |
| 60 to 64 Years | 1,530 (7.3%) | 1,627 (8.0%) |
| 65 to 69 Years | 1,233 (5.9%) | 1,162 (5.7%) |
| 70 to 74 Years | 830 (4.0%) | 935 (4.6%) |
| 75 to 79 Years | 513 (2.5%) | 688 (3.4%) |
| 80 to 84 Years | 265 (1.3%) | 265 (1.3%) |
| 85 Years and over | 209 (1.0%) | 289 (1.4%) |
| Total | 20,853 (100.0%) | 20,331 (100.0%) |
Families and Households in Cheatham County
Median Family Size in Cheatham County
The median family size in Cheatham County is 2.99 persons per family, with married-couple families (8,683 | 76.3%) accounting for the largest median family size of 3.09 persons per family. On the other hand, single male/father families (1,032 | 9.1%) represent the smallest median family size with 2.54 persons per family.
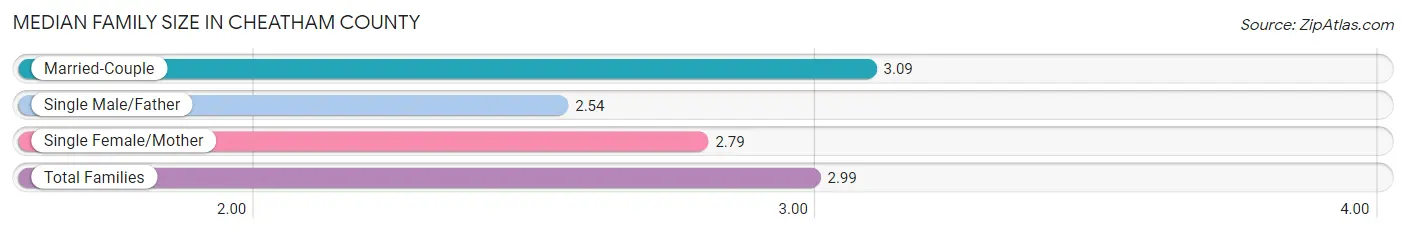
| Family Type | # Families | Family Size |
| Married-Couple | 8,683 (76.3%) | 3.09 |
| Single Male/Father | 1,032 (9.1%) | 2.54 |
| Single Female/Mother | 1,662 (14.6%) | 2.79 |
| Total Families | 11,377 (100.0%) | 2.99 |
Median Household Size in Cheatham County
The median household size in Cheatham County is 2.60 persons per household, with married-couple households (8,683 | 55.3%) accounting for the largest median household size of 3.14 persons per household. non-family households (4,331 | 27.6%) represent the smallest median household size with 1.22 persons per household.
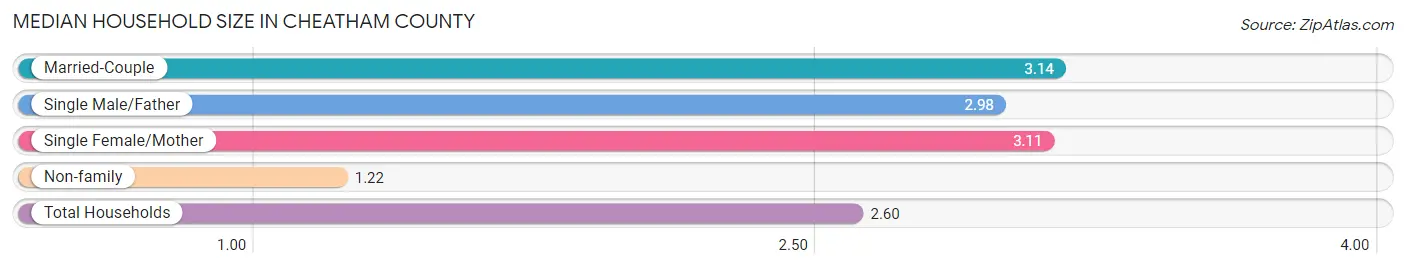
| Household Type | # Households | Household Size |
| Married-Couple | 8,683 (55.3%) | 3.14 |
| Single Male/Father | 1,032 (6.6%) | 2.98 |
| Single Female/Mother | 1,662 (10.6%) | 3.11 |
| Non-family | 4,331 (27.6%) | 1.22 |
| Total Households | 15,708 (100.0%) | 2.60 |
Household Size by Marriage Status in Cheatham County
Out of a total of 15,708 households in Cheatham County, 11,377 (72.4%) are family households, while 4,331 (27.6%) are nonfamily households. The most numerous type of family households are 2-person households, comprising 5,002, and the most common type of nonfamily households are 1-person households, comprising 3,376.
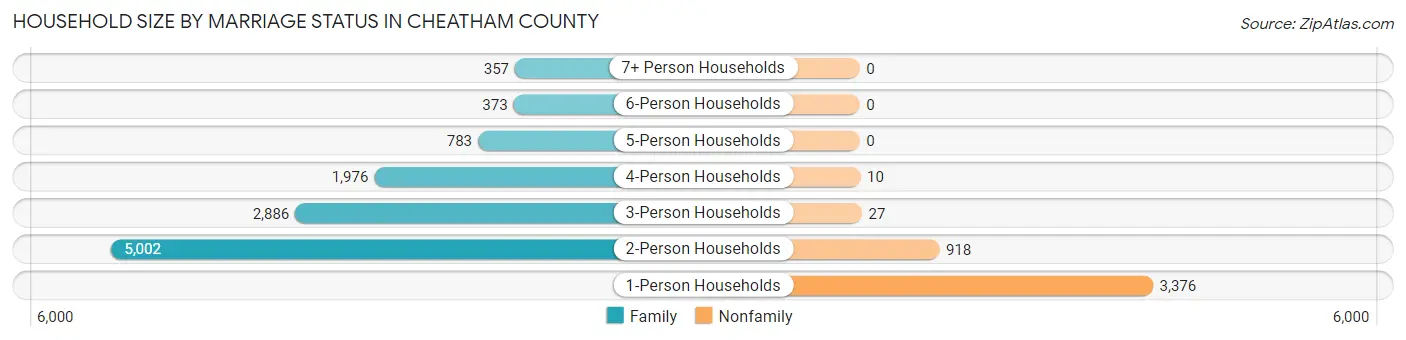
| Household Size | Family Households | Nonfamily Households |
| 1-Person Households | - | 3,376 (21.5%) |
| 2-Person Households | 5,002 (31.8%) | 918 (5.8%) |
| 3-Person Households | 2,886 (18.4%) | 27 (0.2%) |
| 4-Person Households | 1,976 (12.6%) | 10 (0.1%) |
| 5-Person Households | 783 (5.0%) | 0 (0.0%) |
| 6-Person Households | 373 (2.4%) | 0 (0.0%) |
| 7+ Person Households | 357 (2.3%) | 0 (0.0%) |
| Total | 11,377 (72.4%) | 4,331 (27.6%) |
Female Fertility in Cheatham County
Fertility by Age in Cheatham County
Average fertility rate in Cheatham County is 56.0 births per 1,000 women. Women in the age bracket of 20 to 34 years have the highest fertility rate with 100.0 births per 1,000 women. Women in the age bracket of 20 to 34 years acount for 69.4% of all women with births.
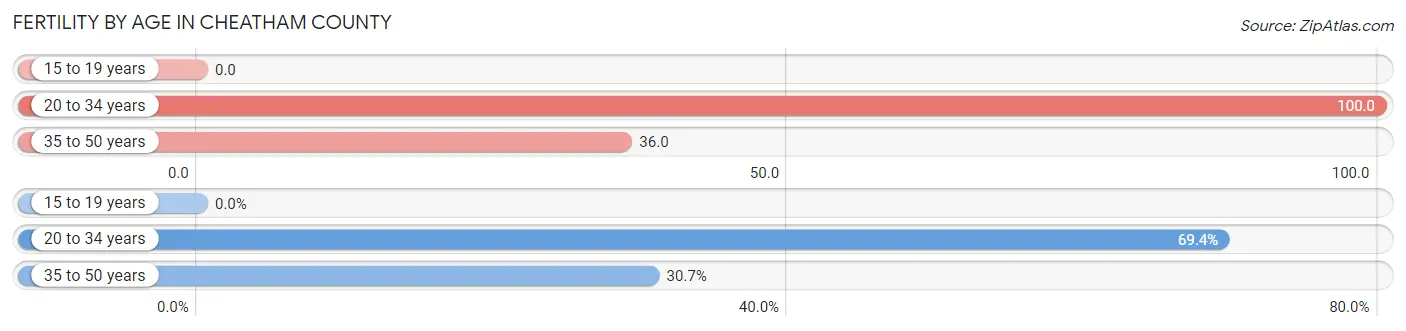
| Age Bracket | Women with Births | Births / 1,000 Women |
| 15 to 19 years | 0 (0.0%) | 0.0 |
| 20 to 34 years | 353 (69.4%) | 100.0 |
| 35 to 50 years | 156 (30.6%) | 36.0 |
| Total | 509 (100.0%) | 56.0 |
Fertility by Age by Marriage Status in Cheatham County
87.8% of women with births (509) in Cheatham County are married. The highest percentage of unmarried women with births falls into 20 to 34 years age bracket with 13.0% of them unmarried at the time of birth, while the lowest percentage of unmarried women with births belong to 35 to 50 years age bracket with 10.3% of them unmarried.
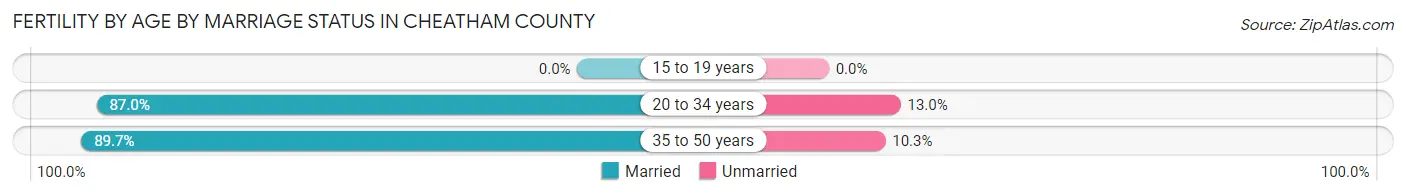
| Age Bracket | Married | Unmarried |
| 15 to 19 years | 0 (0.0%) | 0 (0.0%) |
| 20 to 34 years | 307 (87.0%) | 46 (13.0%) |
| 35 to 50 years | 140 (89.7%) | 16 (10.3%) |
| Total | 447 (87.8%) | 62 (12.2%) |
Fertility by Education in Cheatham County
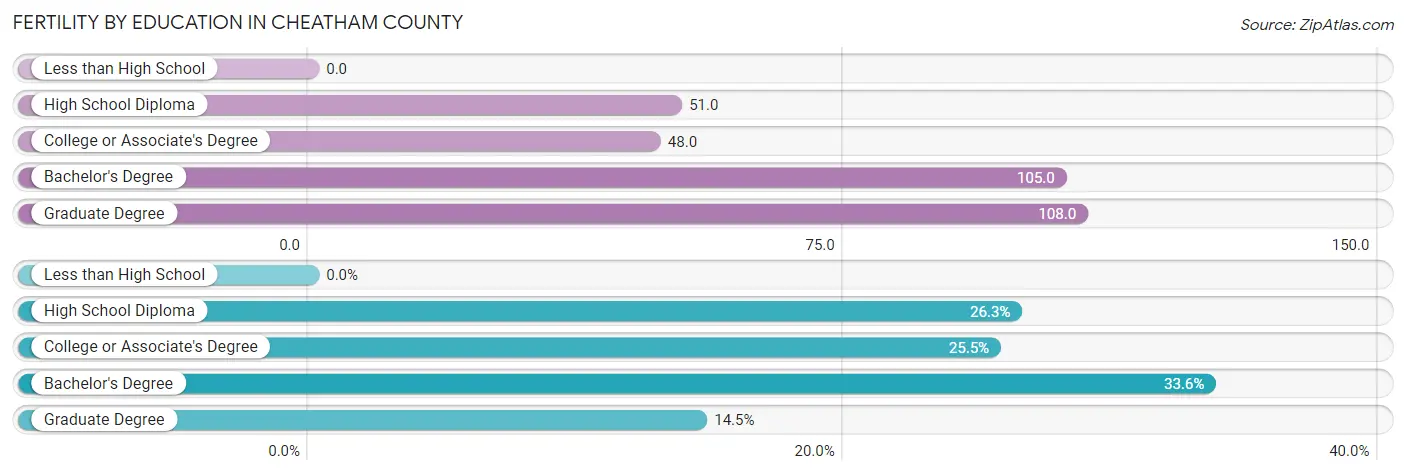
| Educational Attainment | Women with Births | Births / 1,000 Women |
| Less than High School | 0 (0.0%) | 0.0 |
| High School Diploma | 134 (26.3%) | 51.0 |
| College or Associate's Degree | 130 (25.5%) | 48.0 |
| Bachelor's Degree | 171 (33.6%) | 105.0 |
| Graduate Degree | 74 (14.5%) | 108.0 |
| Total | 509 (100.0%) | 56.0 |
Fertility by Education by Marriage Status in Cheatham County
12.2% of women with births in Cheatham County are unmarried. Women with the educational attainment of bachelor's degree are most likely to be married with 100.0% of them married at childbirth, while women with the educational attainment of high school diploma are least likely to be married with 23.1% of them unmarried at childbirth.
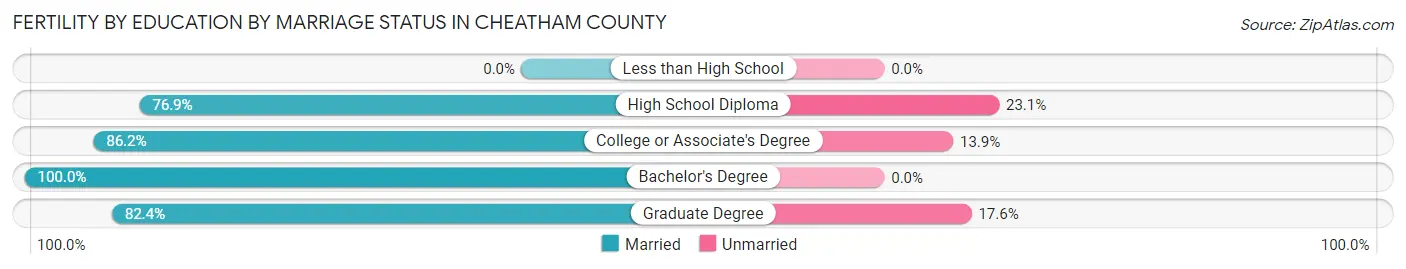
| Educational Attainment | Married | Unmarried |
| Less than High School | 0 (0.0%) | 0 (0.0%) |
| High School Diploma | 103 (76.9%) | 31 (23.1%) |
| College or Associate's Degree | 112 (86.2%) | 18 (13.9%) |
| Bachelor's Degree | 171 (100.0%) | 0 (0.0%) |
| Graduate Degree | 61 (82.4%) | 13 (17.6%) |
| Total | 447 (87.8%) | 62 (12.2%) |
Employment Characteristics in Cheatham County
Employment by Class of Employer in Cheatham County
Among the 20,410 employed individuals in Cheatham County, private company employees (14,035 | 68.8%), self-employed (not incorporated) (2,020 | 9.9%), and local government employees (1,427 | 7.0%) make up the most common classes of employment.
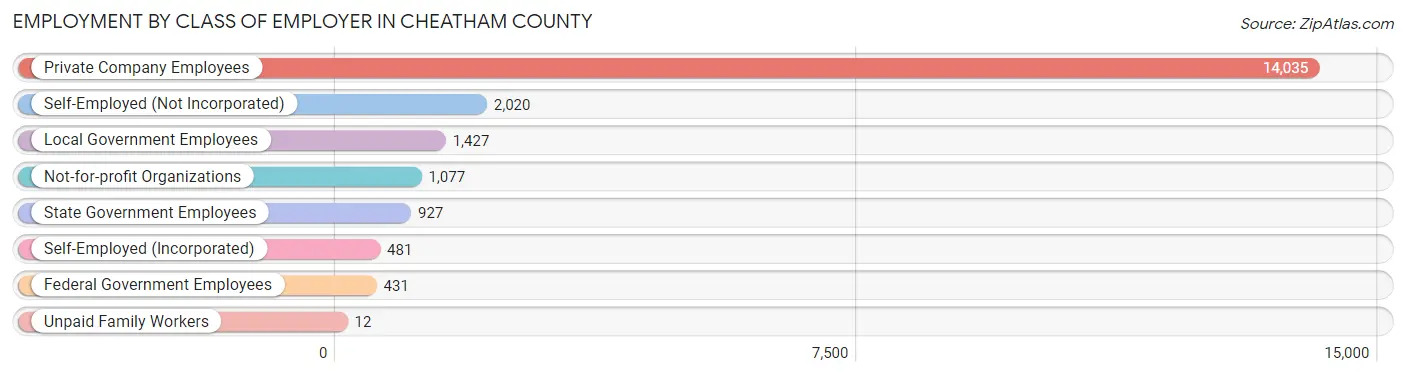
| Employer Class | # Employees | % Employees |
| Private Company Employees | 14,035 | 68.8% |
| Self-Employed (Incorporated) | 481 | 2.4% |
| Self-Employed (Not Incorporated) | 2,020 | 9.9% |
| Not-for-profit Organizations | 1,077 | 5.3% |
| Local Government Employees | 1,427 | 7.0% |
| State Government Employees | 927 | 4.5% |
| Federal Government Employees | 431 | 2.1% |
| Unpaid Family Workers | 12 | 0.1% |
| Total | 20,410 | 100.0% |
Employment Status by Age in Cheatham County
According to the labor force statistics for Cheatham County, out of the total population over 16 years of age (33,387), 64.8% or 21,635 individuals are in the labor force, with 3.7% or 800 of them unemployed. The age group with the highest labor force participation rate is 35 to 44 years, with 87.3% or 4,721 individuals in the labor force. Within the labor force, the 16 to 19 years age range has the highest percentage of unemployed individuals, with 13.2% or 119 of them being unemployed.
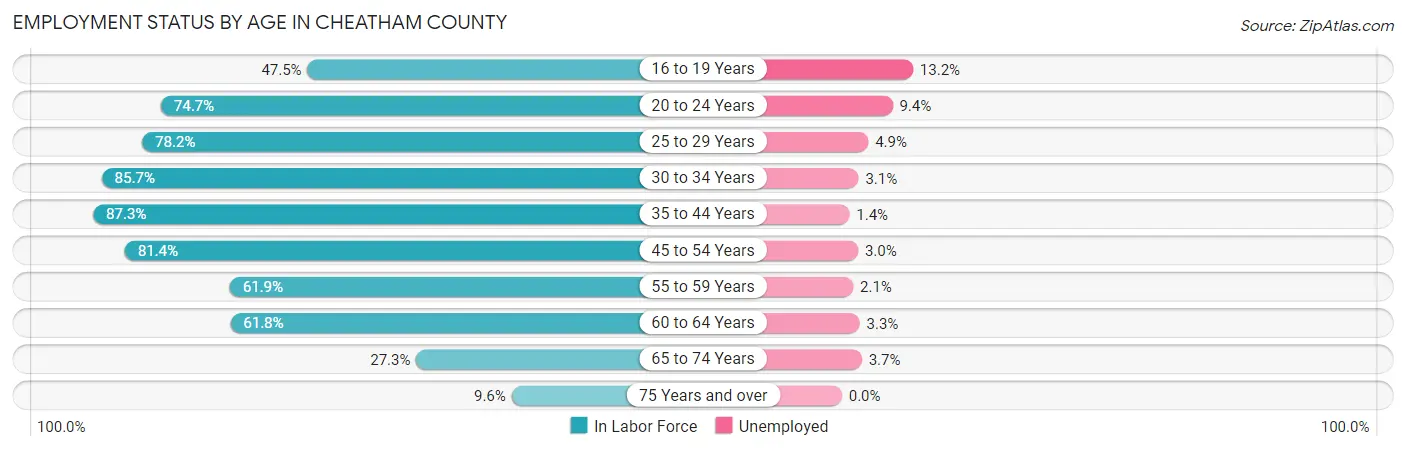
| Age Bracket | In Labor Force | Unemployed |
| 16 to 19 Years | 898 (47.5%) | 119 (13.2%) |
| 20 to 24 Years | 1,611 (74.7%) | 151 (9.4%) |
| 25 to 29 Years | 1,952 (78.2%) | 96 (4.9%) |
| 30 to 34 Years | 2,347 (85.7%) | 73 (3.1%) |
| 35 to 44 Years | 4,721 (87.3%) | 66 (1.4%) |
| 45 to 54 Years | 4,822 (81.4%) | 145 (3.0%) |
| 55 to 59 Years | 1,998 (61.9%) | 42 (2.1%) |
| 60 to 64 Years | 1,951 (61.8%) | 64 (3.3%) |
| 65 to 74 Years | 1,136 (27.3%) | 42 (3.7%) |
| 75 Years and over | 214 (9.6%) | 0 (0.0%) |
| Total | 21,635 (64.8%) | 800 (3.7%) |
Employment Status by Educational Attainment in Cheatham County
According to labor force statistics for Cheatham County, 77.5% of individuals (17,787) out of the total population between 25 and 64 years of age (22,951) are in the labor force, with 2.8% or 498 of them being unemployed. The group with the highest labor force participation rate are those with the educational attainment of bachelor's degree or higher, with 86.9% or 4,791 individuals in the labor force. Within the labor force, individuals with less than high school education have the highest percentage of unemployment, with 3.9% or 50 of them being unemployed.
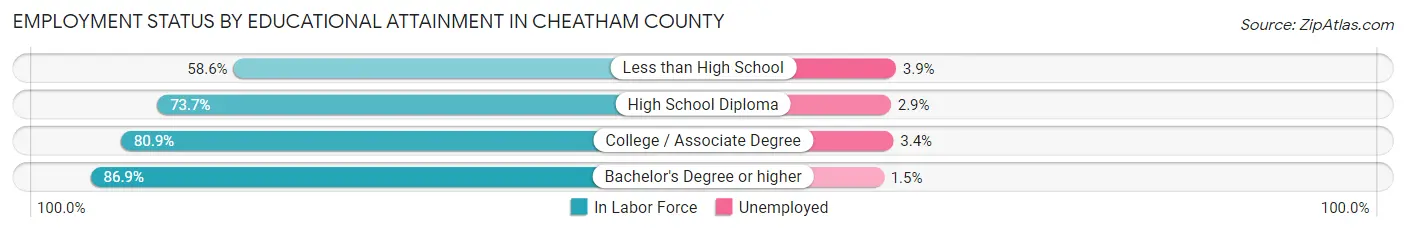
| Educational Attainment | In Labor Force | Unemployed |
| Less than High School | 1,286 (58.6%) | 86 (3.9%) |
| High School Diploma | 6,318 (73.7%) | 249 (2.9%) |
| College / Associate Degree | 5,396 (80.9%) | 227 (3.4%) |
| Bachelor's Degree or higher | 4,791 (86.9%) | 83 (1.5%) |
| Total | 17,787 (77.5%) | 643 (2.8%) |
Employment Occupations by Sex in Cheatham County
Management, Business, Science and Arts Occupations
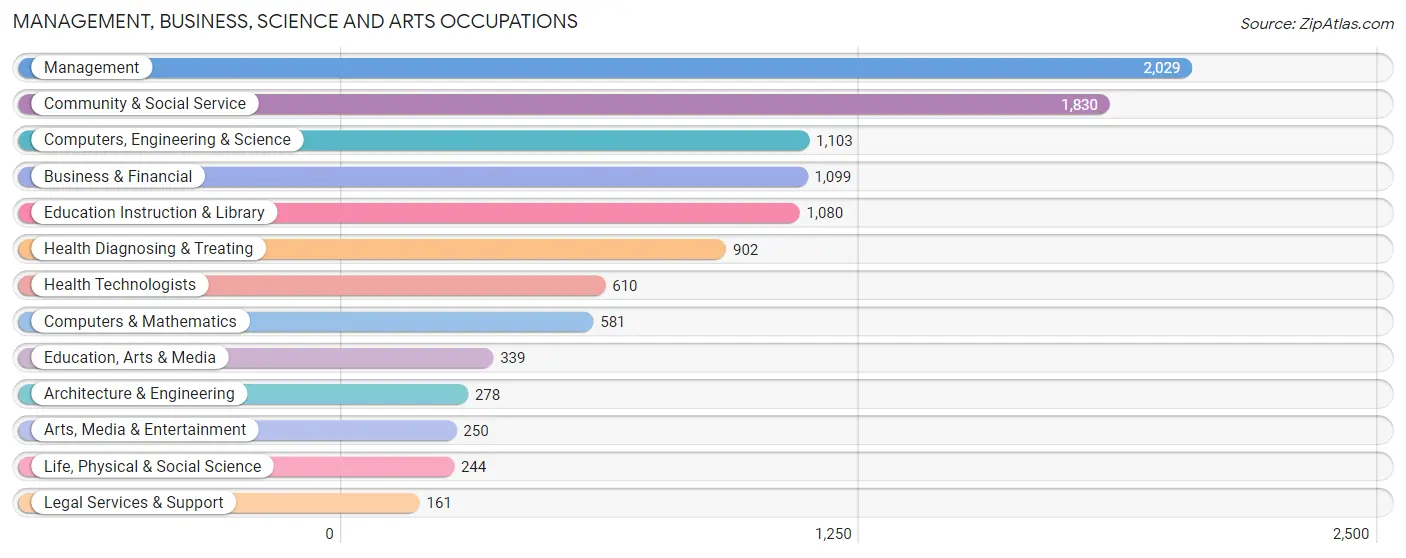
The most common Management, Business, Science and Arts occupations in Cheatham County are Management (2,029 | 9.8%), Community & Social Service (1,830 | 8.8%), Computers, Engineering & Science (1,103 | 5.3%), Business & Financial (1,099 | 5.3%), and Education Instruction & Library (1,080 | 5.2%).
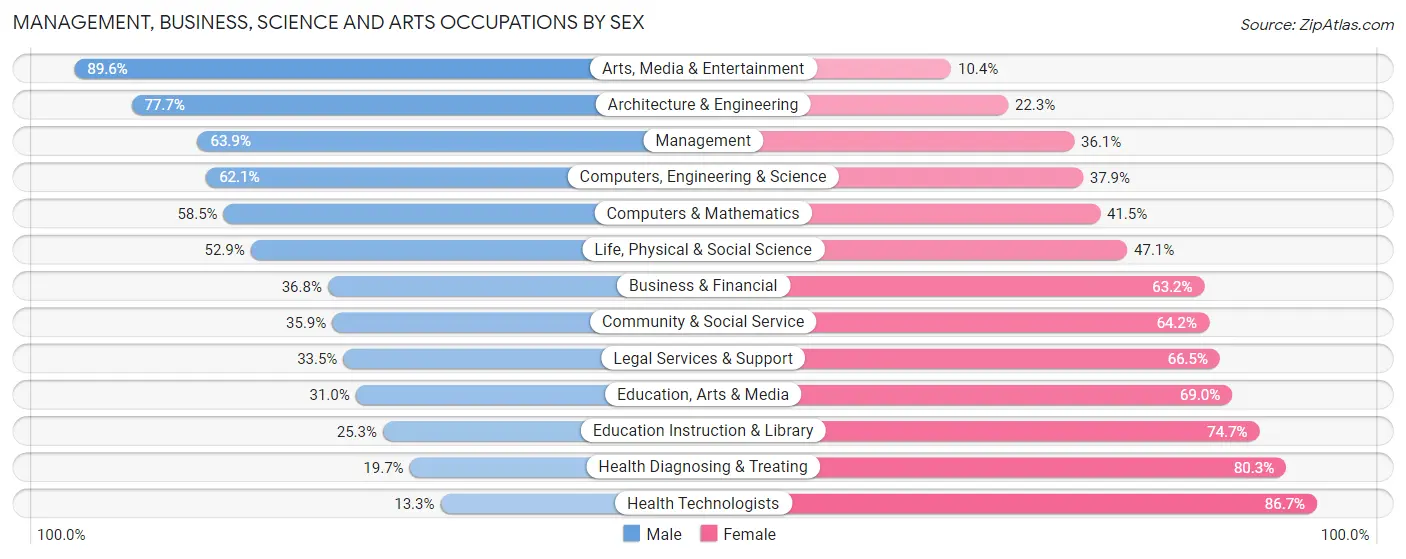
Management, Business, Science and Arts Occupations by Sex
Within the Management, Business, Science and Arts occupations in Cheatham County, the most male-oriented occupations are Arts, Media & Entertainment (89.6%), Architecture & Engineering (77.7%), and Management (63.9%), while the most female-oriented occupations are Health Technologists (86.7%), Health Diagnosing & Treating (80.3%), and Education Instruction & Library (74.7%).
| Occupation | Male | Female |
| Management | 1,297 (63.9%) | 732 (36.1%) |
| Business & Financial | 404 (36.8%) | 695 (63.2%) |
| Computers, Engineering & Science | 685 (62.1%) | 418 (37.9%) |
| Computers & Mathematics | 340 (58.5%) | 241 (41.5%) |
| Architecture & Engineering | 216 (77.7%) | 62 (22.3%) |
| Life, Physical & Social Science | 129 (52.9%) | 115 (47.1%) |
| Community & Social Service | 656 (35.8%) | 1,174 (64.1%) |
| Education, Arts & Media | 105 (31.0%) | 234 (69.0%) |
| Legal Services & Support | 54 (33.5%) | 107 (66.5%) |
| Education Instruction & Library | 273 (25.3%) | 807 (74.7%) |
| Arts, Media & Entertainment | 224 (89.6%) | 26 (10.4%) |
| Health Diagnosing & Treating | 178 (19.7%) | 724 (80.3%) |
| Health Technologists | 81 (13.3%) | 529 (86.7%) |
| Total (Category) | 3,220 (46.2%) | 3,743 (53.8%) |
| Total (Overall) | 11,169 (53.7%) | 9,644 (46.3%) |
Services Occupations
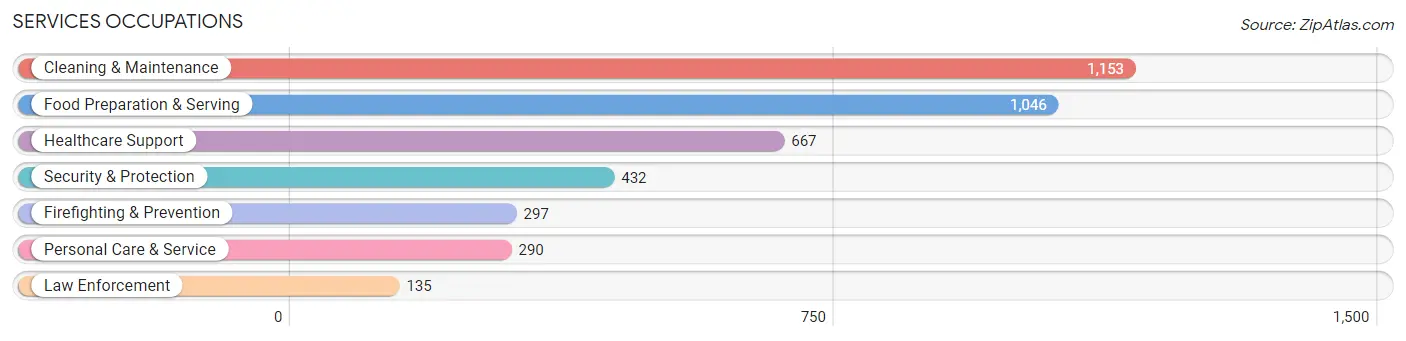
The most common Services occupations in Cheatham County are Cleaning & Maintenance (1,153 | 5.5%), Food Preparation & Serving (1,046 | 5.0%), Healthcare Support (667 | 3.2%), Security & Protection (432 | 2.1%), and Firefighting & Prevention (297 | 1.4%).
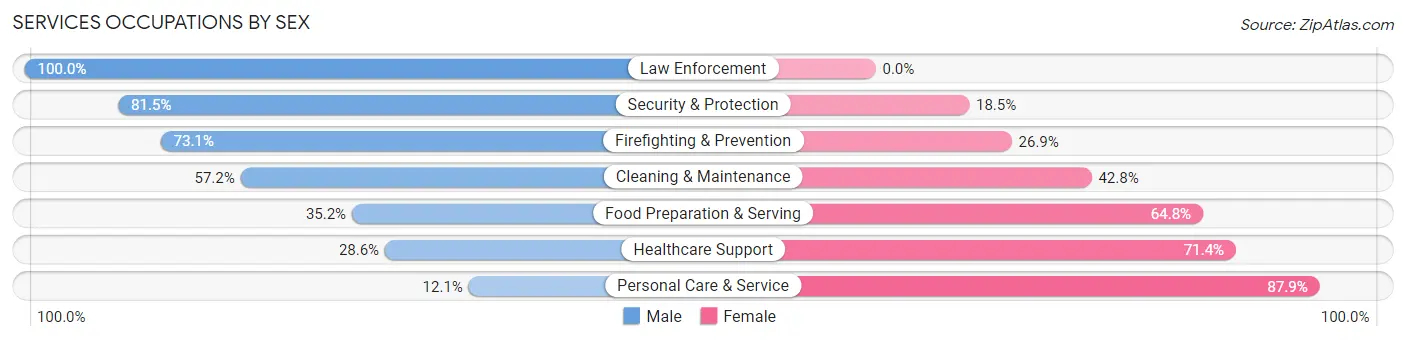
Services Occupations by Sex
Within the Services occupations in Cheatham County, the most male-oriented occupations are Law Enforcement (100.0%), Security & Protection (81.5%), and Firefighting & Prevention (73.1%), while the most female-oriented occupations are Personal Care & Service (87.9%), Healthcare Support (71.4%), and Food Preparation & Serving (64.8%).
| Occupation | Male | Female |
| Healthcare Support | 191 (28.6%) | 476 (71.4%) |
| Security & Protection | 352 (81.5%) | 80 (18.5%) |
| Firefighting & Prevention | 217 (73.1%) | 80 (26.9%) |
| Law Enforcement | 135 (100.0%) | 0 (0.0%) |
| Food Preparation & Serving | 368 (35.2%) | 678 (64.8%) |
| Cleaning & Maintenance | 660 (57.2%) | 493 (42.8%) |
| Personal Care & Service | 35 (12.1%) | 255 (87.9%) |
| Total (Category) | 1,606 (44.8%) | 1,982 (55.2%) |
| Total (Overall) | 11,169 (53.7%) | 9,644 (46.3%) |
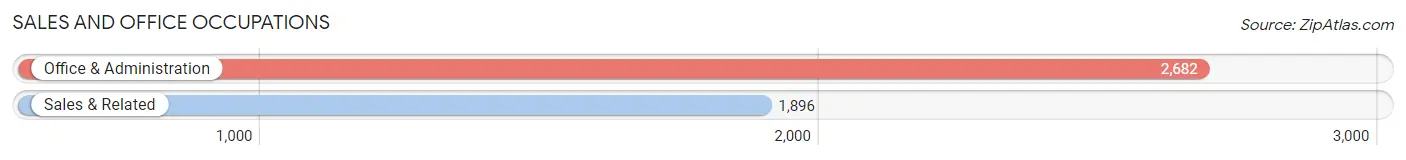
Sales and Office Occupations
The most common Sales and Office occupations in Cheatham County are Office & Administration (2,682 | 12.9%), and Sales & Related (1,896 | 9.1%).
Sales and Office Occupations by Sex
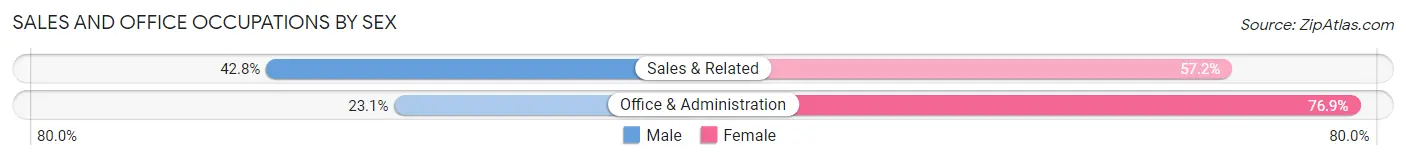
| Occupation | Male | Female |
| Sales & Related | 812 (42.8%) | 1,084 (57.2%) |
| Office & Administration | 620 (23.1%) | 2,062 (76.9%) |
| Total (Category) | 1,432 (31.3%) | 3,146 (68.7%) |
| Total (Overall) | 11,169 (53.7%) | 9,644 (46.3%) |
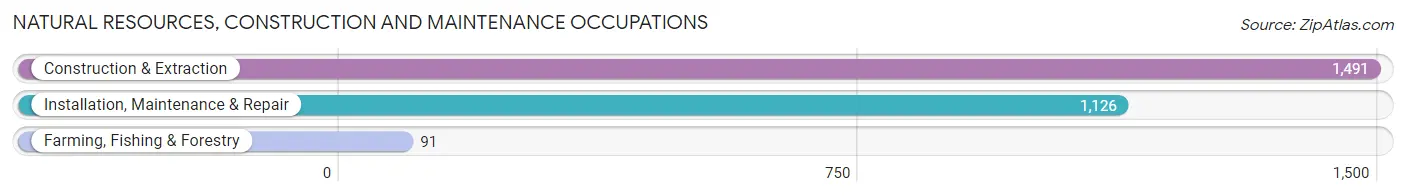
Natural Resources, Construction and Maintenance Occupations
The most common Natural Resources, Construction and Maintenance occupations in Cheatham County are Construction & Extraction (1,491 | 7.2%), Installation, Maintenance & Repair (1,126 | 5.4%), and Farming, Fishing & Forestry (91 | 0.4%).
Natural Resources, Construction and Maintenance Occupations by Sex
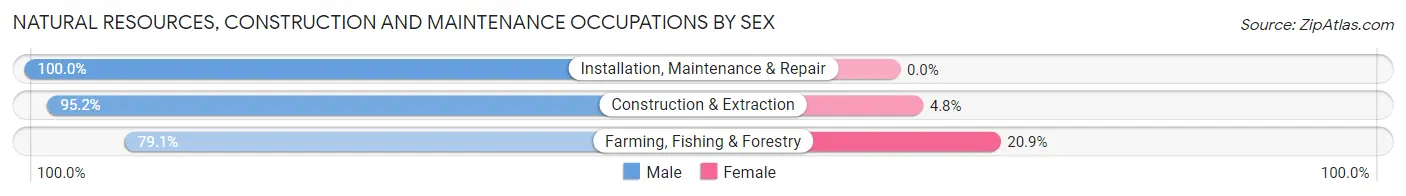
| Occupation | Male | Female |
| Farming, Fishing & Forestry | 72 (79.1%) | 19 (20.9%) |
| Construction & Extraction | 1,420 (95.2%) | 71 (4.8%) |
| Installation, Maintenance & Repair | 1,126 (100.0%) | 0 (0.0%) |
| Total (Category) | 2,618 (96.7%) | 90 (3.3%) |
| Total (Overall) | 11,169 (53.7%) | 9,644 (46.3%) |
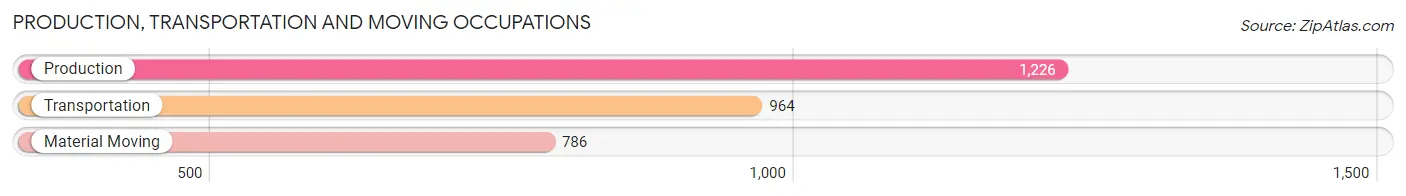
Production, Transportation and Moving Occupations
The most common Production, Transportation and Moving occupations in Cheatham County are Production (1,226 | 5.9%), Transportation (964 | 4.6%), and Material Moving (786 | 3.8%).
Production, Transportation and Moving Occupations by Sex
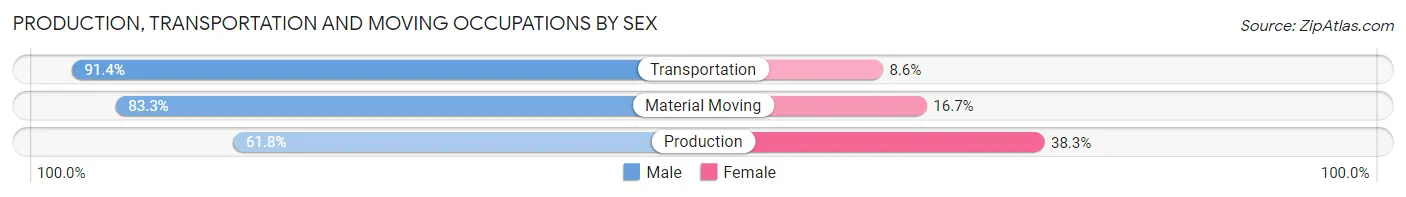
| Occupation | Male | Female |
| Production | 757 (61.8%) | 469 (38.3%) |
| Transportation | 881 (91.4%) | 83 (8.6%) |
| Material Moving | 655 (83.3%) | 131 (16.7%) |
| Total (Category) | 2,293 (77.0%) | 683 (23.0%) |
| Total (Overall) | 11,169 (53.7%) | 9,644 (46.3%) |
Employment Industries by Sex in Cheatham County
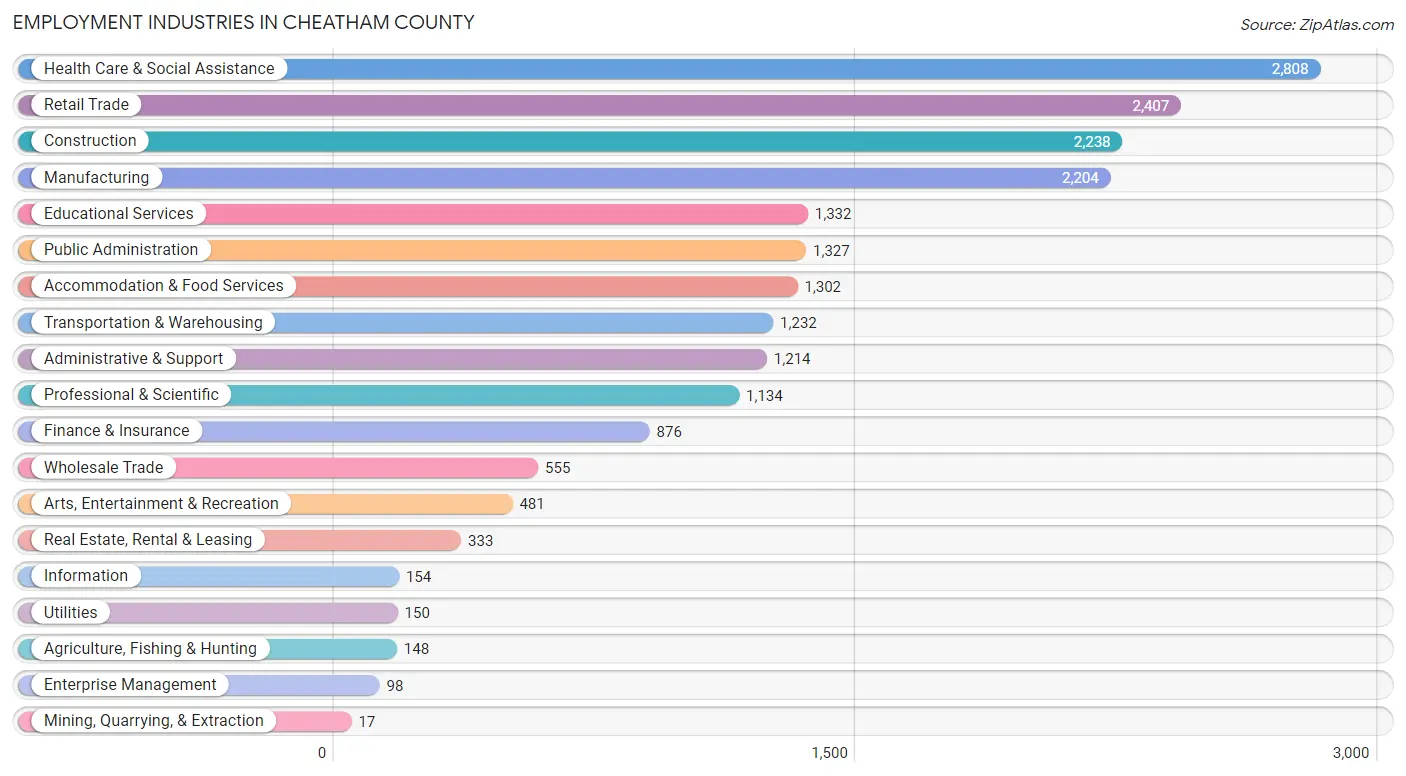
Employment Industries in Cheatham County
The major employment industries in Cheatham County include Health Care & Social Assistance (2,808 | 13.5%), Retail Trade (2,407 | 11.6%), Construction (2,238 | 10.7%), Manufacturing (2,204 | 10.6%), and Educational Services (1,332 | 6.4%).
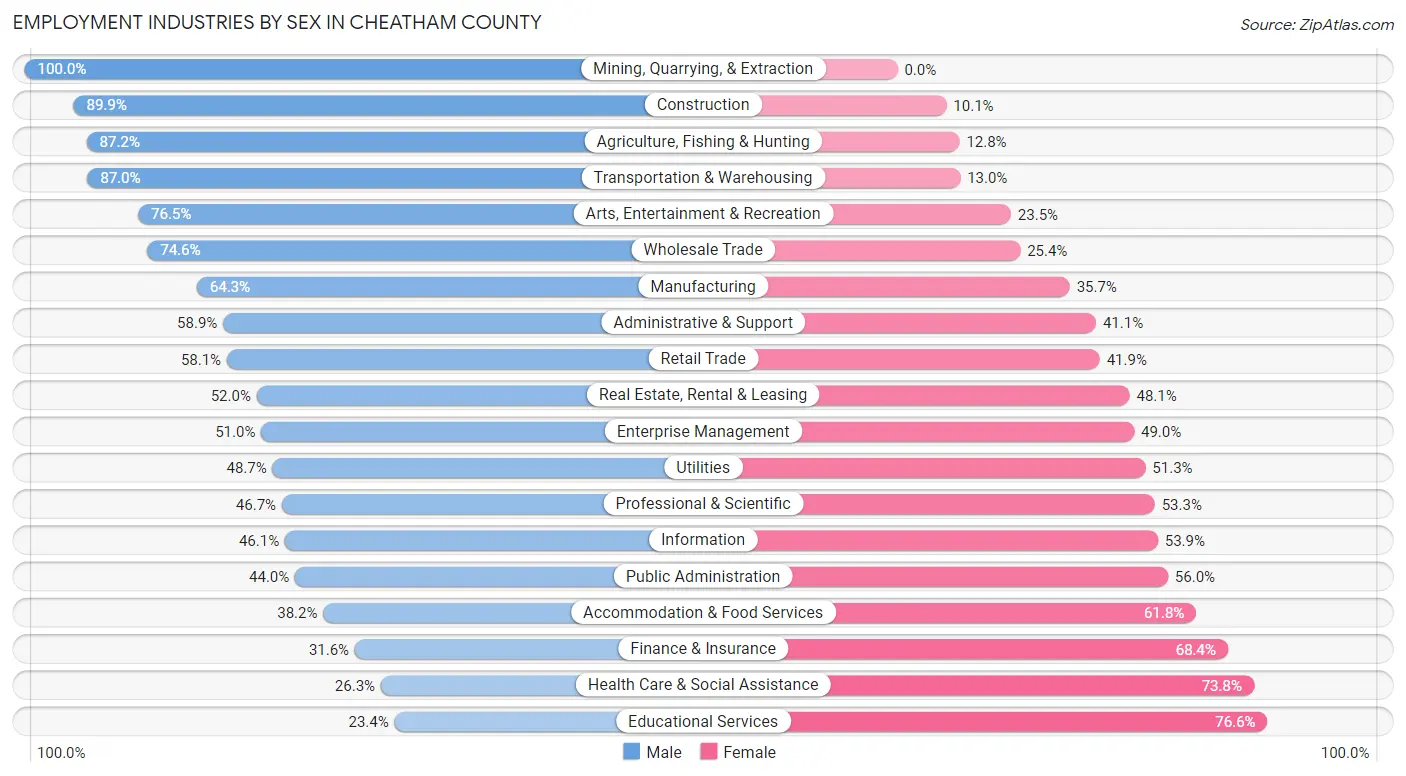
Employment Industries by Sex in Cheatham County
The Cheatham County industries that see more men than women are Mining, Quarrying, & Extraction (100.0%), Construction (89.9%), and Agriculture, Fishing & Hunting (87.2%), whereas the industries that tend to have a higher number of women are Educational Services (76.6%), Health Care & Social Assistance (73.8%), and Finance & Insurance (68.4%).
| Industry | Male | Female |
| Agriculture, Fishing & Hunting | 129 (87.2%) | 19 (12.8%) |
| Mining, Quarrying, & Extraction | 17 (100.0%) | 0 (0.0%) |
| Construction | 2,011 (89.9%) | 227 (10.1%) |
| Manufacturing | 1,418 (64.3%) | 786 (35.7%) |
| Wholesale Trade | 414 (74.6%) | 141 (25.4%) |
| Retail Trade | 1,399 (58.1%) | 1,008 (41.9%) |
| Transportation & Warehousing | 1,072 (87.0%) | 160 (13.0%) |
| Utilities | 73 (48.7%) | 77 (51.3%) |
| Information | 71 (46.1%) | 83 (53.9%) |
| Finance & Insurance | 277 (31.6%) | 599 (68.4%) |
| Real Estate, Rental & Leasing | 173 (51.9%) | 160 (48.0%) |
| Professional & Scientific | 530 (46.7%) | 604 (53.3%) |
| Enterprise Management | 50 (51.0%) | 48 (49.0%) |
| Administrative & Support | 715 (58.9%) | 499 (41.1%) |
| Educational Services | 312 (23.4%) | 1,020 (76.6%) |
| Health Care & Social Assistance | 737 (26.3%) | 2,071 (73.8%) |
| Arts, Entertainment & Recreation | 368 (76.5%) | 113 (23.5%) |
| Accommodation & Food Services | 497 (38.2%) | 805 (61.8%) |
| Public Administration | 584 (44.0%) | 743 (56.0%) |
| Total | 11,169 (53.7%) | 9,644 (46.3%) |
Education in Cheatham County
School Enrollment in Cheatham County
The most common levels of schooling among the 8,359 students in Cheatham County are high school (2,555 | 30.6%), middle school (2,082 | 24.9%), and elementary school (1,745 | 20.9%).
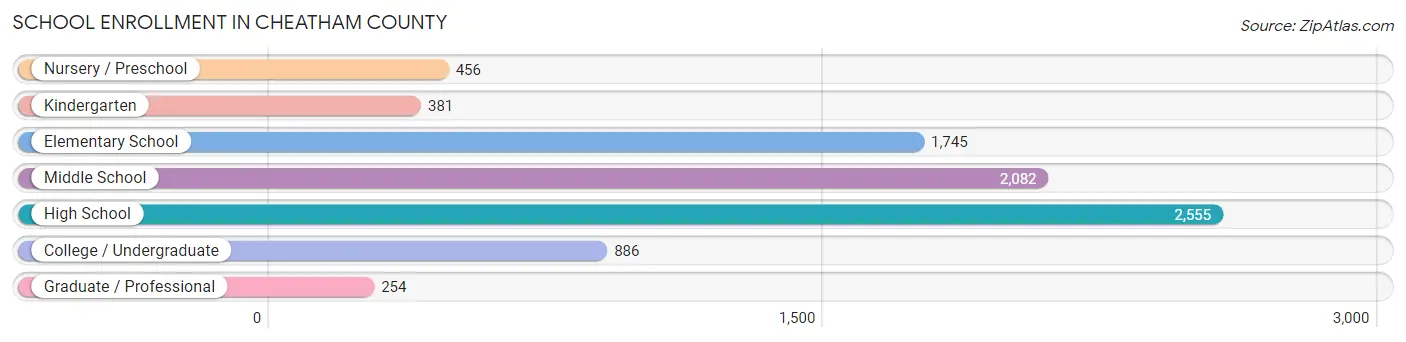
| School Level | # Students | % Students |
| Nursery / Preschool | 456 | 5.5% |
| Kindergarten | 381 | 4.6% |
| Elementary School | 1,745 | 20.9% |
| Middle School | 2,082 | 24.9% |
| High School | 2,555 | 30.6% |
| College / Undergraduate | 886 | 10.6% |
| Graduate / Professional | 254 | 3.0% |
| Total | 8,359 | 100.0% |
School Enrollment by Age by Funding Source in Cheatham County
Out of a total of 8,359 students who are enrolled in schools in Cheatham County, 1,797 (21.5%) attend a private institution, while the remaining 6,562 (78.5%) are enrolled in public schools. The age group of 3 to 4 year olds has the highest likelihood of being enrolled in private schools, with 219 (63.7% in the age bracket) enrolled. Conversely, the age group of 10 to 14 year olds has the lowest likelihood of being enrolled in a private school, with 2,277 (87.0% in the age bracket) attending a public institution.
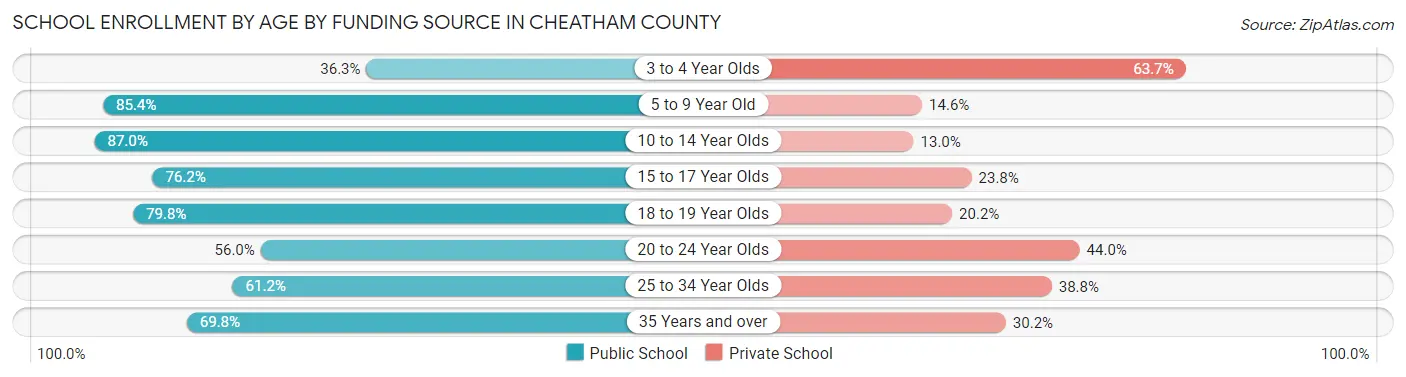
| Age Bracket | Public School | Private School |
| 3 to 4 Year Olds | 125 (36.3%) | 219 (63.7%) |
| 5 to 9 Year Old | 1,746 (85.4%) | 299 (14.6%) |
| 10 to 14 Year Olds | 2,277 (87.0%) | 341 (13.0%) |
| 15 to 17 Year Olds | 1,298 (76.2%) | 406 (23.8%) |
| 18 to 19 Year Olds | 387 (79.8%) | 98 (20.2%) |
| 20 to 24 Year Olds | 255 (56.0%) | 200 (44.0%) |
| 25 to 34 Year Olds | 158 (61.2%) | 100 (38.8%) |
| 35 Years and over | 314 (69.8%) | 136 (30.2%) |
| Total | 6,562 (78.5%) | 1,797 (21.5%) |
Educational Attainment by Field of Study in Cheatham County
Business (1,429 | 20.1%), education (868 | 12.2%), science & technology (735 | 10.3%), bio, nature & agricultural (530 | 7.5%), and psychology (461 | 6.5%) are the most common fields of study among 7,107 individuals in Cheatham County who have obtained a bachelor's degree or higher.
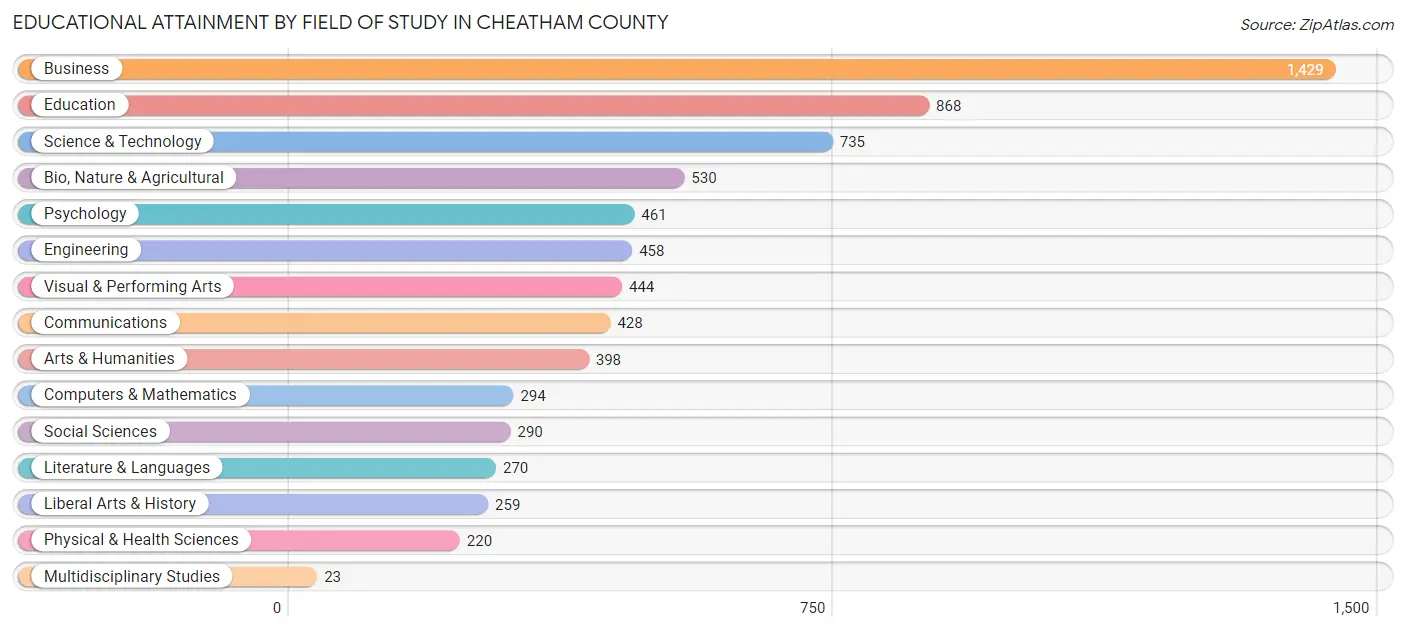
| Field of Study | # Graduates | % Graduates |
| Computers & Mathematics | 294 | 4.1% |
| Bio, Nature & Agricultural | 530 | 7.5% |
| Physical & Health Sciences | 220 | 3.1% |
| Psychology | 461 | 6.5% |
| Social Sciences | 290 | 4.1% |
| Engineering | 458 | 6.4% |
| Multidisciplinary Studies | 23 | 0.3% |
| Science & Technology | 735 | 10.3% |
| Business | 1,429 | 20.1% |
| Education | 868 | 12.2% |
| Literature & Languages | 270 | 3.8% |
| Liberal Arts & History | 259 | 3.6% |
| Visual & Performing Arts | 444 | 6.2% |
| Communications | 428 | 6.0% |
| Arts & Humanities | 398 | 5.6% |
| Total | 7,107 | 100.0% |
Transportation & Commute in Cheatham County
Vehicle Availability by Sex in Cheatham County
The most prevalent vehicle ownership categories in Cheatham County are males with 2 vehicles (3,950, accounting for 35.9%) and females with 2 vehicles (3,294, making up 42.0%).
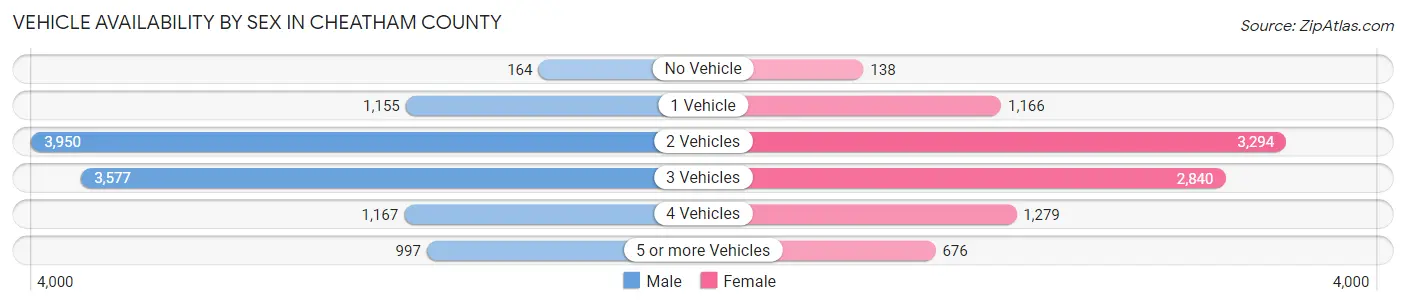
| Vehicles Available | Male | Female |
| No Vehicle | 164 (1.5%) | 138 (1.5%) |
| 1 Vehicle | 1,155 (10.5%) | 1,166 (12.4%) |
| 2 Vehicles | 3,950 (35.9%) | 3,294 (35.1%) |
| 3 Vehicles | 3,577 (32.5%) | 2,840 (30.2%) |
| 4 Vehicles | 1,167 (10.6%) | 1,279 (13.6%) |
| 5 or more Vehicles | 997 (9.1%) | 676 (7.2%) |
| Total | 11,010 (100.0%) | 9,393 (100.0%) |
Commute Time in Cheatham County
The most frequently occuring commute durations in Cheatham County are 45 to 59 minutes (3,685 commuters, 20.1%), 30 to 34 minutes (3,427 commuters, 18.7%), and 20 to 24 minutes (1,905 commuters, 10.4%).
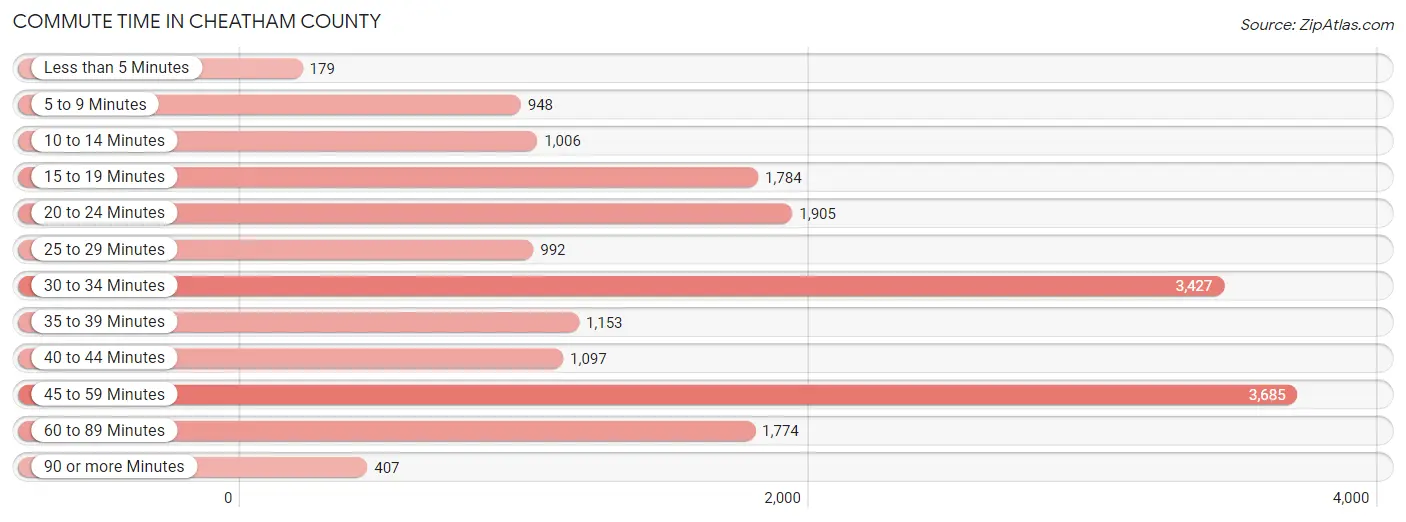
| Commute Time | # Commuters | % Commuters |
| Less than 5 Minutes | 179 | 1.0% |
| 5 to 9 Minutes | 948 | 5.2% |
| 10 to 14 Minutes | 1,006 | 5.5% |
| 15 to 19 Minutes | 1,784 | 9.7% |
| 20 to 24 Minutes | 1,905 | 10.4% |
| 25 to 29 Minutes | 992 | 5.4% |
| 30 to 34 Minutes | 3,427 | 18.7% |
| 35 to 39 Minutes | 1,153 | 6.3% |
| 40 to 44 Minutes | 1,097 | 6.0% |
| 45 to 59 Minutes | 3,685 | 20.1% |
| 60 to 89 Minutes | 1,774 | 9.7% |
| 90 or more Minutes | 407 | 2.2% |
Commute Time by Sex in Cheatham County
The most common commute times in Cheatham County are 30 to 34 minutes (2,184 commuters, 21.4%) for males and 45 to 59 minutes (1,832 commuters, 22.5%) for females.
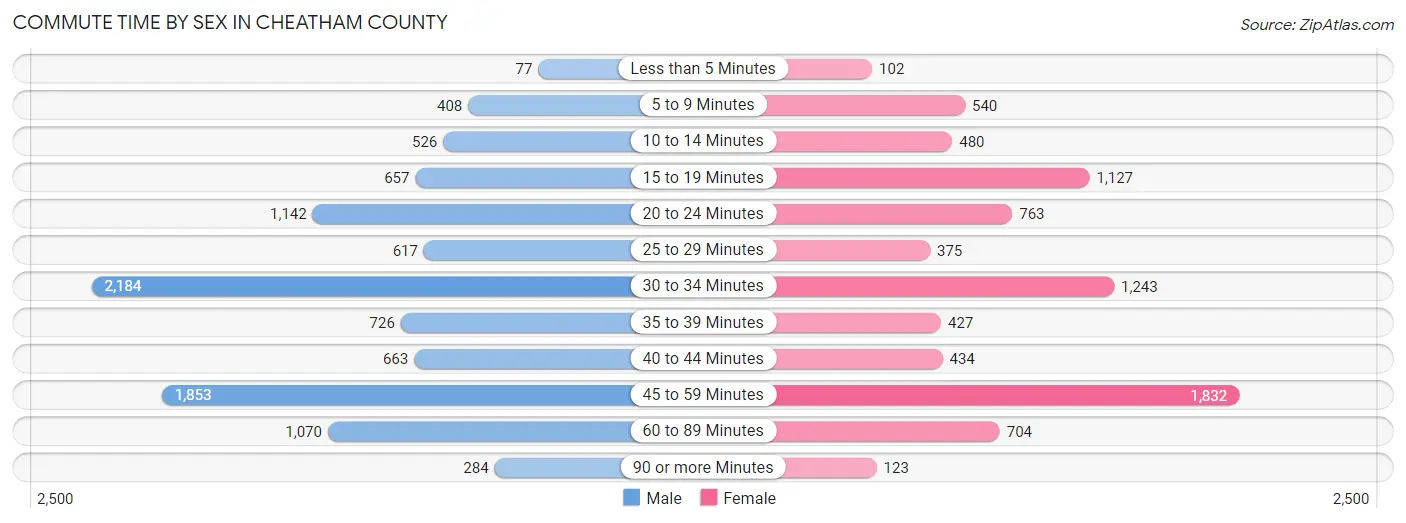
| Commute Time | Male | Female |
| Less than 5 Minutes | 77 (0.7%) | 102 (1.3%) |
| 5 to 9 Minutes | 408 (4.0%) | 540 (6.6%) |
| 10 to 14 Minutes | 526 (5.1%) | 480 (5.9%) |
| 15 to 19 Minutes | 657 (6.4%) | 1,127 (13.8%) |
| 20 to 24 Minutes | 1,142 (11.2%) | 763 (9.4%) |
| 25 to 29 Minutes | 617 (6.0%) | 375 (4.6%) |
| 30 to 34 Minutes | 2,184 (21.4%) | 1,243 (15.2%) |
| 35 to 39 Minutes | 726 (7.1%) | 427 (5.2%) |
| 40 to 44 Minutes | 663 (6.5%) | 434 (5.3%) |
| 45 to 59 Minutes | 1,853 (18.1%) | 1,832 (22.5%) |
| 60 to 89 Minutes | 1,070 (10.5%) | 704 (8.6%) |
| 90 or more Minutes | 284 (2.8%) | 123 (1.5%) |
Time of Departure to Work by Sex in Cheatham County
The most frequent times of departure to work in Cheatham County are 6:00 AM to 6:29 AM (1,736, 17.0%) for males and 6:30 AM to 6:59 AM (1,353, 16.6%) for females.
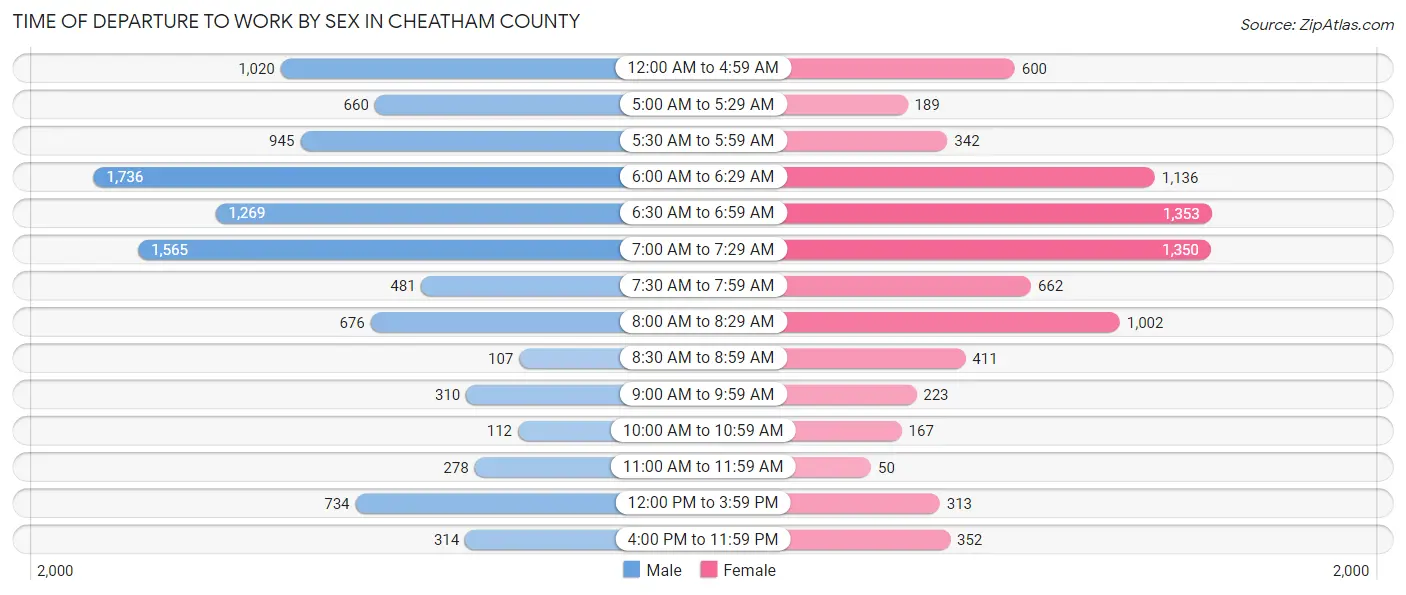
| Time of Departure | Male | Female |
| 12:00 AM to 4:59 AM | 1,020 (10.0%) | 600 (7.4%) |
| 5:00 AM to 5:29 AM | 660 (6.5%) | 189 (2.3%) |
| 5:30 AM to 5:59 AM | 945 (9.3%) | 342 (4.2%) |
| 6:00 AM to 6:29 AM | 1,736 (17.0%) | 1,136 (13.9%) |
| 6:30 AM to 6:59 AM | 1,269 (12.4%) | 1,353 (16.6%) |
| 7:00 AM to 7:29 AM | 1,565 (15.3%) | 1,350 (16.6%) |
| 7:30 AM to 7:59 AM | 481 (4.7%) | 662 (8.1%) |
| 8:00 AM to 8:29 AM | 676 (6.6%) | 1,002 (12.3%) |
| 8:30 AM to 8:59 AM | 107 (1.1%) | 411 (5.0%) |
| 9:00 AM to 9:59 AM | 310 (3.0%) | 223 (2.7%) |
| 10:00 AM to 10:59 AM | 112 (1.1%) | 167 (2.1%) |
| 11:00 AM to 11:59 AM | 278 (2.7%) | 50 (0.6%) |
| 12:00 PM to 3:59 PM | 734 (7.2%) | 313 (3.8%) |
| 4:00 PM to 11:59 PM | 314 (3.1%) | 352 (4.3%) |
| Total | 10,207 (100.0%) | 8,150 (100.0%) |
Housing Occupancy in Cheatham County
Occupancy by Ownership in Cheatham County
Of the total 15,708 dwellings in Cheatham County, owner-occupied units account for 12,749 (81.2%), while renter-occupied units make up 2,959 (18.8%).
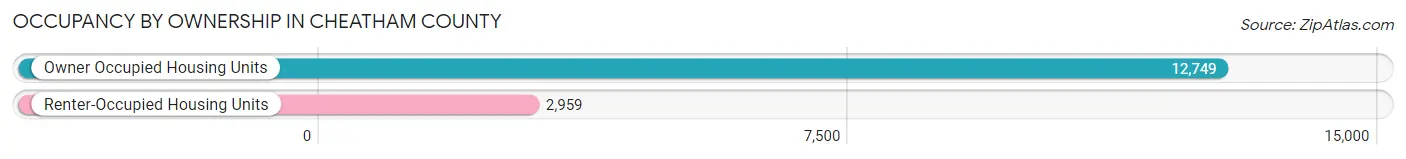
| Occupancy | # Housing Units | % Housing Units |
| Owner Occupied Housing Units | 12,749 | 81.2% |
| Renter-Occupied Housing Units | 2,959 | 18.8% |
| Total Occupied Housing Units | 15,708 | 100.0% |
Occupancy by Household Size in Cheatham County
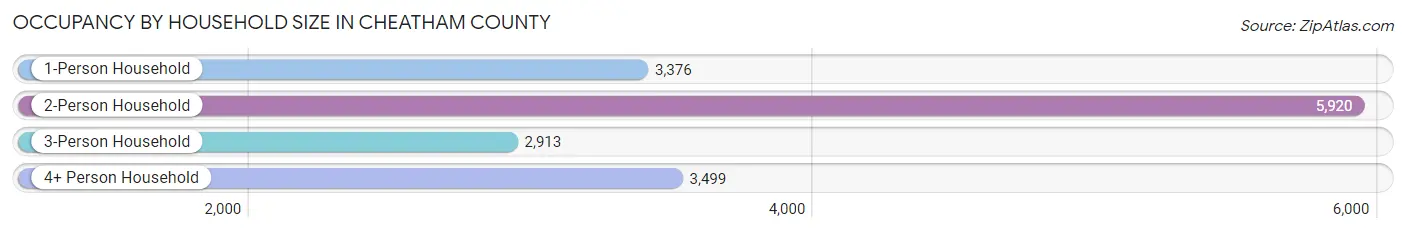
| Household Size | # Housing Units | % Housing Units |
| 1-Person Household | 3,376 | 21.5% |
| 2-Person Household | 5,920 | 37.7% |
| 3-Person Household | 2,913 | 18.5% |
| 4+ Person Household | 3,499 | 22.3% |
| Total Housing Units | 15,708 | 100.0% |
Occupancy by Ownership by Household Size in Cheatham County
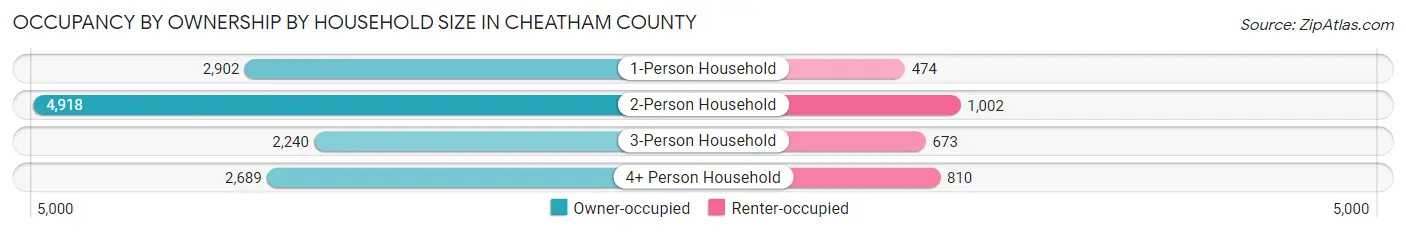
| Household Size | Owner-occupied | Renter-occupied |
| 1-Person Household | 2,902 (86.0%) | 474 (14.0%) |
| 2-Person Household | 4,918 (83.1%) | 1,002 (16.9%) |
| 3-Person Household | 2,240 (76.9%) | 673 (23.1%) |
| 4+ Person Household | 2,689 (76.8%) | 810 (23.2%) |
| Total Housing Units | 12,749 (81.2%) | 2,959 (18.8%) |
Occupancy by Educational Attainment in Cheatham County
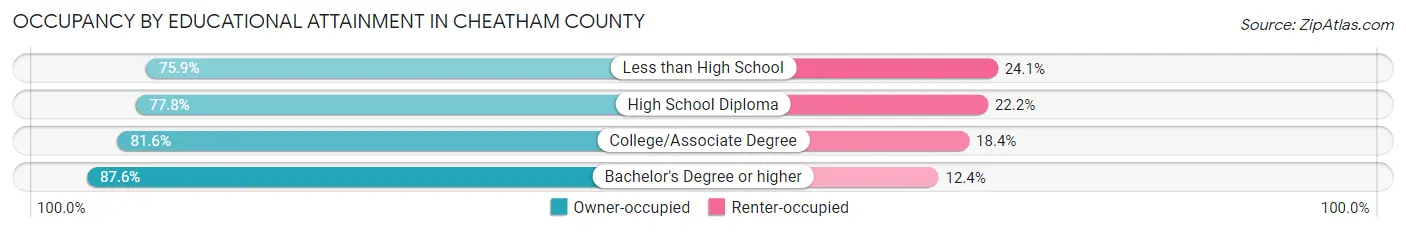
| Household Size | Owner-occupied | Renter-occupied |
| Less than High School | 1,033 (75.9%) | 328 (24.1%) |
| High School Diploma | 4,628 (77.8%) | 1,318 (22.2%) |
| College/Associate Degree | 3,679 (81.6%) | 832 (18.4%) |
| Bachelor's Degree or higher | 3,409 (87.6%) | 481 (12.4%) |
Occupancy by Age of Householder in Cheatham County
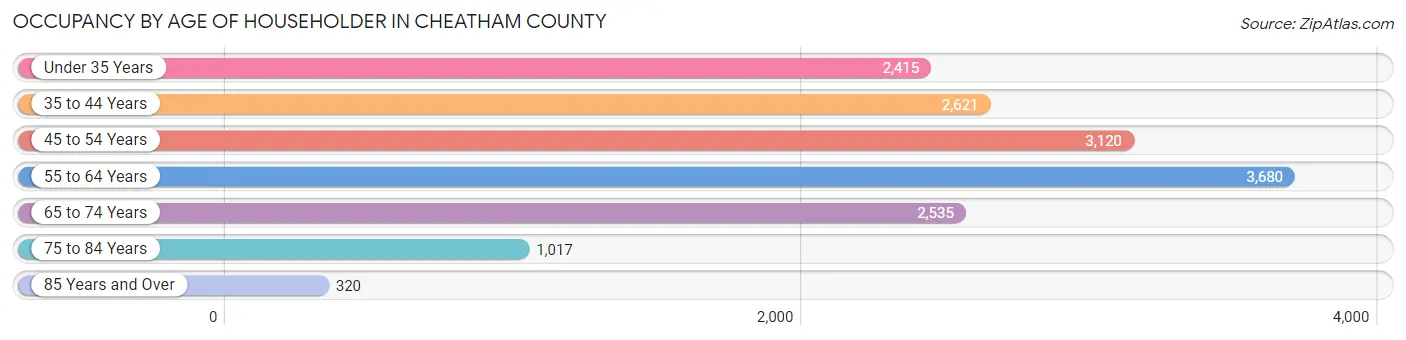
| Age Bracket | # Households | % Households |
| Under 35 Years | 2,415 | 15.4% |
| 35 to 44 Years | 2,621 | 16.7% |
| 45 to 54 Years | 3,120 | 19.9% |
| 55 to 64 Years | 3,680 | 23.4% |
| 65 to 74 Years | 2,535 | 16.1% |
| 75 to 84 Years | 1,017 | 6.5% |
| 85 Years and Over | 320 | 2.0% |
| Total | 15,708 | 100.0% |
Housing Finances in Cheatham County
Median Income by Occupancy in Cheatham County
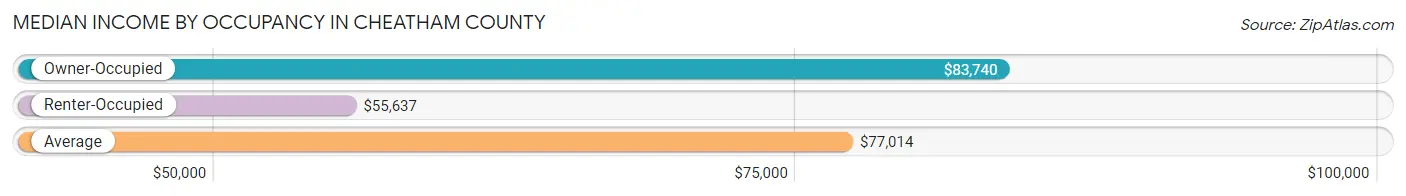
| Occupancy Type | # Households | Median Income |
| Owner-Occupied | 12,749 (81.2%) | $83,740 |
| Renter-Occupied | 2,959 (18.8%) | $55,637 |
| Average | 15,708 (100.0%) | $77,014 |
Occupancy by Householder Income Bracket in Cheatham County
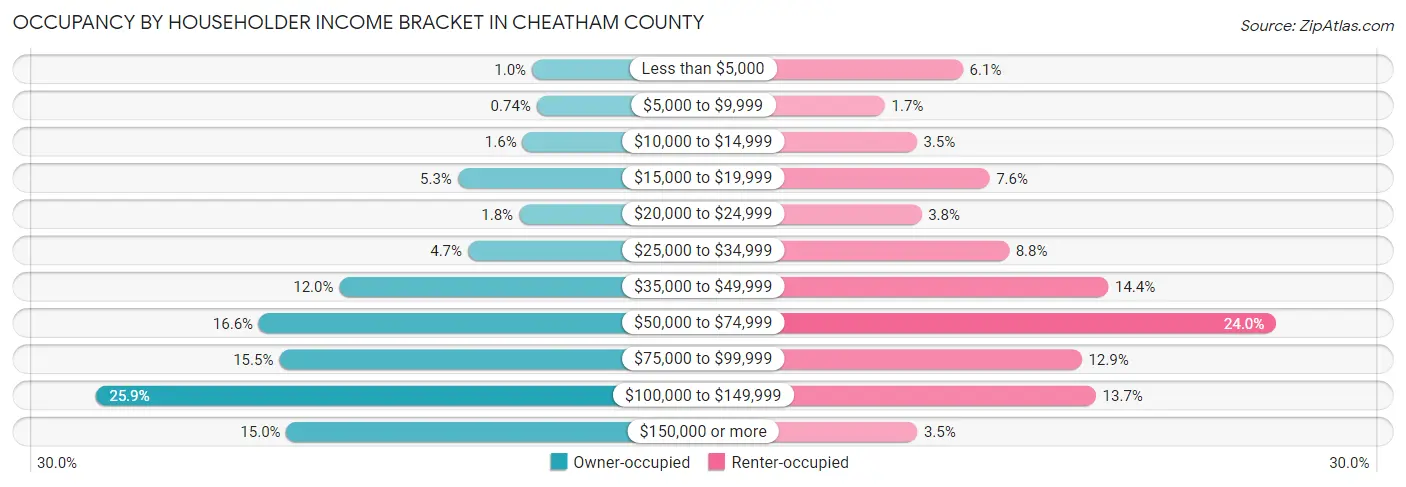
| Income Bracket | Owner-occupied | Renter-occupied |
| Less than $5,000 | 129 (1.0%) | 181 (6.1%) |
| $5,000 to $9,999 | 94 (0.7%) | 49 (1.7%) |
| $10,000 to $14,999 | 198 (1.5%) | 103 (3.5%) |
| $15,000 to $19,999 | 669 (5.2%) | 226 (7.6%) |
| $20,000 to $24,999 | 223 (1.8%) | 111 (3.7%) |
| $25,000 to $34,999 | 596 (4.7%) | 259 (8.7%) |
| $35,000 to $49,999 | 1,533 (12.0%) | 427 (14.4%) |
| $50,000 to $74,999 | 2,117 (16.6%) | 711 (24.0%) |
| $75,000 to $99,999 | 1,970 (15.4%) | 382 (12.9%) |
| $100,000 to $149,999 | 3,302 (25.9%) | 406 (13.7%) |
| $150,000 or more | 1,918 (15.0%) | 104 (3.5%) |
| Total | 12,749 (100.0%) | 2,959 (100.0%) |
Monthly Housing Cost Tiers in Cheatham County
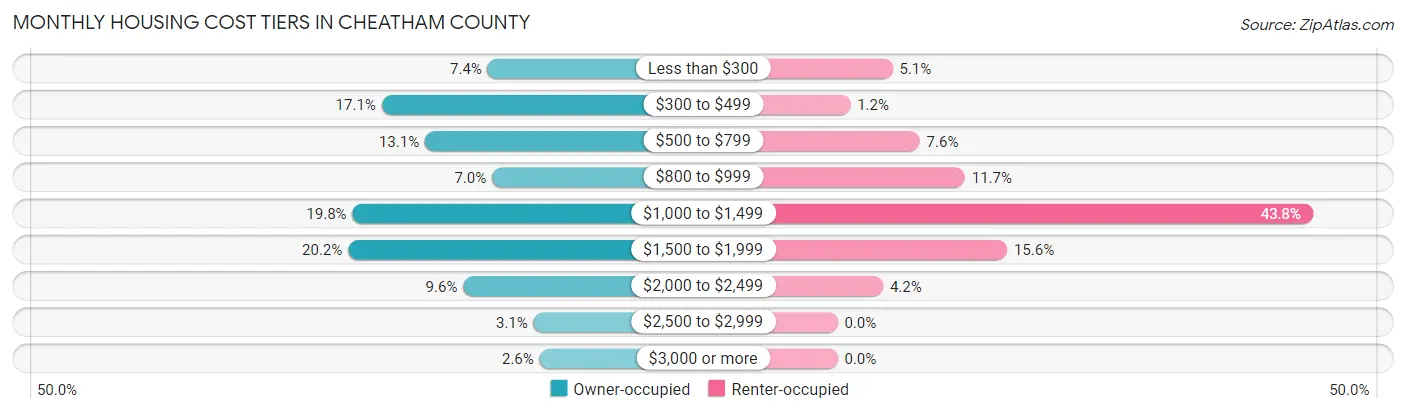
| Monthly Cost | Owner-occupied | Renter-occupied |
| Less than $300 | 939 (7.4%) | 150 (5.1%) |
| $300 to $499 | 2,184 (17.1%) | 35 (1.2%) |
| $500 to $799 | 1,675 (13.1%) | 224 (7.6%) |
| $800 to $999 | 889 (7.0%) | 347 (11.7%) |
| $1,000 to $1,499 | 2,527 (19.8%) | 1,295 (43.8%) |
| $1,500 to $1,999 | 2,578 (20.2%) | 462 (15.6%) |
| $2,000 to $2,499 | 1,227 (9.6%) | 124 (4.2%) |
| $2,500 to $2,999 | 400 (3.1%) | 0 (0.0%) |
| $3,000 or more | 330 (2.6%) | 0 (0.0%) |
| Total | 12,749 (100.0%) | 2,959 (100.0%) |
Physical Housing Characteristics in Cheatham County
Housing Structures in Cheatham County
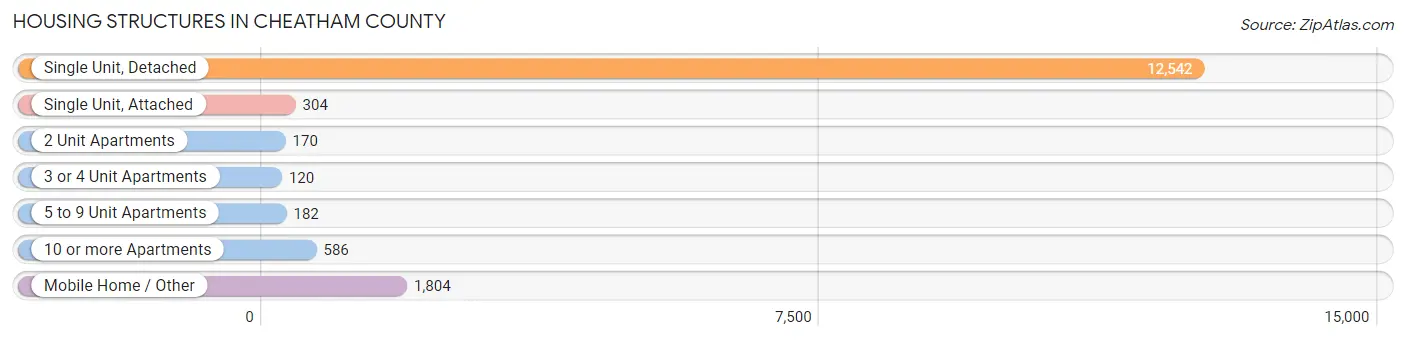
| Structure Type | # Housing Units | % Housing Units |
| Single Unit, Detached | 12,542 | 79.8% |
| Single Unit, Attached | 304 | 1.9% |
| 2 Unit Apartments | 170 | 1.1% |
| 3 or 4 Unit Apartments | 120 | 0.8% |
| 5 to 9 Unit Apartments | 182 | 1.2% |
| 10 or more Apartments | 586 | 3.7% |
| Mobile Home / Other | 1,804 | 11.5% |
| Total | 15,708 | 100.0% |
Housing Structures by Occupancy in Cheatham County
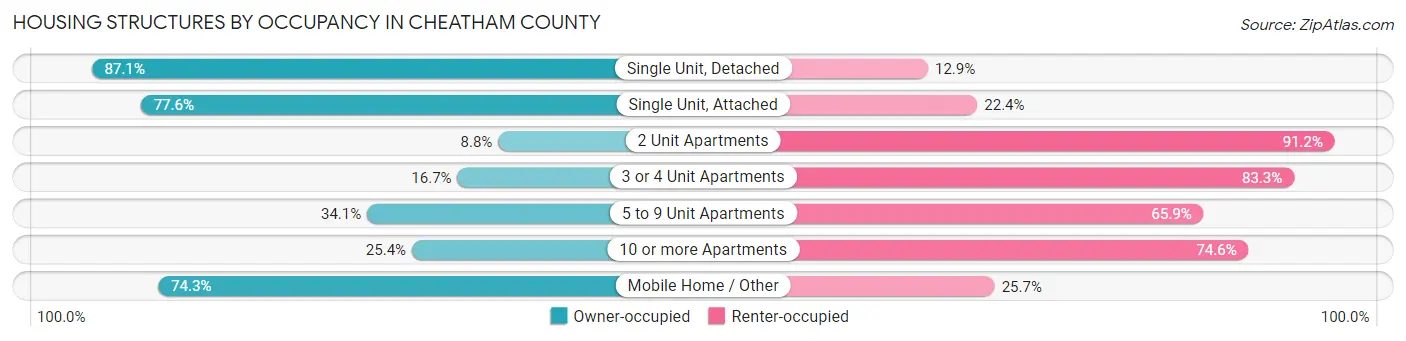
| Structure Type | Owner-occupied | Renter-occupied |
| Single Unit, Detached | 10,927 (87.1%) | 1,615 (12.9%) |
| Single Unit, Attached | 236 (77.6%) | 68 (22.4%) |
| 2 Unit Apartments | 15 (8.8%) | 155 (91.2%) |
| 3 or 4 Unit Apartments | 20 (16.7%) | 100 (83.3%) |
| 5 to 9 Unit Apartments | 62 (34.1%) | 120 (65.9%) |
| 10 or more Apartments | 149 (25.4%) | 437 (74.6%) |
| Mobile Home / Other | 1,340 (74.3%) | 464 (25.7%) |
| Total | 12,749 (81.2%) | 2,959 (18.8%) |
Housing Structures by Number of Rooms in Cheatham County
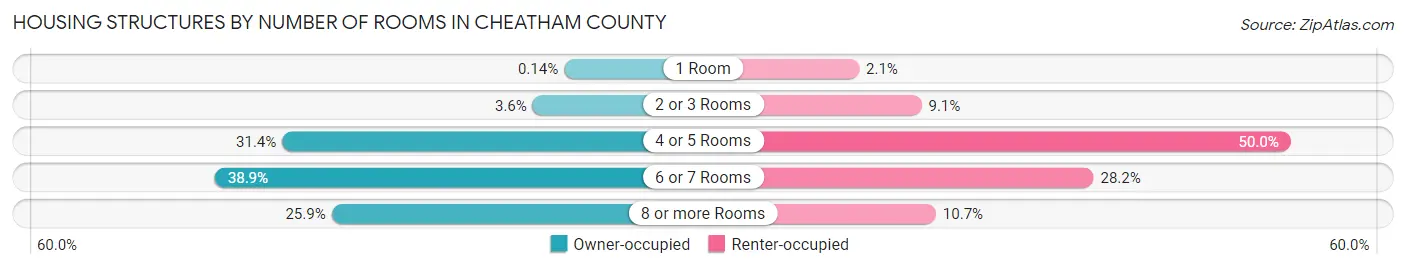
| Number of Rooms | Owner-occupied | Renter-occupied |
| 1 Room | 18 (0.1%) | 63 (2.1%) |
| 2 or 3 Rooms | 461 (3.6%) | 268 (9.1%) |
| 4 or 5 Rooms | 4,006 (31.4%) | 1,480 (50.0%) |
| 6 or 7 Rooms | 4,957 (38.9%) | 833 (28.1%) |
| 8 or more Rooms | 3,307 (25.9%) | 315 (10.6%) |
| Total | 12,749 (100.0%) | 2,959 (100.0%) |
Housing Structure by Heating Type in Cheatham County
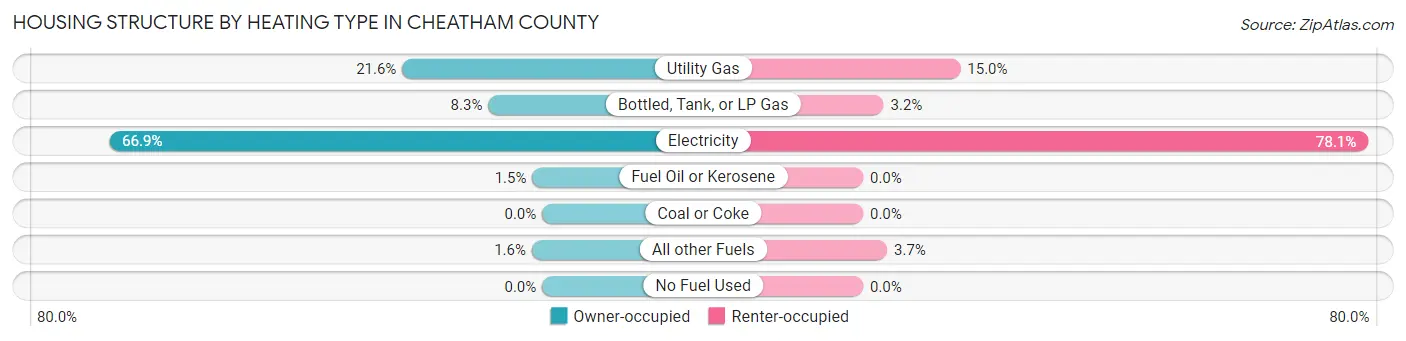
| Heating Type | Owner-occupied | Renter-occupied |
| Utility Gas | 2,757 (21.6%) | 445 (15.0%) |
| Bottled, Tank, or LP Gas | 1,062 (8.3%) | 94 (3.2%) |
| Electricity | 8,533 (66.9%) | 2,310 (78.1%) |
| Fuel Oil or Kerosene | 194 (1.5%) | 0 (0.0%) |
| Coal or Coke | 0 (0.0%) | 0 (0.0%) |
| All other Fuels | 203 (1.6%) | 110 (3.7%) |
| No Fuel Used | 0 (0.0%) | 0 (0.0%) |
| Total | 12,749 (100.0%) | 2,959 (100.0%) |
Household Vehicle Usage in Cheatham County
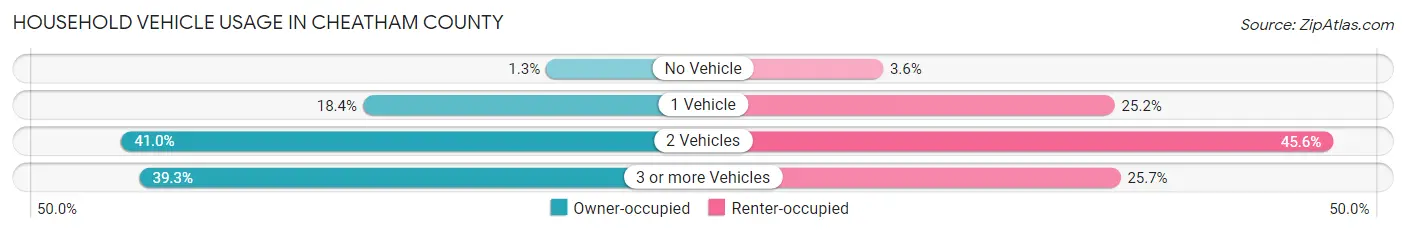
| Vehicles per Household | Owner-occupied | Renter-occupied |
| No Vehicle | 170 (1.3%) | 105 (3.5%) |
| 1 Vehicle | 2,350 (18.4%) | 745 (25.2%) |
| 2 Vehicles | 5,223 (41.0%) | 1,348 (45.6%) |
| 3 or more Vehicles | 5,006 (39.3%) | 761 (25.7%) |
| Total | 12,749 (100.0%) | 2,959 (100.0%) |
Real Estate & Mortgages in Cheatham County
Real Estate and Mortgage Overview in Cheatham County
| Characteristic | Without Mortgage | With Mortgage |
| Housing Units | 4,940 | 7,809 |
| Median Property Value | $220,600 | $285,900 |
| Median Household Income | $57,855 | $1,499 |
| Monthly Housing Costs | $450 | $330 |
| Real Estate Taxes | $1,319 | $298 |
Property Value by Mortgage Status in Cheatham County
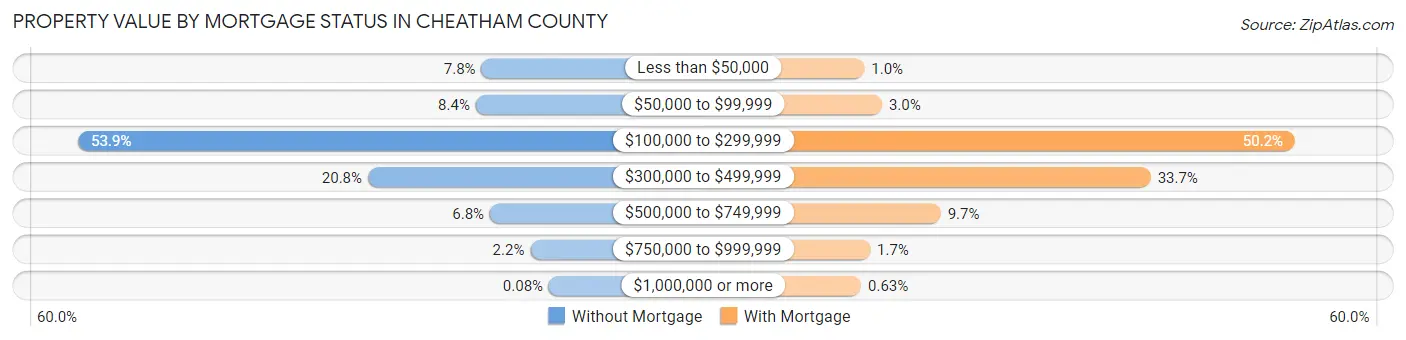
| Property Value | Without Mortgage | With Mortgage |
| Less than $50,000 | 385 (7.8%) | 79 (1.0%) |
| $50,000 to $99,999 | 417 (8.4%) | 236 (3.0%) |
| $100,000 to $299,999 | 2,662 (53.9%) | 3,921 (50.2%) |
| $300,000 to $499,999 | 1,026 (20.8%) | 2,634 (33.7%) |
| $500,000 to $749,999 | 337 (6.8%) | 760 (9.7%) |
| $750,000 to $999,999 | 109 (2.2%) | 130 (1.7%) |
| $1,000,000 or more | 4 (0.1%) | 49 (0.6%) |
| Total | 4,940 (100.0%) | 7,809 (100.0%) |
Household Income by Mortgage Status in Cheatham County
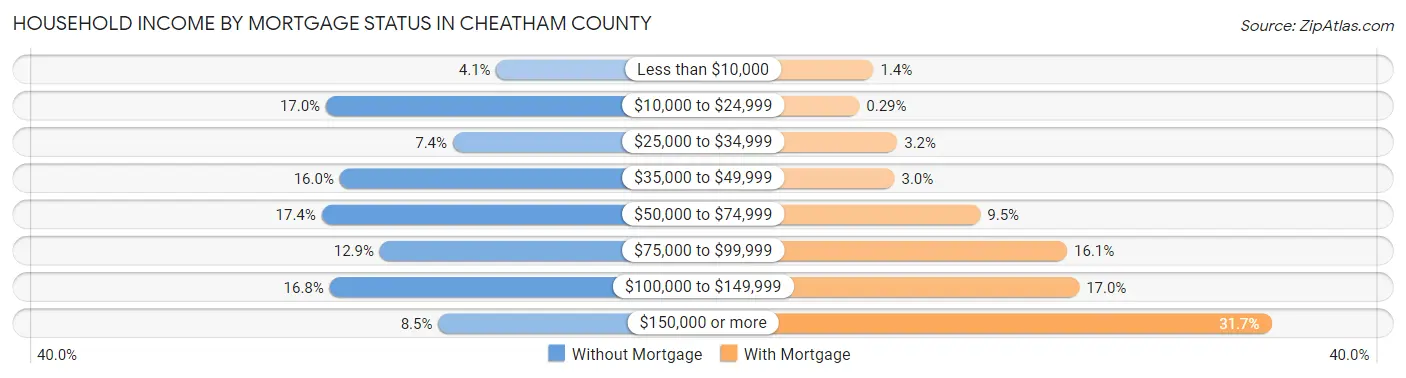
| Household Income | Without Mortgage | With Mortgage |
| Less than $10,000 | 200 (4.1%) | 107 (1.4%) |
| $10,000 to $24,999 | 842 (17.0%) | 23 (0.3%) |
| $25,000 to $34,999 | 364 (7.4%) | 248 (3.2%) |
| $35,000 to $49,999 | 790 (16.0%) | 232 (3.0%) |
| $50,000 to $74,999 | 858 (17.4%) | 743 (9.5%) |
| $75,000 to $99,999 | 639 (12.9%) | 1,259 (16.1%) |
| $100,000 to $149,999 | 828 (16.8%) | 1,331 (17.0%) |
| $150,000 or more | 419 (8.5%) | 2,474 (31.7%) |
| Total | 4,940 (100.0%) | 7,809 (100.0%) |
Property Value to Household Income Ratio in Cheatham County
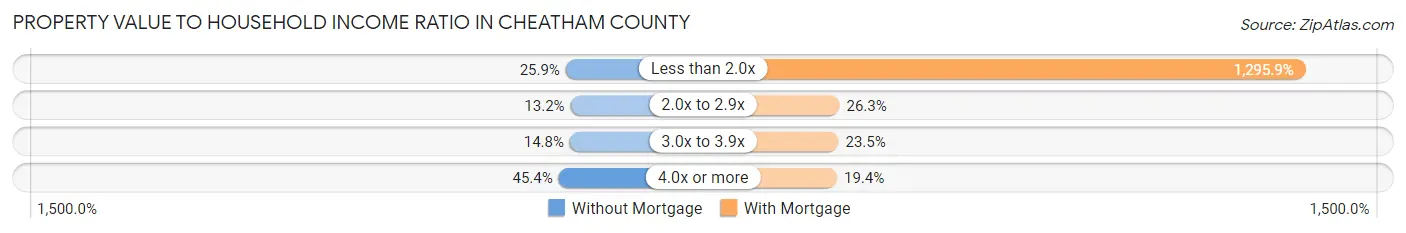
| Value-to-Income Ratio | Without Mortgage | With Mortgage |
| Less than 2.0x | 1,281 (25.9%) | 101,198 (1,295.9%) |
| 2.0x to 2.9x | 650 (13.2%) | 2,051 (26.3%) |
| 3.0x to 3.9x | 730 (14.8%) | 1,831 (23.4%) |
| 4.0x or more | 2,241 (45.4%) | 1,511 (19.4%) |
| Total | 4,940 (100.0%) | 7,809 (100.0%) |
Real Estate Taxes by Mortgage Status in Cheatham County
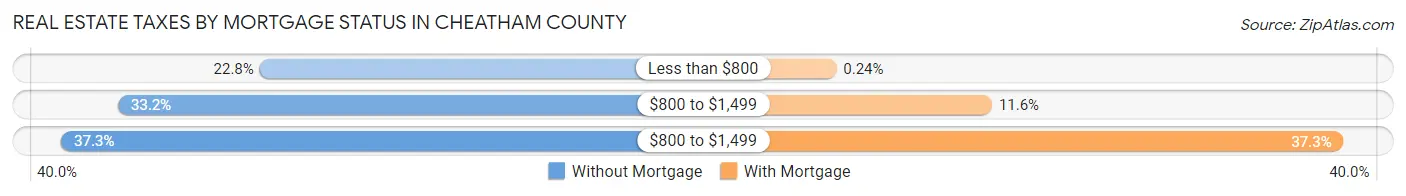
| Property Taxes | Without Mortgage | With Mortgage |
| Less than $800 | 1,128 (22.8%) | 19 (0.2%) |
| $800 to $1,499 | 1,639 (33.2%) | 907 (11.6%) |
| $800 to $1,499 | 1,844 (37.3%) | 2,912 (37.3%) |
| Total | 4,940 (100.0%) | 7,809 (100.0%) |
Health & Disability in Cheatham County
Health Insurance Coverage by Age in Cheatham County
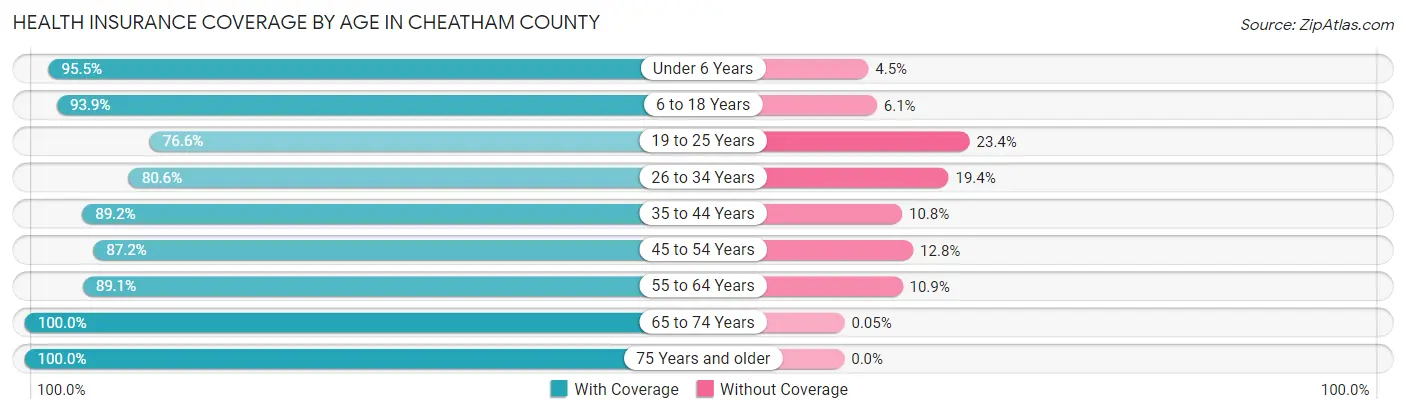
| Age Bracket | With Coverage | Without Coverage |
| Under 6 Years | 2,533 (95.5%) | 119 (4.5%) |
| 6 to 18 Years | 6,157 (93.9%) | 398 (6.1%) |
| 19 to 25 Years | 2,286 (76.6%) | 697 (23.4%) |
| 26 to 34 Years | 3,867 (80.6%) | 933 (19.4%) |
| 35 to 44 Years | 4,778 (89.2%) | 577 (10.8%) |
| 45 to 54 Years | 5,123 (87.2%) | 755 (12.8%) |
| 55 to 64 Years | 5,674 (89.1%) | 691 (10.9%) |
| 65 to 74 Years | 4,132 (100.0%) | 2 (0.1%) |
| 75 Years and older | 2,123 (100.0%) | 0 (0.0%) |
| Total | 36,673 (89.8%) | 4,172 (10.2%) |
Health Insurance Coverage by Citizenship Status in Cheatham County
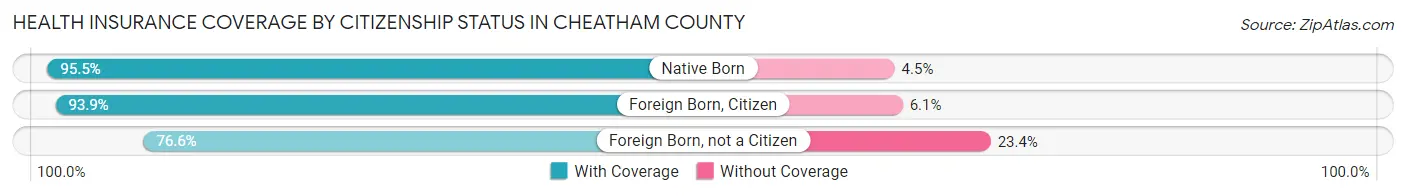
| Citizenship Status | With Coverage | Without Coverage |
| Native Born | 2,533 (95.5%) | 119 (4.5%) |
| Foreign Born, Citizen | 6,157 (93.9%) | 398 (6.1%) |
| Foreign Born, not a Citizen | 2,286 (76.6%) | 697 (23.4%) |
Health Insurance Coverage by Household Income in Cheatham County
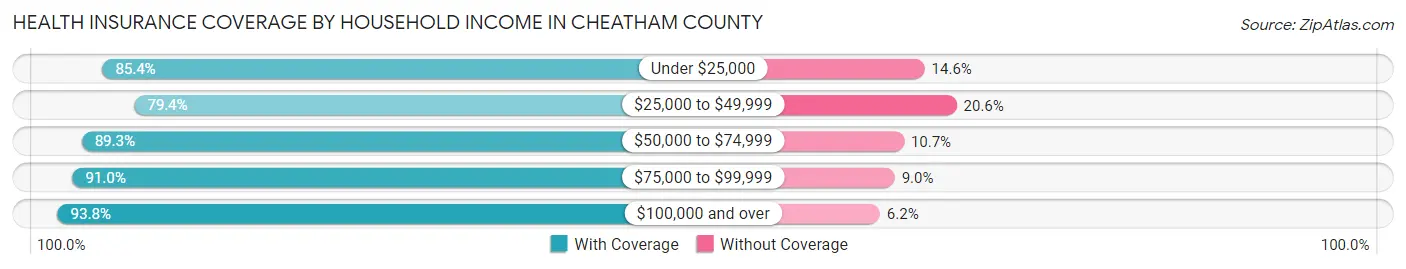
| Household Income | With Coverage | Without Coverage |
| Under $25,000 | 2,922 (85.4%) | 499 (14.6%) |
| $25,000 to $49,999 | 4,606 (79.4%) | 1,193 (20.6%) |
| $50,000 to $74,999 | 6,328 (89.3%) | 759 (10.7%) |
| $75,000 to $99,999 | 6,467 (91.0%) | 638 (9.0%) |
| $100,000 and over | 16,306 (93.8%) | 1,077 (6.2%) |
Public vs Private Health Insurance Coverage by Age in Cheatham County
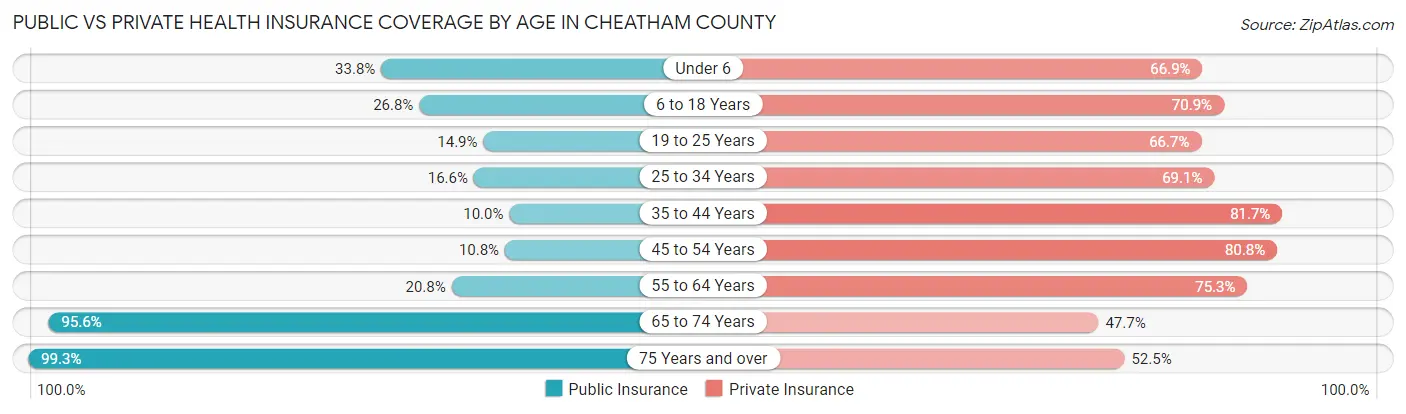
| Age Bracket | Public Insurance | Private Insurance |
| Under 6 | 897 (33.8%) | 1,775 (66.9%) |
| 6 to 18 Years | 1,754 (26.8%) | 4,649 (70.9%) |
| 19 to 25 Years | 443 (14.8%) | 1,990 (66.7%) |
| 25 to 34 Years | 798 (16.6%) | 3,318 (69.1%) |
| 35 to 44 Years | 537 (10.0%) | 4,377 (81.7%) |
| 45 to 54 Years | 637 (10.8%) | 4,749 (80.8%) |
| 55 to 64 Years | 1,321 (20.7%) | 4,791 (75.3%) |
| 65 to 74 Years | 3,951 (95.6%) | 1,970 (47.6%) |
| 75 Years and over | 2,109 (99.3%) | 1,114 (52.5%) |
| Total | 12,447 (30.5%) | 28,733 (70.4%) |
Disability Status by Sex by Age in Cheatham County
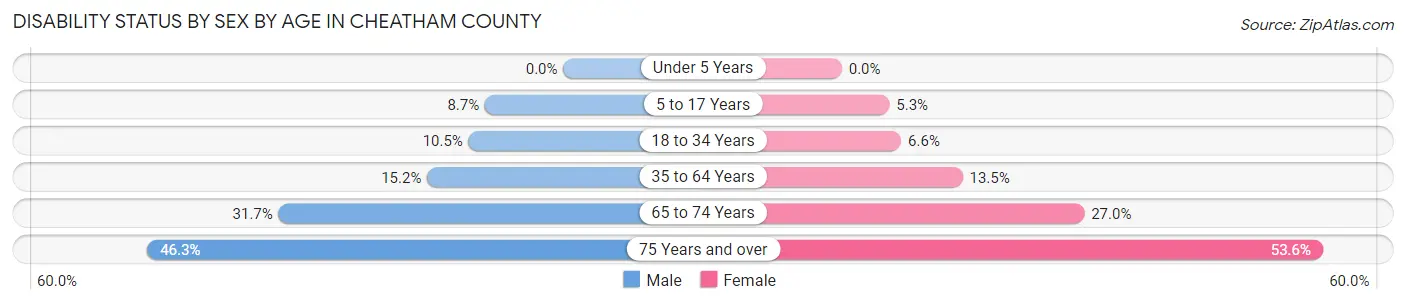
| Age Bracket | Male | Female |
| Under 5 Years | 0 (0.0%) | 0 (0.0%) |
| 5 to 17 Years | 300 (8.7%) | 165 (5.3%) |
| 18 to 34 Years | 444 (10.5%) | 261 (6.6%) |
| 35 to 64 Years | 1,323 (15.2%) | 1,193 (13.5%) |
| 65 to 74 Years | 652 (31.7%) | 561 (27.0%) |
| 75 Years and over | 450 (46.3%) | 617 (53.6%) |
Disability Class by Sex by Age in Cheatham County
Disability Class: Hearing Difficulty
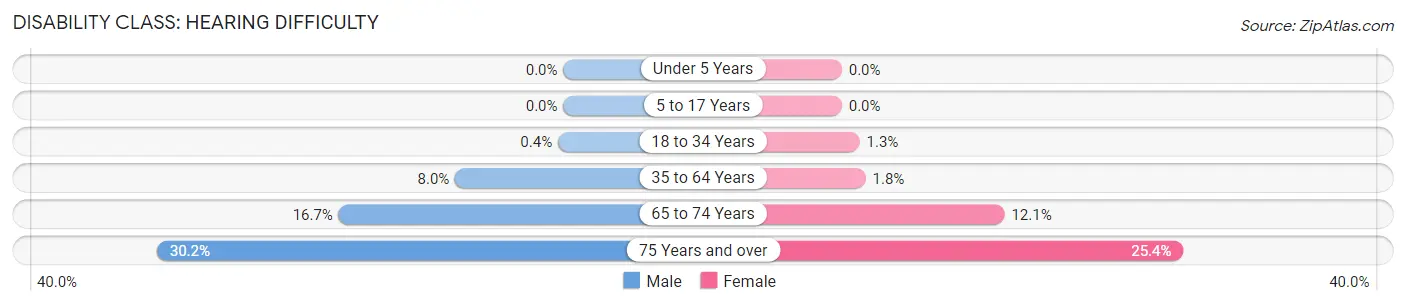
| Age Bracket | Male | Female |
| Under 5 Years | 0 (0.0%) | 0 (0.0%) |
| 5 to 17 Years | 0 (0.0%) | 0 (0.0%) |
| 18 to 34 Years | 17 (0.4%) | 52 (1.3%) |
| 35 to 64 Years | 701 (8.0%) | 157 (1.8%) |
| 65 to 74 Years | 343 (16.7%) | 251 (12.1%) |
| 75 Years and over | 293 (30.2%) | 292 (25.4%) |
Disability Class: Vision Difficulty
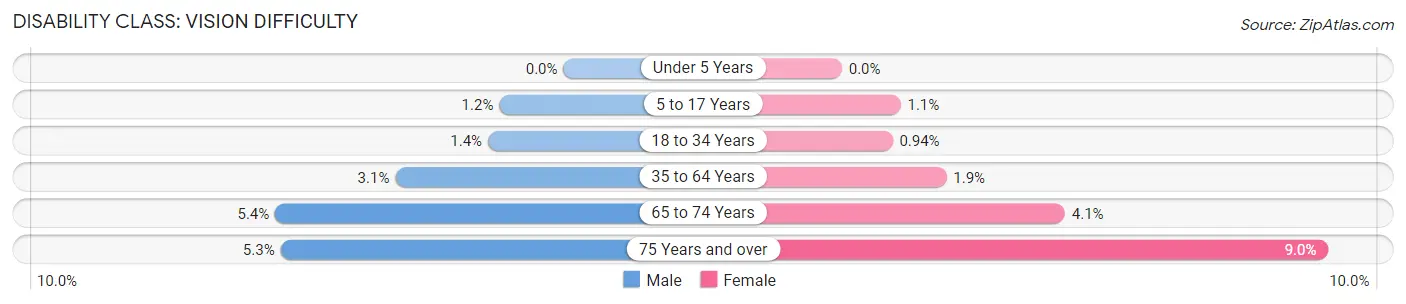
| Age Bracket | Male | Female |
| Under 5 Years | 0 (0.0%) | 0 (0.0%) |
| 5 to 17 Years | 41 (1.2%) | 34 (1.1%) |
| 18 to 34 Years | 59 (1.4%) | 37 (0.9%) |
| 35 to 64 Years | 272 (3.1%) | 172 (1.9%) |
| 65 to 74 Years | 110 (5.3%) | 86 (4.1%) |
| 75 Years and over | 51 (5.2%) | 104 (9.0%) |
Disability Class: Cognitive Difficulty
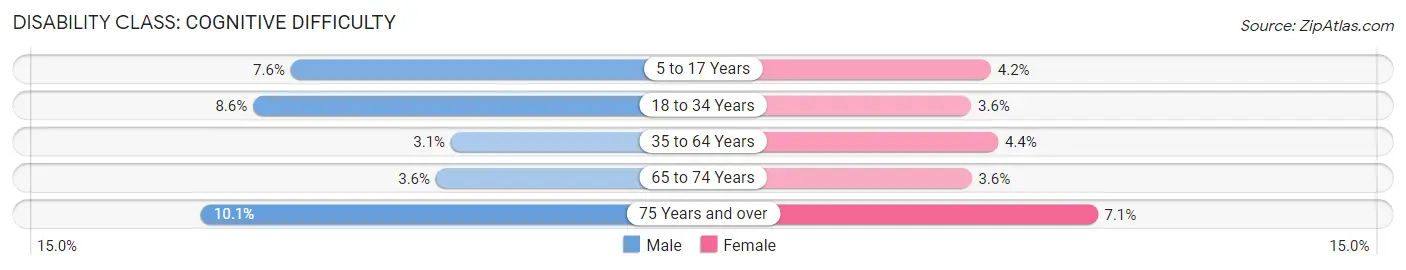
| Age Bracket | Male | Female |
| 5 to 17 Years | 261 (7.6%) | 129 (4.2%) |
| 18 to 34 Years | 364 (8.6%) | 142 (3.6%) |
| 35 to 64 Years | 273 (3.1%) | 386 (4.3%) |
| 65 to 74 Years | 73 (3.5%) | 75 (3.6%) |
| 75 Years and over | 98 (10.1%) | 82 (7.1%) |
Disability Class: Ambulatory Difficulty
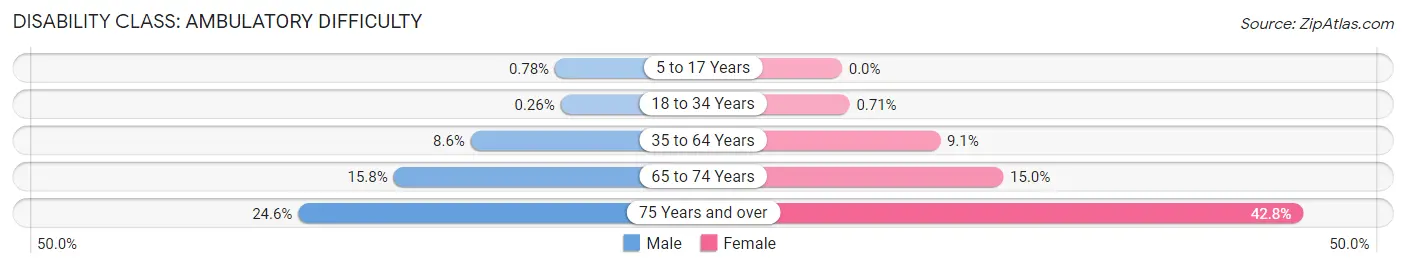
| Age Bracket | Male | Female |
| 5 to 17 Years | 27 (0.8%) | 0 (0.0%) |
| 18 to 34 Years | 11 (0.3%) | 28 (0.7%) |
| 35 to 64 Years | 751 (8.6%) | 808 (9.1%) |
| 65 to 74 Years | 324 (15.8%) | 311 (15.0%) |
| 75 Years and over | 239 (24.6%) | 493 (42.8%) |
Disability Class: Self-Care Difficulty
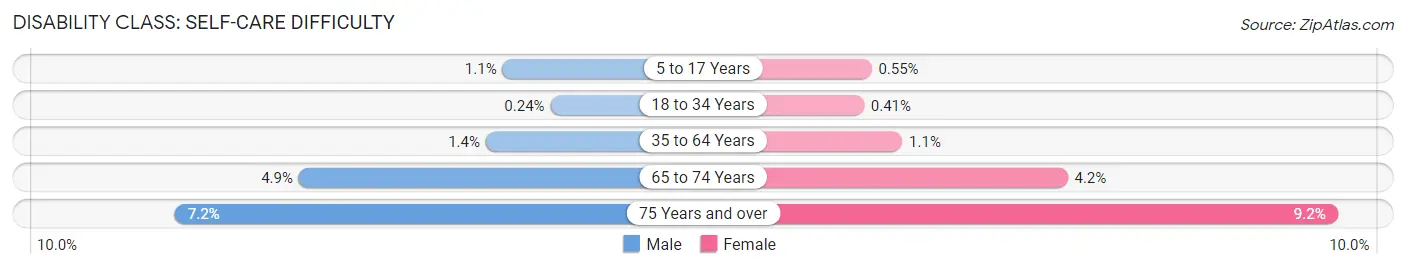
| Age Bracket | Male | Female |
| 5 to 17 Years | 39 (1.1%) | 17 (0.5%) |
| 18 to 34 Years | 10 (0.2%) | 16 (0.4%) |
| 35 to 64 Years | 126 (1.4%) | 99 (1.1%) |
| 65 to 74 Years | 101 (4.9%) | 87 (4.2%) |
| 75 Years and over | 70 (7.2%) | 106 (9.2%) |
Technology Access in Cheatham County
Computing Device Access in Cheatham County
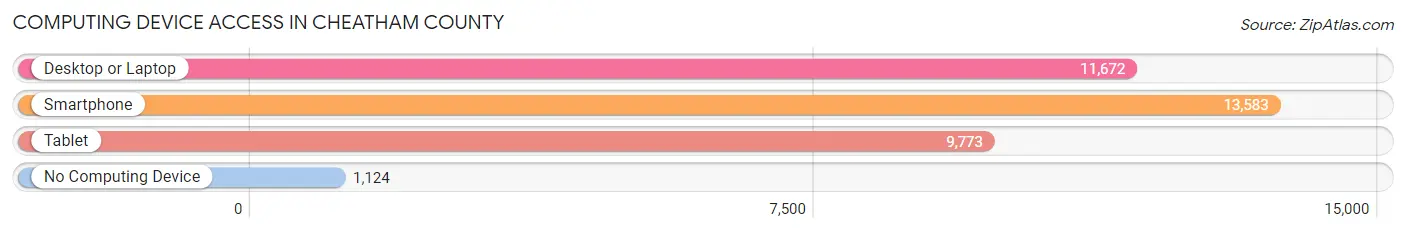
| Device Type | # Households | % Households |
| Desktop or Laptop | 11,672 | 74.3% |
| Smartphone | 13,583 | 86.5% |
| Tablet | 9,773 | 62.2% |
| No Computing Device | 1,124 | 7.2% |
| Total | 15,708 | 100.0% |
Internet Access in Cheatham County
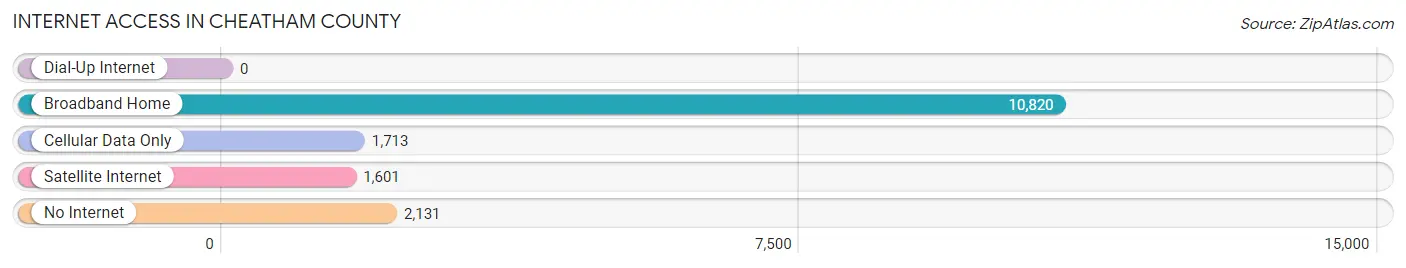
| Internet Type | # Households | % Households |
| Dial-Up Internet | 0 | 0.0% |
| Broadband Home | 10,820 | 68.9% |
| Cellular Data Only | 1,713 | 10.9% |
| Satellite Internet | 1,601 | 10.2% |
| No Internet | 2,131 | 13.6% |
| Total | 15,708 | 100.0% |
Cheatham County Summary
Cheatham County is located in the state of Tennessee, in the United States of America. It is situated in the central part of the state, and is bordered by Davidson, Robertson, Dickson, Montgomery, and Williamson counties. The county seat is Ashland City, and the county has a total area of 517 square miles. As of the 2010 census, the population of Cheatham County was 39,105.
History
Cheatham County was established in 1856, and was named after Confederate General and U.S. Senator from Tennessee, William B. Cheatham. The county was formed from parts of Davidson, Dickson, and Robertson counties. The county seat of Ashland City was established in 1859.
During the Civil War, Cheatham County was the site of several battles, including the Battle of Ashland City in 1862. The county was also the site of the Battle of Johnsonville in 1864, which was the last major battle of the war in Tennessee.
Geography
Cheatham County is located in the central part of Tennessee, and is bordered by Davidson, Robertson, Dickson, Montgomery, and Williamson counties. The county has a total area of 517 square miles, of which 514 square miles is land and 3 square miles is water. The county is located in the Nashville Metropolitan Statistical Area.
The terrain of Cheatham County is mostly rolling hills, with some flat areas in the northern part of the county. The Harpeth River runs through the county, and there are several creeks and streams in the area. The highest point in the county is located in the northern part of the county, and is known as the Cheatham Hill.
Economy
The economy of Cheatham County is largely based on agriculture and manufacturing. The county is home to several large farms, which produce a variety of crops, including corn, soybeans, wheat, and hay. The county is also home to several manufacturing companies, which produce a variety of products, including furniture, automotive parts, and textiles.
The county is also home to several tourist attractions, including the Cheatham Dam, the Harpeth River State Park, and the Cheatham County Historical Society Museum.
Demographics
As of the 2010 census, the population of Cheatham County was 39,105. The racial makeup of the county was 90.3% White, 6.2% African American, 0.5% Native American, 0.7% Asian, 0.1% Pacific Islander, 0.7% from other races, and 1.6% from two or more races. Hispanic or Latino of any race were 2.2% of the population.
The median income for a household in the county was $45,945, and the median income for a family was $54,945. The per capita income for the county was $22,945. About 10.2% of the population was below the poverty line.
Common Questions
What is Per Capita Income in Cheatham County?
Per Capita income in Cheatham County is $35,852.
What is the Median Family Income in Cheatham County?
Median Family Income in Cheatham County is $87,184.
What is the Median Household income in Cheatham County?
Median Household Income in Cheatham County is $77,014.
What is Income or Wage Gap in Cheatham County?
Income or Wage Gap in Cheatham County is 23.8%.
Women in Cheatham County earn 76.2 cents for every dollar earned by a man.
What is Family Income Deficit in Cheatham County?
Family Income Deficit in Cheatham County is $11,566.
Families that are below poverty line in Cheatham County earn $11,566 less on average than the poverty threshold level.
What is Inequality or Gini Index in Cheatham County?
Inequality or Gini Index in Cheatham County is 0.40.
What is the Total Population of Cheatham County?
Total Population of Cheatham County is 41,184.
What is the Total Male Population of Cheatham County?
Total Male Population of Cheatham County is 20,853.
What is the Total Female Population of Cheatham County?
Total Female Population of Cheatham County is 20,331.
What is the Ratio of Males per 100 Females in Cheatham County?
There are 102.57 Males per 100 Females in Cheatham County.
What is the Ratio of Females per 100 Males in Cheatham County?
There are 97.50 Females per 100 Males in Cheatham County.
What is the Median Population Age in Cheatham County?
Median Population Age in Cheatham County is 40.9 Years.
What is the Average Family Size in Cheatham County
Average Family Size in Cheatham County is 3.0 People.
What is the Average Household Size in Cheatham County
Average Household Size in Cheatham County is 2.6 People.
How Large is the Labor Force in Cheatham County?
There are 21,635 People in the Labor Forcein in Cheatham County.
What is the Percentage of People in the Labor Force in Cheatham County?
64.8% of People are in the Labor Force in Cheatham County.
What is the Unemployment Rate in Cheatham County?
Unemployment Rate in Cheatham County is 3.7%.