Zip Codes with the Highest Percentage of Population with a Degree in Bio, Nature & Agricultural in Cincinnati, OH
RELATED REPORTS & OPTIONS
Bio, Nature & Agricultural
Cincinnati
Compare Zip Codes
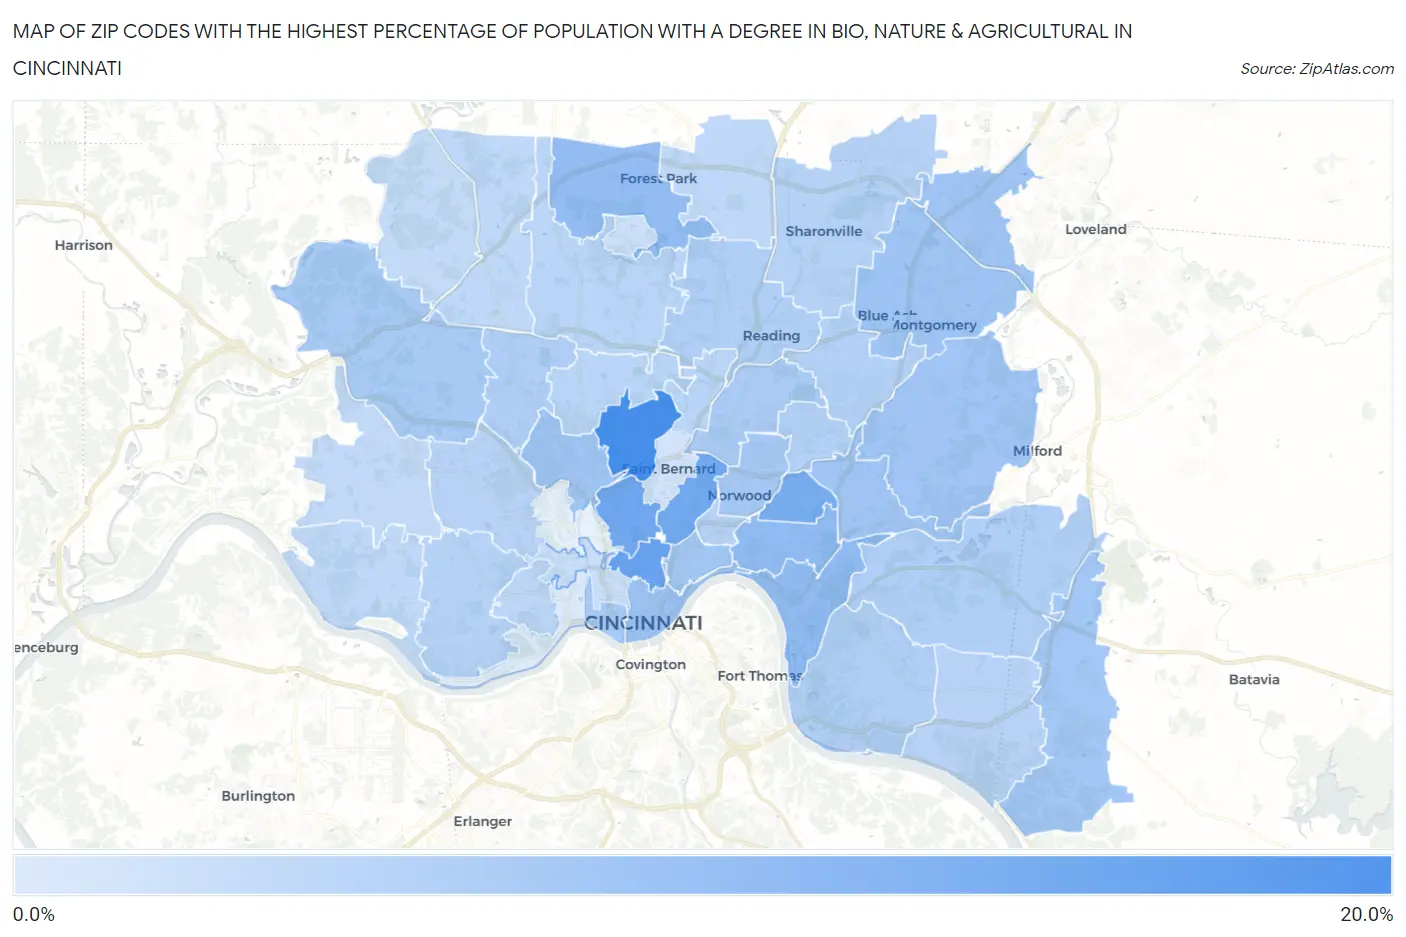
Map of Zip Codes with the Highest Percentage of Population with a Degree in Bio, Nature & Agricultural in Cincinnati
0.82%
17.5%
Zip Codes with the Highest Percentage of Population with a Degree in Bio, Nature & Agricultural in Cincinnati, OH
| Zip Code | % Graduates | vs State | vs National | |
| 1. | 45232 | 17.5% | 6.0%(+11.5)#72 | 6.4%(+11.2)#3,255 |
| 2. | 45219 | 13.6% | 6.0%(+7.66)#112 | 6.4%(+7.28)#5,003 |
| 3. | 45220 | 12.6% | 6.0%(+6.60)#129 | 6.4%(+6.22)#5,697 |
| 4. | 45229 | 12.2% | 6.0%(+6.26)#143 | 6.4%(+5.89)#5,965 |
| 5. | 45209 | 11.9% | 6.0%(+5.91)#153 | 6.4%(+5.54)#6,251 |
| 6. | 45208 | 9.0% | 6.0%(+3.07)#237 | 6.4%(+2.69)#9,472 |
| 7. | 45226 | 8.9% | 6.0%(+2.88)#252 | 6.4%(+2.51)#9,765 |
| 8. | 45240 | 8.7% | 6.0%(+2.68)#266 | 6.4%(+2.30)#10,077 |
| 9. | 45202 | 8.0% | 6.0%(+2.06)#293 | 6.4%(+1.68)#11,132 |
| 10. | 45242 | 7.5% | 6.0%(+1.50)#325 | 6.4%(+1.13)#12,218 |
| 11. | 45243 | 7.3% | 6.0%(+1.31)#336 | 6.4%(+0.933)#12,682 |
| 12. | 45223 | 7.3% | 6.0%(+1.31)#337 | 6.4%(+0.930)#12,688 |
| 13. | 45227 | 7.1% | 6.0%(+1.16)#343 | 6.4%(+0.784)#13,018 |
| 14. | 45249 | 7.1% | 6.0%(+1.15)#344 | 6.4%(+0.772)#13,043 |
| 15. | 45206 | 7.0% | 6.0%(+1.07)#350 | 6.4%(+0.689)#13,226 |
| 16. | 45245 | 6.8% | 6.0%(+0.865)#364 | 6.4%(+0.489)#13,721 |
| 17. | 45212 | 6.8% | 6.0%(+0.809)#367 | 6.4%(+0.433)#13,850 |
| 18. | 45203 | 6.4% | 6.0%(+0.467)#407 | 6.4%(+0.091)#14,754 |
| 19. | 45247 | 6.3% | 6.0%(+0.336)#415 | 6.4%(-0.041)#15,083 |
| 20. | 45237 | 6.2% | 6.0%(+0.252)#424 | 6.4%(-0.124)#15,314 |
| 21. | 45239 | 5.7% | 6.0%(-0.270)#484 | 6.4%(-0.646)#16,742 |
| 22. | 45230 | 5.5% | 6.0%(-0.475)#504 | 6.4%(-0.852)#17,308 |
| 23. | 45215 | 5.5% | 6.0%(-0.484)#505 | 6.4%(-0.861)#17,331 |
| 24. | 45244 | 5.5% | 6.0%(-0.488)#507 | 6.4%(-0.864)#17,339 |
| 25. | 45236 | 5.2% | 6.0%(-0.747)#539 | 6.4%(-1.12)#18,111 |
| 26. | 45213 | 5.2% | 6.0%(-0.809)#552 | 6.4%(-1.19)#18,301 |
| 27. | 45238 | 5.0% | 6.0%(-0.945)#562 | 6.4%(-1.32)#18,698 |
| 28. | 45241 | 5.0% | 6.0%(-0.977)#565 | 6.4%(-1.35)#18,782 |
| 29. | 45207 | 4.8% | 6.0%(-1.13)#588 | 6.4%(-1.51)#19,273 |
| 30. | 45255 | 4.7% | 6.0%(-1.27)#597 | 6.4%(-1.65)#19,690 |
| 31. | 45211 | 4.6% | 6.0%(-1.39)#616 | 6.4%(-1.76)#20,019 |
| 32. | 45224 | 4.4% | 6.0%(-1.54)#637 | 6.4%(-1.92)#20,444 |
| 33. | 45231 | 4.4% | 6.0%(-1.56)#643 | 6.4%(-1.94)#20,502 |
| 34. | 45216 | 4.4% | 6.0%(-1.61)#653 | 6.4%(-1.99)#20,661 |
| 35. | 45205 | 4.3% | 6.0%(-1.70)#667 | 6.4%(-2.08)#20,914 |
| 36. | 45246 | 4.0% | 6.0%(-1.93)#687 | 6.4%(-2.31)#21,544 |
| 37. | 45251 | 4.0% | 6.0%(-1.96)#691 | 6.4%(-2.33)#21,613 |
| 38. | 45233 | 3.8% | 6.0%(-2.14)#709 | 6.4%(-2.51)#22,057 |
| 39. | 45248 | 3.6% | 6.0%(-2.33)#723 | 6.4%(-2.71)#22,502 |
| 40. | 45252 | 3.5% | 6.0%(-2.44)#735 | 6.4%(-2.82)#22,749 |
| 41. | 45214 | 2.9% | 6.0%(-3.11)#802 | 6.4%(-3.49)#24,126 |
| 42. | 45218 | 2.6% | 6.0%(-3.40)#825 | 6.4%(-3.78)#24,591 |
| 43. | 45217 | 2.1% | 6.0%(-3.91)#854 | 6.4%(-4.29)#25,276 |
| 44. | 45204 | 0.82% | 6.0%(-5.16)#917 | 6.4%(-5.54)#26,317 |
1
Common Questions
What are the Top 10 Zip Codes with the Highest Percentage of Population with a Degree in Bio, Nature & Agricultural in Cincinnati, OH?
Top 10 Zip Codes with the Highest Percentage of Population with a Degree in Bio, Nature & Agricultural in Cincinnati, OH are:
What zip code has the Highest Percentage of Population with a Degree in Bio, Nature & Agricultural in Cincinnati, OH?
45232 has the Highest Percentage of Population with a Degree in Bio, Nature & Agricultural in Cincinnati, OH with 17.5%.
What is the Percentage of Population with a Degree in Bio, Nature & Agricultural in Cincinnati, OH?
Percentage of Population with a Degree in Bio, Nature & Agricultural in Cincinnati is 7.8%.
What is the Percentage of Population with a Degree in Bio, Nature & Agricultural in Ohio?
Percentage of Population with a Degree in Bio, Nature & Agricultural in Ohio is 6.0%.
What is the Percentage of Population with a Degree in Bio, Nature & Agricultural in the United States?
Percentage of Population with a Degree in Bio, Nature & Agricultural in the United States is 6.4%.