Zip Codes with the Highest Percentage of Population with a Degree in Visual and Performing Arts in Cincinnati, OH
RELATED REPORTS & OPTIONS
Visual and Performing Arts
Cincinnati
Compare Zip Codes
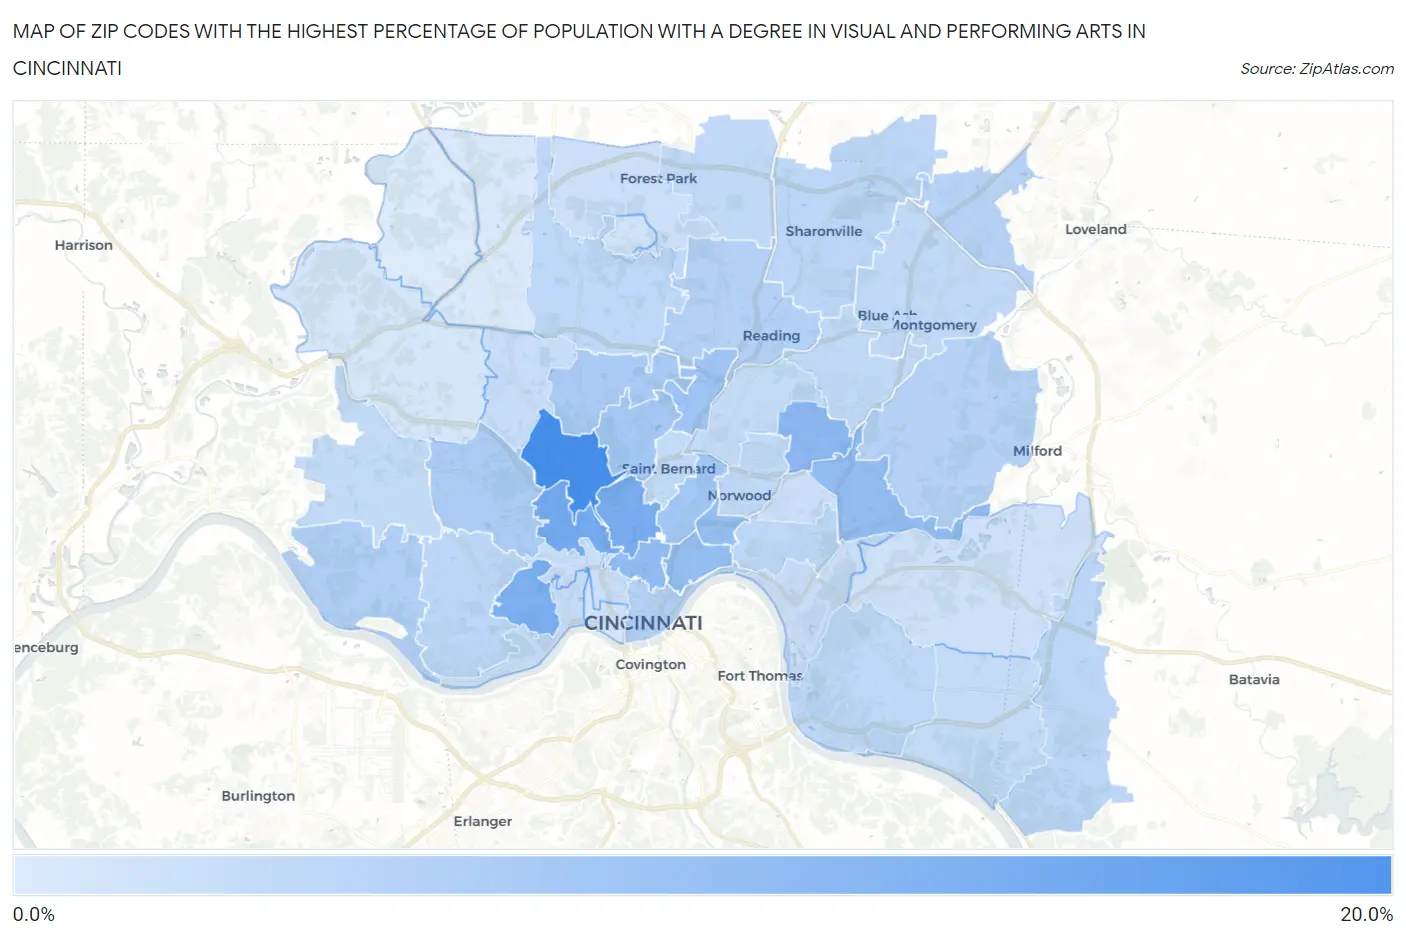
Map of Zip Codes with the Highest Percentage of Population with a Degree in Visual and Performing Arts in Cincinnati
1.4%
17.1%
Zip Codes with the Highest Percentage of Population with a Degree in Visual and Performing Arts in Cincinnati, OH
| Zip Code | % Graduates | vs State | vs National | |
| 1. | 45223 | 17.1% | 3.7%(+13.4)#29 | 4.3%(+12.8)#632 |
| 2. | 45225 | 12.1% | 3.7%(+8.38)#51 | 4.3%(+7.84)#1,269 |
| 3. | 45220 | 11.5% | 3.7%(+7.81)#55 | 4.3%(+7.27)#1,395 |
| 4. | 45205 | 11.3% | 3.7%(+7.54)#57 | 4.3%(+7.00)#1,453 |
| 5. | 45213 | 9.7% | 3.7%(+5.96)#69 | 4.3%(+5.42)#1,955 |
| 6. | 45219 | 9.2% | 3.7%(+5.46)#82 | 4.3%(+4.92)#2,182 |
| 7. | 45227 | 8.8% | 3.7%(+5.09)#95 | 4.3%(+4.55)#2,356 |
| 8. | 45206 | 8.5% | 3.7%(+4.83)#100 | 4.3%(+4.29)#2,503 |
| 9. | 45207 | 8.5% | 3.7%(+4.82)#101 | 4.3%(+4.28)#2,504 |
| 10. | 45216 | 7.4% | 3.7%(+3.68)#120 | 4.3%(+3.14)#3,299 |
| 11. | 45229 | 7.2% | 3.7%(+3.48)#126 | 4.3%(+2.94)#3,472 |
| 12. | 45232 | 7.0% | 3.7%(+3.33)#132 | 4.3%(+2.79)#3,626 |
| 13. | 45224 | 6.6% | 3.7%(+2.87)#151 | 4.3%(+2.33)#4,145 |
| 14. | 45211 | 6.4% | 3.7%(+2.65)#158 | 4.3%(+2.11)#4,393 |
| 15. | 45233 | 5.7% | 3.7%(+1.96)#191 | 4.3%(+1.41)#5,388 |
| 16. | 45202 | 5.6% | 3.7%(+1.89)#195 | 4.3%(+1.35)#5,498 |
| 17. | 45215 | 5.6% | 3.7%(+1.86)#197 | 4.3%(+1.32)#5,546 |
| 18. | 45243 | 5.4% | 3.7%(+1.69)#208 | 4.3%(+1.15)#5,866 |
| 19. | 45249 | 5.1% | 3.7%(+1.38)#227 | 4.3%(+0.841)#6,429 |
| 20. | 45238 | 4.7% | 3.7%(+0.950)#264 | 4.3%(+0.409)#7,385 |
| 21. | 45245 | 4.7% | 3.7%(+0.948)#265 | 4.3%(+0.407)#7,389 |
| 22. | 45241 | 4.6% | 3.7%(+0.898)#269 | 4.3%(+0.357)#7,532 |
| 23. | 45208 | 4.5% | 3.7%(+0.741)#287 | 4.3%(+0.199)#7,937 |
| 24. | 45231 | 4.5% | 3.7%(+0.740)#288 | 4.3%(+0.199)#7,939 |
| 25. | 45230 | 4.4% | 3.7%(+0.708)#292 | 4.3%(+0.167)#8,042 |
| 26. | 45236 | 4.2% | 3.7%(+0.445)#309 | 4.3%(-0.096)#8,758 |
| 27. | 45212 | 4.1% | 3.7%(+0.411)#311 | 4.3%(-0.131)#8,864 |
| 28. | 45242 | 4.1% | 3.7%(+0.404)#313 | 4.3%(-0.137)#8,888 |
| 29. | 45246 | 4.1% | 3.7%(+0.392)#315 | 4.3%(-0.150)#8,932 |
| 30. | 45217 | 3.9% | 3.7%(+0.163)#343 | 4.3%(-0.379)#9,653 |
| 31. | 45248 | 3.8% | 3.7%(+0.099)#349 | 4.3%(-0.442)#9,830 |
| 32. | 45237 | 3.8% | 3.7%(+0.064)#354 | 4.3%(-0.477)#9,923 |
| 33. | 45255 | 3.6% | 3.7%(-0.089)#371 | 4.3%(-0.630)#10,425 |
| 34. | 45204 | 3.6% | 3.7%(-0.094)#372 | 4.3%(-0.635)#10,437 |
| 35. | 45239 | 3.5% | 3.7%(-0.224)#391 | 4.3%(-0.766)#10,936 |
| 36. | 45226 | 3.3% | 3.7%(-0.420)#418 | 4.3%(-0.961)#11,645 |
| 37. | 45209 | 3.3% | 3.7%(-0.461)#422 | 4.3%(-1.00)#11,810 |
| 38. | 45214 | 3.2% | 3.7%(-0.543)#432 | 4.3%(-1.08)#12,094 |
| 39. | 45240 | 3.0% | 3.7%(-0.704)#449 | 4.3%(-1.25)#12,709 |
| 40. | 45244 | 2.8% | 3.7%(-0.877)#478 | 4.3%(-1.42)#13,349 |
| 41. | 45218 | 2.6% | 3.7%(-1.14)#517 | 4.3%(-1.68)#14,350 |
| 42. | 45203 | 2.5% | 3.7%(-1.18)#521 | 4.3%(-1.72)#14,511 |
| 43. | 45247 | 2.2% | 3.7%(-1.54)#571 | 4.3%(-2.09)#15,830 |
| 44. | 45251 | 1.6% | 3.7%(-2.09)#654 | 4.3%(-2.63)#17,777 |
| 45. | 45252 | 1.4% | 3.7%(-2.29)#670 | 4.3%(-2.83)#18,381 |
1
Common Questions
What are the Top 10 Zip Codes with the Highest Percentage of Population with a Degree in Visual and Performing Arts in Cincinnati, OH?
Top 10 Zip Codes with the Highest Percentage of Population with a Degree in Visual and Performing Arts in Cincinnati, OH are:
What zip code has the Highest Percentage of Population with a Degree in Visual and Performing Arts in Cincinnati, OH?
45223 has the Highest Percentage of Population with a Degree in Visual and Performing Arts in Cincinnati, OH with 17.1%.
What is the Percentage of Population with a Degree in Visual and Performing Arts in Cincinnati, OH?
Percentage of Population with a Degree in Visual and Performing Arts in Cincinnati is 6.7%.
What is the Percentage of Population with a Degree in Visual and Performing Arts in Ohio?
Percentage of Population with a Degree in Visual and Performing Arts in Ohio is 3.7%.
What is the Percentage of Population with a Degree in Visual and Performing Arts in the United States?
Percentage of Population with a Degree in Visual and Performing Arts in the United States is 4.3%.