Zip Codes with the Highest Percentage of Population Employed in Arts, Media & Entertainment in Cincinnati, OH
RELATED REPORTS & OPTIONS
Arts, Media & Entertainment
Cincinnati
Compare Zip Codes
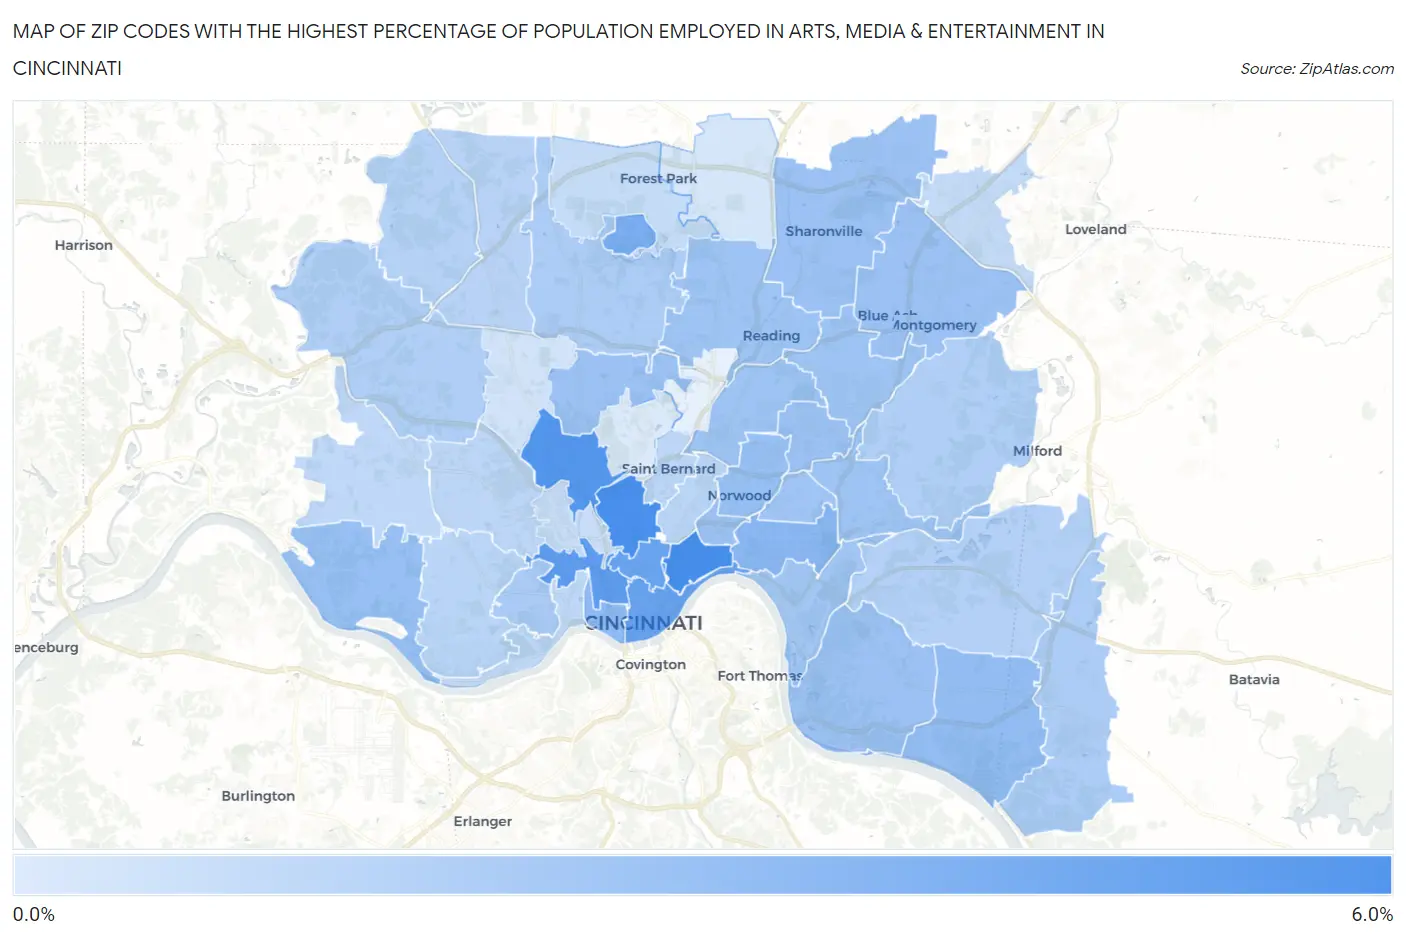
Map of Zip Codes with the Highest Percentage of Population Employed in Arts, Media & Entertainment in Cincinnati
0.28%
5.4%
Zip Codes with the Highest Percentage of Population Employed in Arts, Media & Entertainment in Cincinnati, OH
| Zip Code | % Employed | vs State | vs National | |
| 1. | 45206 | 5.4% | 1.6%(+3.88)#13 | 2.1%(+3.37)#1,293 |
| 2. | 45220 | 5.4% | 1.6%(+3.81)#14 | 2.1%(+3.30)#1,318 |
| 3. | 45223 | 4.9% | 1.6%(+3.39)#23 | 2.1%(+2.88)#1,535 |
| 4. | 45214 | 4.6% | 1.6%(+3.10)#28 | 2.1%(+2.59)#1,736 |
| 5. | 45202 | 4.3% | 1.6%(+2.74)#33 | 2.1%(+2.23)#2,045 |
| 6. | 45219 | 4.2% | 1.6%(+2.67)#34 | 2.1%(+2.16)#2,134 |
| 7. | 45218 | 3.7% | 1.6%(+2.14)#53 | 2.1%(+1.63)#2,780 |
| 8. | 45208 | 3.1% | 1.6%(+1.54)#83 | 2.1%(+1.03)#3,880 |
| 9. | 45203 | 2.9% | 1.6%(+1.36)#95 | 2.1%(+0.853)#4,310 |
| 10. | 45255 | 2.8% | 1.6%(+1.24)#103 | 2.1%(+0.731)#4,645 |
| 11. | 45233 | 2.6% | 1.6%(+1.09)#114 | 2.1%(+0.581)#5,091 |
| 12. | 45212 | 2.6% | 1.6%(+1.04)#123 | 2.1%(+0.527)#5,270 |
| 13. | 45241 | 2.6% | 1.6%(+1.03)#125 | 2.1%(+0.520)#5,294 |
| 14. | 45224 | 2.5% | 1.6%(+0.996)#133 | 2.1%(+0.487)#5,407 |
| 15. | 45213 | 2.5% | 1.6%(+0.994)#134 | 2.1%(+0.485)#5,411 |
| 16. | 45230 | 2.5% | 1.6%(+0.988)#135 | 2.1%(+0.478)#5,423 |
| 17. | 45242 | 2.5% | 1.6%(+0.951)#137 | 2.1%(+0.442)#5,541 |
| 18. | 45207 | 2.5% | 1.6%(+0.939)#138 | 2.1%(+0.430)#5,582 |
| 19. | 45215 | 2.4% | 1.6%(+0.833)#146 | 2.1%(+0.324)#5,990 |
| 20. | 45236 | 2.4% | 1.6%(+0.830)#147 | 2.1%(+0.320)#6,001 |
| 21. | 45237 | 2.4% | 1.6%(+0.821)#149 | 2.1%(+0.312)#6,039 |
| 22. | 45227 | 2.4% | 1.6%(+0.815)#150 | 2.1%(+0.305)#6,068 |
| 23. | 45209 | 2.3% | 1.6%(+0.770)#160 | 2.1%(+0.260)#6,289 |
| 24. | 45226 | 2.2% | 1.6%(+0.695)#170 | 2.1%(+0.186)#6,622 |
| 25. | 45205 | 2.0% | 1.6%(+0.472)#215 | 2.1%(-0.038)#7,688 |
| 26. | 45245 | 1.9% | 1.6%(+0.353)#238 | 2.1%(-0.157)#8,347 |
| 27. | 45231 | 1.9% | 1.6%(+0.347)#240 | 2.1%(-0.162)#8,388 |
| 28. | 45247 | 1.8% | 1.6%(+0.205)#269 | 2.1%(-0.304)#9,231 |
| 29. | 45243 | 1.7% | 1.6%(+0.192)#272 | 2.1%(-0.317)#9,315 |
| 30. | 45244 | 1.7% | 1.6%(+0.114)#297 | 2.1%(-0.396)#9,891 |
| 31. | 45252 | 1.6% | 1.6%(+0.035)#319 | 2.1%(-0.474)#10,417 |
| 32. | 45251 | 1.5% | 1.6%(-0.020)#342 | 2.1%(-0.530)#10,777 |
| 33. | 45238 | 1.5% | 1.6%(-0.075)#354 | 2.1%(-0.584)#11,132 |
| 34. | 45229 | 1.5% | 1.6%(-0.084)#356 | 2.1%(-0.594)#11,209 |
| 35. | 45211 | 1.4% | 1.6%(-0.148)#368 | 2.1%(-0.657)#11,694 |
| 36. | 45217 | 1.3% | 1.6%(-0.205)#386 | 2.1%(-0.714)#12,113 |
| 37. | 45248 | 1.3% | 1.6%(-0.245)#400 | 2.1%(-0.755)#12,406 |
| 38. | 45204 | 1.3% | 1.6%(-0.262)#405 | 2.1%(-0.771)#12,539 |
| 39. | 45249 | 1.1% | 1.6%(-0.401)#458 | 2.1%(-0.911)#13,586 |
| 40. | 45240 | 1.0% | 1.6%(-0.514)#492 | 2.1%(-1.02)#14,514 |
| 41. | 45225 | 1.0% | 1.6%(-0.544)#501 | 2.1%(-1.05)#14,749 |
| 42. | 45239 | 0.64% | 1.6%(-0.913)#621 | 2.1%(-1.42)#17,755 |
| 43. | 45246 | 0.49% | 1.6%(-1.06)#677 | 2.1%(-1.57)#18,909 |
| 44. | 45232 | 0.28% | 1.6%(-1.27)#755 | 2.1%(-1.78)#20,480 |
1
Common Questions
What are the Top 10 Zip Codes with the Highest Percentage of Population Employed in Arts, Media & Entertainment in Cincinnati, OH?
Top 10 Zip Codes with the Highest Percentage of Population Employed in Arts, Media & Entertainment in Cincinnati, OH are:
What zip code has the Highest Percentage of Population Employed in Arts, Media & Entertainment in Cincinnati, OH?
45206 has the Highest Percentage of Population Employed in Arts, Media & Entertainment in Cincinnati, OH with 5.4%.
What is the Percentage of Population Employed in Arts, Media & Entertainment in Cincinnati, OH?
Percentage of Population Employed in Arts, Media & Entertainment in Cincinnati is 2.8%.
What is the Percentage of Population Employed in Arts, Media & Entertainment in Ohio?
Percentage of Population Employed in Arts, Media & Entertainment in Ohio is 1.6%.
What is the Percentage of Population Employed in Arts, Media & Entertainment in the United States?
Percentage of Population Employed in Arts, Media & Entertainment in the United States is 2.1%.