Zip Codes with the Highest Percentage of Population Employed in Computer, Engineering & Science in Cincinnati, OH
RELATED REPORTS & OPTIONS
Computer, Engineering & Science
Cincinnati
Compare Zip Codes
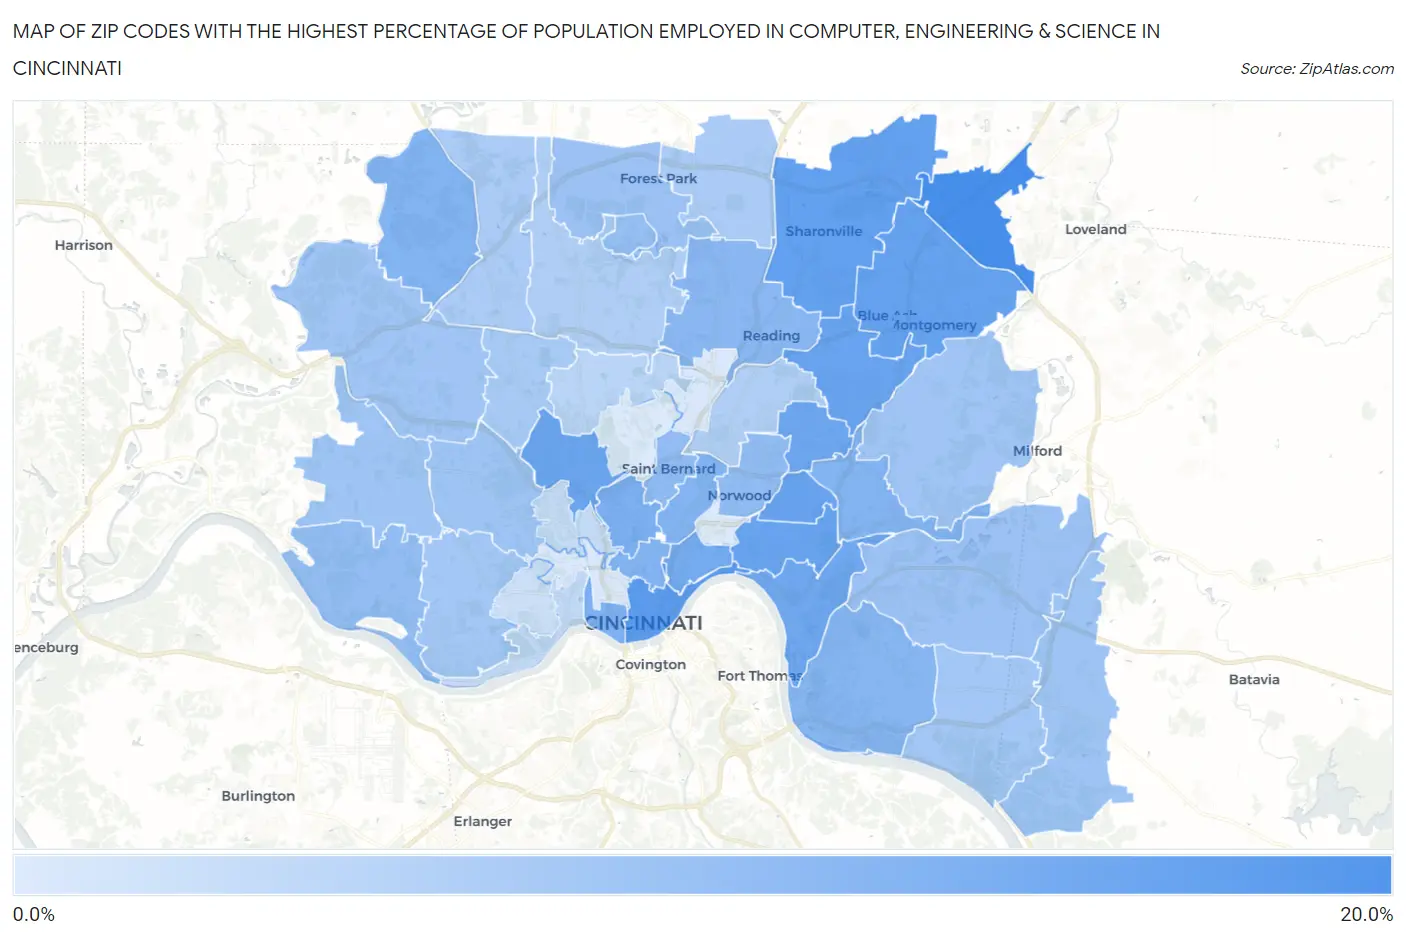
Map of Zip Codes with the Highest Percentage of Population Employed in Computer, Engineering & Science in Cincinnati
1.3%
15.1%
Zip Codes with the Highest Percentage of Population Employed in Computer, Engineering & Science in Cincinnati, OH
| Zip Code | % Employed | vs State | vs National | |
| 1. | 45249 | 15.1% | 6.1%(+9.00)#22 | 6.8%(+8.30)#1,111 |
| 2. | 45202 | 13.3% | 6.1%(+7.21)#34 | 6.8%(+6.51)#1,548 |
| 3. | 45241 | 12.4% | 6.1%(+6.30)#43 | 6.8%(+5.60)#1,875 |
| 4. | 45242 | 12.2% | 6.1%(+6.10)#44 | 6.8%(+5.40)#1,961 |
| 5. | 45209 | 11.8% | 6.1%(+5.78)#52 | 6.8%(+5.08)#2,111 |
| 6. | 45236 | 11.7% | 6.1%(+5.67)#54 | 6.8%(+4.97)#2,161 |
| 7. | 45208 | 11.6% | 6.1%(+5.57)#56 | 6.8%(+4.87)#2,216 |
| 8. | 45223 | 11.4% | 6.1%(+5.34)#59 | 6.8%(+4.64)#2,351 |
| 9. | 45213 | 11.3% | 6.1%(+5.26)#62 | 6.8%(+4.56)#2,394 |
| 10. | 45226 | 11.2% | 6.1%(+5.10)#68 | 6.8%(+4.40)#2,481 |
| 11. | 45206 | 10.6% | 6.1%(+4.52)#76 | 6.8%(+3.82)#2,805 |
| 12. | 45220 | 10.1% | 6.1%(+3.99)#90 | 6.8%(+3.29)#3,176 |
| 13. | 45203 | 9.8% | 6.1%(+3.77)#94 | 6.8%(+3.07)#3,340 |
| 14. | 45252 | 9.4% | 6.1%(+3.33)#106 | 6.8%(+2.63)#3,691 |
| 15. | 45219 | 9.4% | 6.1%(+3.31)#107 | 6.8%(+2.61)#3,698 |
| 16. | 45227 | 9.3% | 6.1%(+3.27)#110 | 6.8%(+2.57)#3,752 |
| 17. | 45229 | 9.3% | 6.1%(+3.21)#111 | 6.8%(+2.51)#3,802 |
| 18. | 45230 | 8.9% | 6.1%(+2.86)#124 | 6.8%(+2.16)#4,140 |
| 19. | 45215 | 8.6% | 6.1%(+2.55)#133 | 6.8%(+1.85)#4,468 |
| 20. | 45212 | 8.2% | 6.1%(+2.11)#154 | 6.8%(+1.41)#5,042 |
| 21. | 45217 | 8.0% | 6.1%(+1.95)#167 | 6.8%(+1.25)#5,245 |
| 22. | 45233 | 7.9% | 6.1%(+1.83)#175 | 6.8%(+1.13)#5,407 |
| 23. | 45218 | 7.6% | 6.1%(+1.58)#187 | 6.8%(+0.883)#5,760 |
| 24. | 45244 | 7.2% | 6.1%(+1.15)#211 | 6.8%(+0.451)#6,433 |
| 25. | 45240 | 7.2% | 6.1%(+1.10)#216 | 6.8%(+0.399)#6,513 |
| 26. | 45245 | 6.8% | 6.1%(+0.735)#235 | 6.8%(+0.035)#7,149 |
| 27. | 45248 | 6.8% | 6.1%(+0.722)#237 | 6.8%(+0.022)#7,172 |
| 28. | 45211 | 6.7% | 6.1%(+0.645)#242 | 6.8%(-0.055)#7,333 |
| 29. | 45247 | 6.6% | 6.1%(+0.492)#264 | 6.8%(-0.207)#7,637 |
| 30. | 45243 | 6.5% | 6.1%(+0.450)#269 | 6.8%(-0.249)#7,705 |
| 31. | 45255 | 6.5% | 6.1%(+0.396)#275 | 6.8%(-0.304)#7,817 |
| 32. | 45238 | 6.4% | 6.1%(+0.316)#278 | 6.8%(-0.384)#7,959 |
| 33. | 45239 | 5.9% | 6.1%(-0.124)#324 | 6.8%(-0.823)#8,971 |
| 34. | 45251 | 5.9% | 6.1%(-0.208)#334 | 6.8%(-0.908)#9,173 |
| 35. | 45246 | 5.8% | 6.1%(-0.254)#339 | 6.8%(-0.954)#9,271 |
| 36. | 45231 | 5.4% | 6.1%(-0.712)#386 | 6.8%(-1.41)#10,443 |
| 37. | 45237 | 5.2% | 6.1%(-0.885)#403 | 6.8%(-1.58)#10,868 |
| 38. | 45224 | 4.4% | 6.1%(-1.71)#506 | 6.8%(-2.41)#13,326 |
| 39. | 45204 | 3.7% | 6.1%(-2.36)#585 | 6.8%(-3.06)#15,440 |
| 40. | 45225 | 3.4% | 6.1%(-2.67)#641 | 6.8%(-3.37)#16,656 |
| 41. | 45205 | 2.7% | 6.1%(-3.41)#757 | 6.8%(-4.11)#19,414 |
| 42. | 45216 | 1.6% | 6.1%(-4.50)#905 | 6.8%(-5.20)#23,391 |
| 43. | 45214 | 1.5% | 6.1%(-4.60)#924 | 6.8%(-5.30)#23,697 |
| 44. | 45207 | 1.4% | 6.1%(-4.68)#931 | 6.8%(-5.38)#23,958 |
| 45. | 45232 | 1.3% | 6.1%(-4.77)#938 | 6.8%(-5.47)#24,207 |
1
Common Questions
What are the Top 10 Zip Codes with the Highest Percentage of Population Employed in Computer, Engineering & Science in Cincinnati, OH?
Top 10 Zip Codes with the Highest Percentage of Population Employed in Computer, Engineering & Science in Cincinnati, OH are:
What zip code has the Highest Percentage of Population Employed in Computer, Engineering & Science in Cincinnati, OH?
45249 has the Highest Percentage of Population Employed in Computer, Engineering & Science in Cincinnati, OH with 15.1%.
What is the Percentage of Population Employed in Computer, Engineering & Science in Cincinnati, OH?
Percentage of Population Employed in Computer, Engineering & Science in Cincinnati is 8.3%.
What is the Percentage of Population Employed in Computer, Engineering & Science in Ohio?
Percentage of Population Employed in Computer, Engineering & Science in Ohio is 6.1%.
What is the Percentage of Population Employed in Computer, Engineering & Science in the United States?
Percentage of Population Employed in Computer, Engineering & Science in the United States is 6.8%.