Zip Codes with the Highest Percentage of Scotch-Irish Population in Cincinnati, OH
RELATED REPORTS & OPTIONS
Scotch-Irish
Cincinnati
Compare Zip Codes
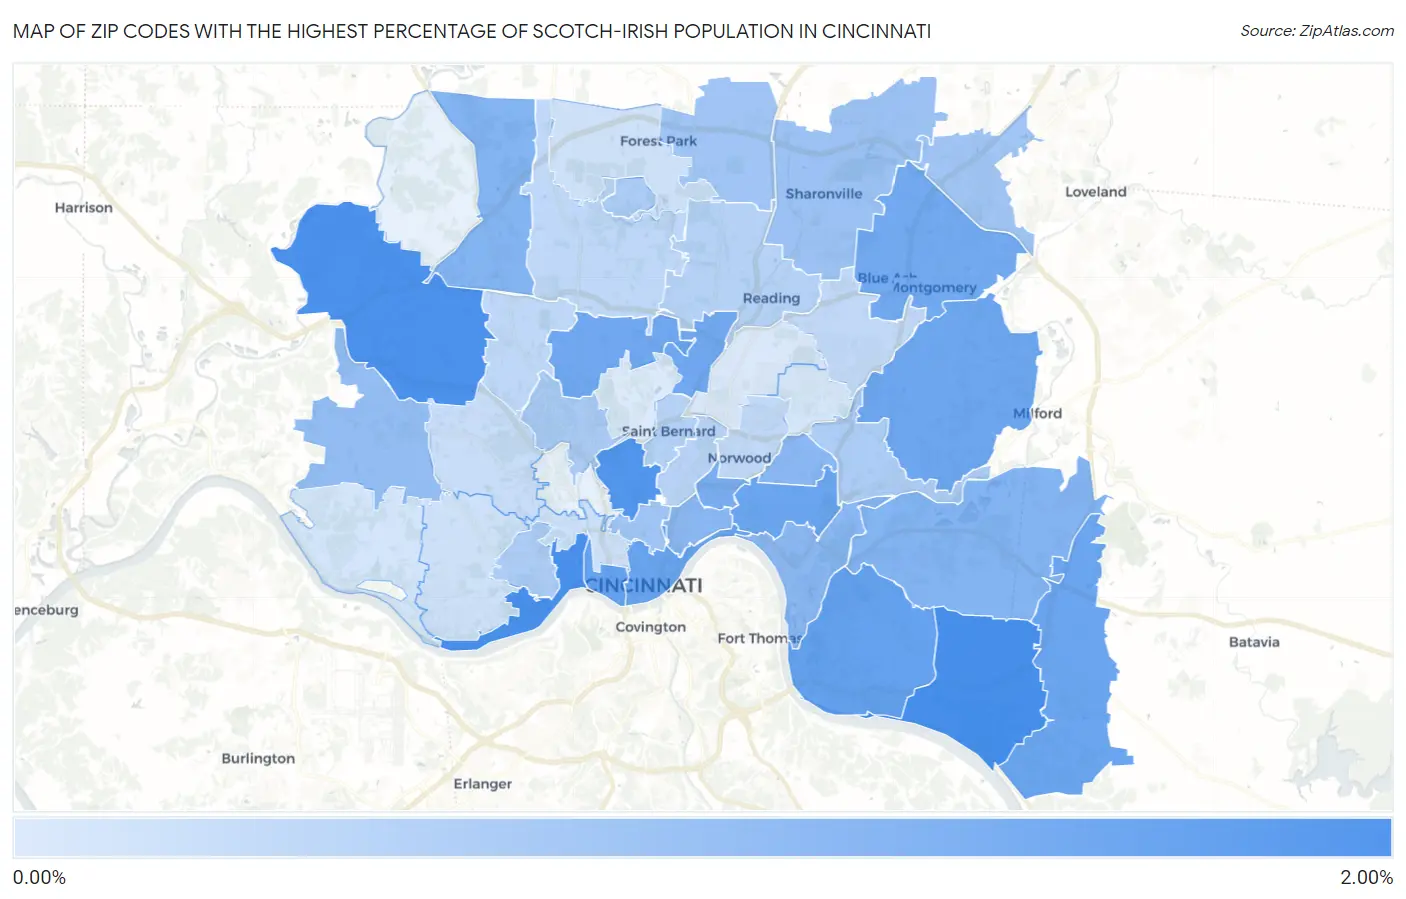
Map of Zip Codes with the Highest Percentage of Scotch-Irish Population in Cincinnati
0.12%
1.51%
Zip Codes with the Highest Percentage of Scotch-Irish Population in Cincinnati, OH
| Zip Code | Scotch-Irish | vs State | vs National | |
| 1. | 45255 | 1.51% | 0.87%(+0.640)#178 | 0.82%(+0.695)#5,853 |
| 2. | 45204 | 1.49% | 0.87%(+0.613)#186 | 0.82%(+0.667)#6,015 |
| 3. | 45247 | 1.47% | 0.87%(+0.602)#188 | 0.82%(+0.657)#6,078 |
| 4. | 45220 | 1.41% | 0.87%(+0.540)#203 | 0.82%(+0.595)#6,441 |
| 5. | 45203 | 1.24% | 0.87%(+0.368)#275 | 0.82%(+0.423)#7,632 |
| 6. | 45230 | 1.23% | 0.87%(+0.359)#279 | 0.82%(+0.414)#7,692 |
| 7. | 45202 | 1.20% | 0.87%(+0.327)#291 | 0.82%(+0.381)#7,914 |
| 8. | 45208 | 1.18% | 0.87%(+0.305)#303 | 0.82%(+0.360)#8,091 |
| 9. | 45245 | 1.16% | 0.87%(+0.287)#308 | 0.82%(+0.342)#8,234 |
| 10. | 45243 | 1.15% | 0.87%(+0.275)#312 | 0.82%(+0.330)#8,347 |
| 11. | 45216 | 1.13% | 0.87%(+0.262)#316 | 0.82%(+0.317)#8,448 |
| 12. | 45224 | 1.12% | 0.87%(+0.246)#320 | 0.82%(+0.301)#8,593 |
| 13. | 45242 | 1.11% | 0.87%(+0.232)#325 | 0.82%(+0.287)#8,701 |
| 14. | 45207 | 1.04% | 0.87%(+0.171)#347 | 0.82%(+0.226)#9,279 |
| 15. | 45244 | 0.96% | 0.87%(+0.086)#386 | 0.82%(+0.140)#10,191 |
| 16. | 45251 | 0.95% | 0.87%(+0.073)#394 | 0.82%(+0.128)#10,317 |
| 17. | 45209 | 0.89% | 0.87%(+0.021)#418 | 0.82%(+0.076)#10,909 |
| 18. | 45206 | 0.89% | 0.87%(+0.016)#421 | 0.82%(+0.071)#10,959 |
| 19. | 45226 | 0.89% | 0.87%(+0.015)#422 | 0.82%(+0.070)#10,968 |
| 20. | 45248 | 0.81% | 0.87%(-0.058)#456 | 0.82%(-0.003)#11,866 |
| 21. | 45241 | 0.73% | 0.87%(-0.139)#495 | 0.82%(-0.085)#12,927 |
| 22. | 45219 | 0.67% | 0.87%(-0.201)#533 | 0.82%(-0.146)#13,808 |
| 23. | 45246 | 0.67% | 0.87%(-0.205)#537 | 0.82%(-0.150)#13,851 |
| 24. | 45249 | 0.67% | 0.87%(-0.205)#538 | 0.82%(-0.150)#13,852 |
| 25. | 45223 | 0.59% | 0.87%(-0.283)#585 | 0.82%(-0.228)#15,005 |
| 26. | 45205 | 0.58% | 0.87%(-0.291)#587 | 0.82%(-0.236)#15,115 |
| 27. | 45218 | 0.57% | 0.87%(-0.299)#594 | 0.82%(-0.245)#15,255 |
| 28. | 45227 | 0.56% | 0.87%(-0.309)#603 | 0.82%(-0.254)#15,395 |
| 29. | 45217 | 0.49% | 0.87%(-0.380)#649 | 0.82%(-0.326)#16,555 |
| 30. | 45215 | 0.49% | 0.87%(-0.386)#655 | 0.82%(-0.331)#16,642 |
| 31. | 45229 | 0.47% | 0.87%(-0.404)#667 | 0.82%(-0.350)#16,933 |
| 32. | 45239 | 0.41% | 0.87%(-0.466)#705 | 0.82%(-0.411)#17,976 |
| 33. | 45231 | 0.41% | 0.87%(-0.467)#706 | 0.82%(-0.413)#18,004 |
| 34. | 45236 | 0.39% | 0.87%(-0.485)#718 | 0.82%(-0.430)#18,285 |
| 35. | 45212 | 0.37% | 0.87%(-0.502)#729 | 0.82%(-0.448)#18,549 |
| 36. | 45211 | 0.31% | 0.87%(-0.567)#778 | 0.82%(-0.512)#19,653 |
| 37. | 45214 | 0.28% | 0.87%(-0.594)#799 | 0.82%(-0.539)#20,087 |
| 38. | 45238 | 0.26% | 0.87%(-0.616)#811 | 0.82%(-0.561)#20,473 |
| 39. | 45240 | 0.25% | 0.87%(-0.626)#815 | 0.82%(-0.571)#20,647 |
| 40. | 45233 | 0.21% | 0.87%(-0.666)#837 | 0.82%(-0.611)#21,339 |
| 41. | 45213 | 0.19% | 0.87%(-0.684)#847 | 0.82%(-0.629)#21,648 |
| 42. | 45237 | 0.15% | 0.87%(-0.723)#866 | 0.82%(-0.668)#22,305 |
| 43. | 45232 | 0.12% | 0.87%(-0.748)#878 | 0.82%(-0.693)#22,679 |
1
Common Questions
What are the Top 10 Zip Codes with the Highest Percentage of Scotch-Irish Population in Cincinnati, OH?
Top 10 Zip Codes with the Highest Percentage of Scotch-Irish Population in Cincinnati, OH are:
What zip code has the Highest Percentage of Scotch-Irish Population in Cincinnati, OH?
45255 has the Highest Percentage of Scotch-Irish Population in Cincinnati, OH with 1.51%.
What is the Percentage of Scotch-Irish Population in Cincinnati, OH?
Percentage of Scotch-Irish Population in Cincinnati is 0.62%.
What is the Percentage of Scotch-Irish Population in Ohio?
Percentage of Scotch-Irish Population in Ohio is 0.87%.
What is the Percentage of Scotch-Irish Population in the United States?
Percentage of Scotch-Irish Population in the United States is 0.82%.