Zip Codes with the Highest Percentage of Population Employed in Education Instruction & Library in Cincinnati, OH
RELATED REPORTS & OPTIONS
Education Instruction & Library
Cincinnati
Compare Zip Codes
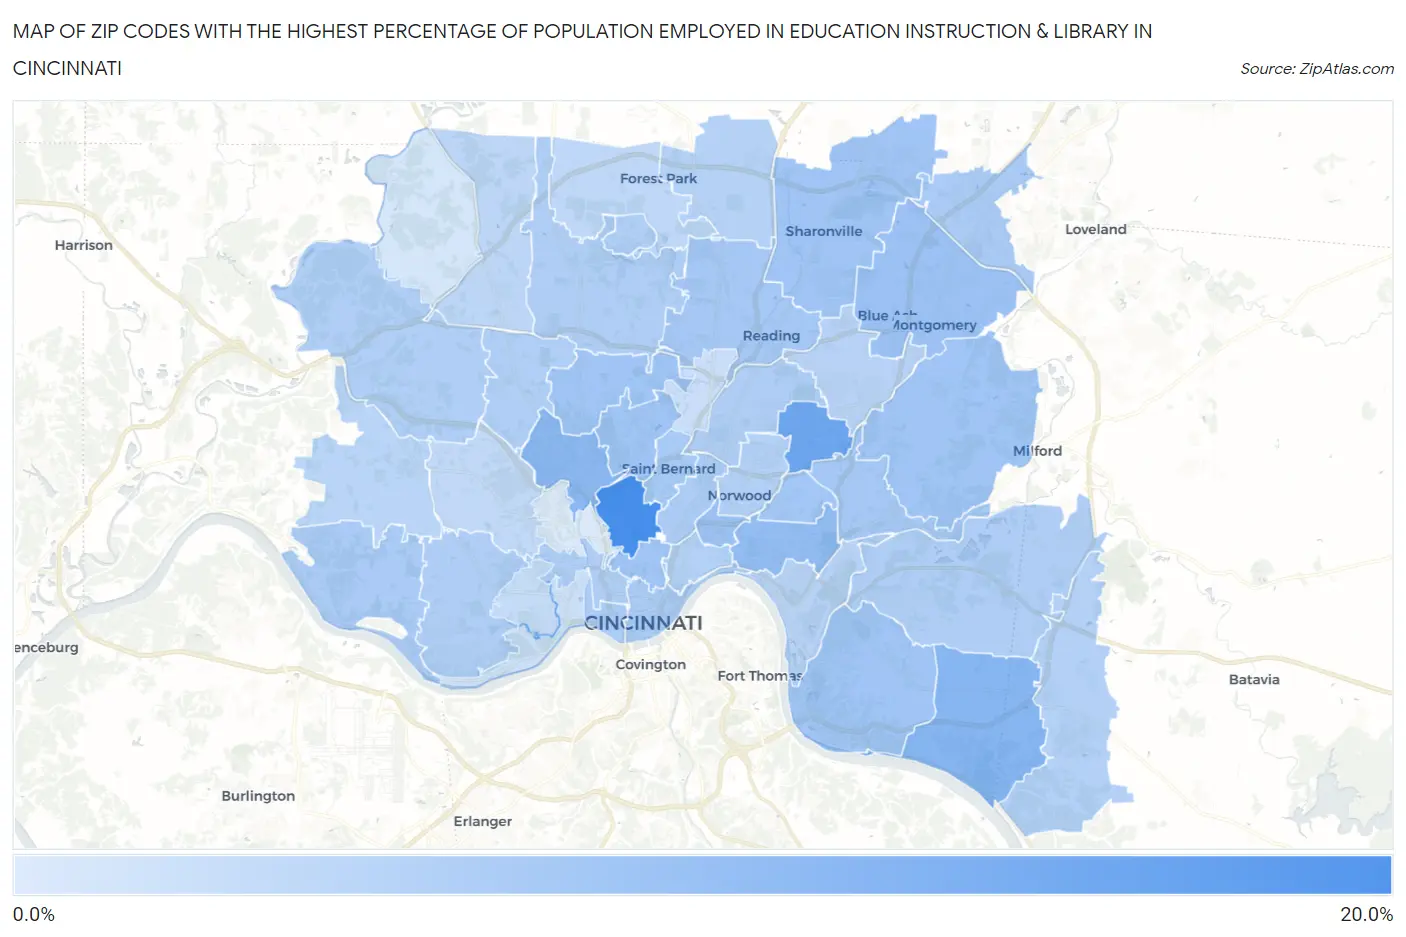
Map of Zip Codes with the Highest Percentage of Population Employed in Education Instruction & Library in Cincinnati
1.0%
16.1%
Zip Codes with the Highest Percentage of Population Employed in Education Instruction & Library in Cincinnati, OH
| Zip Code | % Employed | vs State | vs National | |
| 1. | 45220 | 16.1% | 5.7%(+10.4)#22 | 6.2%(+9.89)#1,089 |
| 2. | 45213 | 11.9% | 5.7%(+6.26)#50 | 6.2%(+5.72)#2,440 |
| 3. | 45255 | 9.4% | 5.7%(+3.73)#109 | 6.2%(+3.20)#4,673 |
| 4. | 45223 | 8.8% | 5.7%(+3.13)#125 | 6.2%(+2.60)#5,565 |
| 5. | 45208 | 8.1% | 5.7%(+2.47)#158 | 6.2%(+1.94)#6,889 |
| 6. | 45207 | 7.2% | 5.7%(+1.58)#223 | 6.2%(+1.05)#9,195 |
| 7. | 45242 | 7.2% | 5.7%(+1.57)#227 | 6.2%(+1.03)#9,250 |
| 8. | 45241 | 6.9% | 5.7%(+1.26)#256 | 6.2%(+0.726)#10,186 |
| 9. | 45224 | 6.8% | 5.7%(+1.20)#263 | 6.2%(+0.665)#10,399 |
| 10. | 45219 | 6.8% | 5.7%(+1.18)#267 | 6.2%(+0.649)#10,464 |
| 11. | 45243 | 6.8% | 5.7%(+1.17)#269 | 6.2%(+0.643)#10,481 |
| 12. | 45230 | 6.7% | 5.7%(+1.07)#282 | 6.2%(+0.539)#10,836 |
| 13. | 45232 | 6.7% | 5.7%(+1.05)#284 | 6.2%(+0.516)#10,901 |
| 14. | 45209 | 6.5% | 5.7%(+0.893)#303 | 6.2%(+0.362)#11,458 |
| 15. | 45215 | 6.4% | 5.7%(+0.732)#322 | 6.2%(+0.201)#12,034 |
| 16. | 45227 | 6.2% | 5.7%(+0.591)#333 | 6.2%(+0.060)#12,608 |
| 17. | 45217 | 6.1% | 5.7%(+0.482)#343 | 6.2%(-0.049)#13,004 |
| 18. | 45202 | 6.0% | 5.7%(+0.345)#354 | 6.2%(-0.187)#13,513 |
| 19. | 45233 | 6.0% | 5.7%(+0.340)#357 | 6.2%(-0.191)#13,524 |
| 20. | 45249 | 5.8% | 5.7%(+0.143)#387 | 6.2%(-0.389)#14,332 |
| 21. | 45229 | 5.7% | 5.7%(+0.010)#408 | 6.2%(-0.521)#14,911 |
| 22. | 45203 | 5.6% | 5.7%(-0.005)#411 | 6.2%(-0.537)#14,968 |
| 23. | 45231 | 5.5% | 5.7%(-0.155)#429 | 6.2%(-0.687)#15,569 |
| 24. | 45237 | 5.5% | 5.7%(-0.179)#432 | 6.2%(-0.711)#15,659 |
| 25. | 45238 | 5.5% | 5.7%(-0.199)#436 | 6.2%(-0.730)#15,741 |
| 26. | 45214 | 5.4% | 5.7%(-0.285)#449 | 6.2%(-0.816)#16,121 |
| 27. | 45244 | 5.3% | 5.7%(-0.307)#451 | 6.2%(-0.839)#16,215 |
| 28. | 45247 | 5.3% | 5.7%(-0.373)#464 | 6.2%(-0.905)#16,463 |
| 29. | 45218 | 5.2% | 5.7%(-0.430)#473 | 6.2%(-0.962)#16,695 |
| 30. | 45239 | 5.2% | 5.7%(-0.488)#486 | 6.2%(-1.02)#16,922 |
| 31. | 45245 | 5.1% | 5.7%(-0.600)#507 | 6.2%(-1.13)#17,422 |
| 32. | 45206 | 4.9% | 5.7%(-0.732)#531 | 6.2%(-1.26)#17,966 |
| 33. | 45212 | 4.9% | 5.7%(-0.758)#540 | 6.2%(-1.29)#18,082 |
| 34. | 45246 | 4.8% | 5.7%(-0.858)#560 | 6.2%(-1.39)#18,518 |
| 35. | 45226 | 4.6% | 5.7%(-1.04)#592 | 6.2%(-1.57)#19,279 |
| 36. | 45236 | 4.6% | 5.7%(-1.07)#600 | 6.2%(-1.60)#19,407 |
| 37. | 45248 | 4.4% | 5.7%(-1.25)#629 | 6.2%(-1.78)#20,127 |
| 38. | 45251 | 4.1% | 5.7%(-1.55)#681 | 6.2%(-2.08)#21,284 |
| 39. | 45240 | 4.0% | 5.7%(-1.69)#705 | 6.2%(-2.22)#21,786 |
| 40. | 45211 | 3.6% | 5.7%(-2.02)#756 | 6.2%(-2.56)#22,946 |
| 41. | 45205 | 3.3% | 5.7%(-2.32)#806 | 6.2%(-2.85)#23,906 |
| 42. | 45216 | 2.8% | 5.7%(-2.81)#861 | 6.2%(-3.34)#25,192 |
| 43. | 45204 | 2.5% | 5.7%(-3.17)#915 | 6.2%(-3.70)#26,057 |
| 44. | 45252 | 1.6% | 5.7%(-4.07)#996 | 6.2%(-4.60)#27,555 |
| 45. | 45225 | 1.0% | 5.7%(-4.61)#1,035 | 6.2%(-5.14)#28,178 |
1
Common Questions
What are the Top 10 Zip Codes with the Highest Percentage of Population Employed in Education Instruction & Library in Cincinnati, OH?
Top 10 Zip Codes with the Highest Percentage of Population Employed in Education Instruction & Library in Cincinnati, OH are:
What zip code has the Highest Percentage of Population Employed in Education Instruction & Library in Cincinnati, OH?
45220 has the Highest Percentage of Population Employed in Education Instruction & Library in Cincinnati, OH with 16.1%.
What is the Percentage of Population Employed in Education Instruction & Library in Cincinnati, OH?
Percentage of Population Employed in Education Instruction & Library in Cincinnati is 6.4%.
What is the Percentage of Population Employed in Education Instruction & Library in Ohio?
Percentage of Population Employed in Education Instruction & Library in Ohio is 5.7%.
What is the Percentage of Population Employed in Education Instruction & Library in the United States?
Percentage of Population Employed in Education Instruction & Library in the United States is 6.2%.