Zip Codes with the Highest Percentage of Population Employed in Community & Social Service in Cincinnati, OH
RELATED REPORTS & OPTIONS
Community & Social Service
Cincinnati
Compare Zip Codes
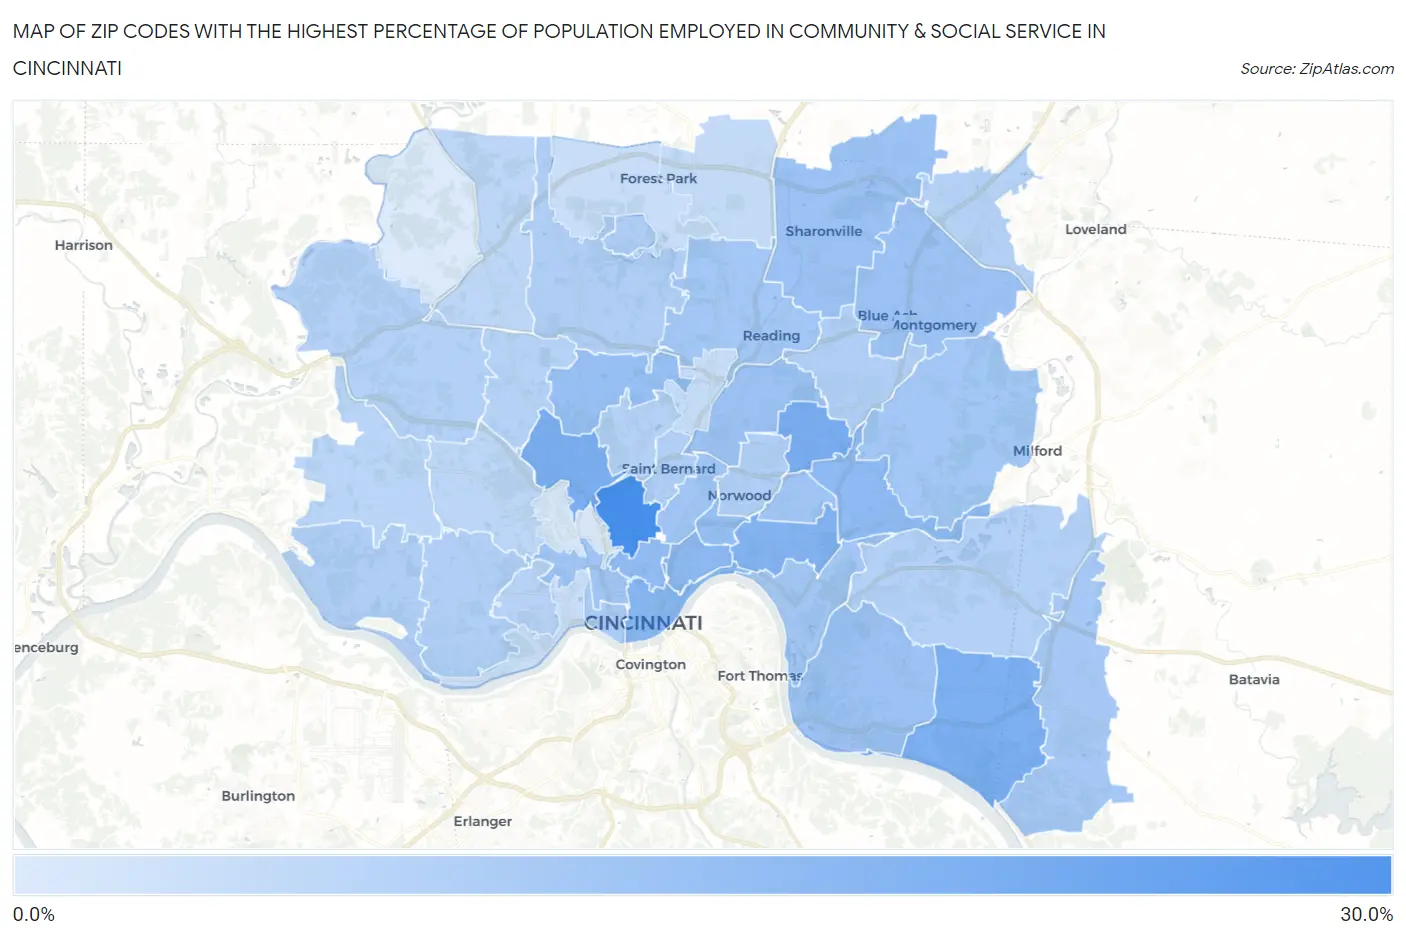
Map of Zip Codes with the Highest Percentage of Population Employed in Community & Social Service in Cincinnati
4.0%
25.0%
Zip Codes with the Highest Percentage of Population Employed in Community & Social Service in Cincinnati, OH
| Zip Code | % Employed | vs State | vs National | |
| 1. | 45220 | 25.0% | 10.0%(+15.0)#16 | 11.2%(+13.8)#970 |
| 2. | 45213 | 17.6% | 10.0%(+7.65)#59 | 11.2%(+6.39)#3,019 |
| 3. | 45223 | 17.2% | 10.0%(+7.27)#66 | 11.2%(+6.02)#3,231 |
| 4. | 45255 | 17.1% | 10.0%(+7.15)#68 | 11.2%(+5.89)#3,314 |
| 5. | 45208 | 16.2% | 10.0%(+6.24)#82 | 11.2%(+4.98)#3,923 |
| 6. | 45202 | 15.5% | 10.0%(+5.59)#97 | 11.2%(+4.33)#4,454 |
| 7. | 45206 | 15.0% | 10.0%(+5.03)#105 | 11.2%(+3.77)#4,978 |
| 8. | 45227 | 14.7% | 10.0%(+4.71)#115 | 11.2%(+3.45)#5,304 |
| 9. | 45219 | 14.2% | 10.0%(+4.25)#125 | 11.2%(+3.00)#5,818 |
| 10. | 45207 | 13.7% | 10.0%(+3.71)#142 | 11.2%(+2.45)#6,521 |
| 11. | 45224 | 13.1% | 10.0%(+3.12)#170 | 11.2%(+1.86)#7,441 |
| 12. | 45230 | 12.9% | 10.0%(+2.94)#173 | 11.2%(+1.68)#7,737 |
| 13. | 45241 | 12.8% | 10.0%(+2.86)#178 | 11.2%(+1.60)#7,861 |
| 14. | 45237 | 12.7% | 10.0%(+2.70)#186 | 11.2%(+1.44)#8,159 |
| 15. | 45242 | 12.5% | 10.0%(+2.59)#195 | 11.2%(+1.33)#8,345 |
| 16. | 45214 | 12.0% | 10.0%(+2.04)#229 | 11.2%(+0.780)#9,388 |
| 17. | 45229 | 11.9% | 10.0%(+1.90)#233 | 11.2%(+0.637)#9,661 |
| 18. | 45209 | 11.8% | 10.0%(+1.88)#234 | 11.2%(+0.621)#9,686 |
| 19. | 45215 | 11.8% | 10.0%(+1.81)#240 | 11.2%(+0.550)#9,850 |
| 20. | 45243 | 11.7% | 10.0%(+1.74)#246 | 11.2%(+0.478)#10,018 |
| 21. | 45226 | 11.6% | 10.0%(+1.62)#256 | 11.2%(+0.359)#10,295 |
| 22. | 45245 | 11.2% | 10.0%(+1.25)#272 | 11.2%(-0.004)#11,108 |
| 23. | 45203 | 10.6% | 10.0%(+0.609)#329 | 11.2%(-0.650)#12,718 |
| 24. | 45231 | 10.0% | 10.0%(+0.050)#367 | 11.2%(-1.21)#14,102 |
| 25. | 45233 | 10.0% | 10.0%(+0.019)#370 | 11.2%(-1.24)#14,193 |
| 26. | 45218 | 10.0% | 10.0%(+0.013)#371 | 11.2%(-1.25)#14,209 |
| 27. | 45217 | 9.9% | 10.0%(-0.081)#381 | 11.2%(-1.34)#14,471 |
| 28. | 45212 | 9.8% | 10.0%(-0.159)#386 | 11.2%(-1.42)#14,650 |
| 29. | 45236 | 9.7% | 10.0%(-0.256)#392 | 11.2%(-1.51)#14,864 |
| 30. | 45238 | 9.6% | 10.0%(-0.318)#397 | 11.2%(-1.58)#15,032 |
| 31. | 45244 | 9.6% | 10.0%(-0.383)#408 | 11.2%(-1.64)#15,214 |
| 32. | 45247 | 9.3% | 10.0%(-0.635)#425 | 11.2%(-1.89)#15,919 |
| 33. | 45232 | 9.3% | 10.0%(-0.661)#433 | 11.2%(-1.92)#15,997 |
| 34. | 45239 | 9.1% | 10.0%(-0.833)#454 | 11.2%(-2.09)#16,479 |
| 35. | 45249 | 9.1% | 10.0%(-0.846)#455 | 11.2%(-2.10)#16,510 |
| 36. | 45205 | 8.9% | 10.0%(-1.08)#477 | 11.2%(-2.34)#17,152 |
| 37. | 45248 | 8.5% | 10.0%(-1.48)#517 | 11.2%(-2.74)#18,254 |
| 38. | 45251 | 8.3% | 10.0%(-1.62)#534 | 11.2%(-2.88)#18,632 |
| 39. | 45211 | 8.2% | 10.0%(-1.76)#546 | 11.2%(-3.01)#19,017 |
| 40. | 45246 | 7.3% | 10.0%(-2.67)#666 | 11.2%(-3.92)#21,433 |
| 41. | 45216 | 6.9% | 10.0%(-3.01)#703 | 11.2%(-4.27)#22,280 |
| 42. | 45240 | 6.8% | 10.0%(-3.14)#720 | 11.2%(-4.40)#22,575 |
| 43. | 45204 | 6.7% | 10.0%(-3.28)#737 | 11.2%(-4.53)#22,856 |
| 44. | 45225 | 4.7% | 10.0%(-5.25)#938 | 11.2%(-6.51)#26,650 |
| 45. | 45252 | 4.0% | 10.0%(-5.93)#980 | 11.2%(-7.19)#27,523 |
1
Common Questions
What are the Top 10 Zip Codes with the Highest Percentage of Population Employed in Community & Social Service in Cincinnati, OH?
Top 10 Zip Codes with the Highest Percentage of Population Employed in Community & Social Service in Cincinnati, OH are:
What zip code has the Highest Percentage of Population Employed in Community & Social Service in Cincinnati, OH?
45220 has the Highest Percentage of Population Employed in Community & Social Service in Cincinnati, OH with 25.0%.
What is the Percentage of Population Employed in Community & Social Service in Cincinnati, OH?
Percentage of Population Employed in Community & Social Service in Cincinnati is 13.0%.
What is the Percentage of Population Employed in Community & Social Service in Ohio?
Percentage of Population Employed in Community & Social Service in Ohio is 10.0%.
What is the Percentage of Population Employed in Community & Social Service in the United States?
Percentage of Population Employed in Community & Social Service in the United States is 11.2%.