Zip Codes with the Highest Percentage of Hawaiian / Pacific Population in Cincinnati, OH
RELATED REPORTS & OPTIONS
Hawaiian / Pacific
Cincinnati
Compare Zip Codes
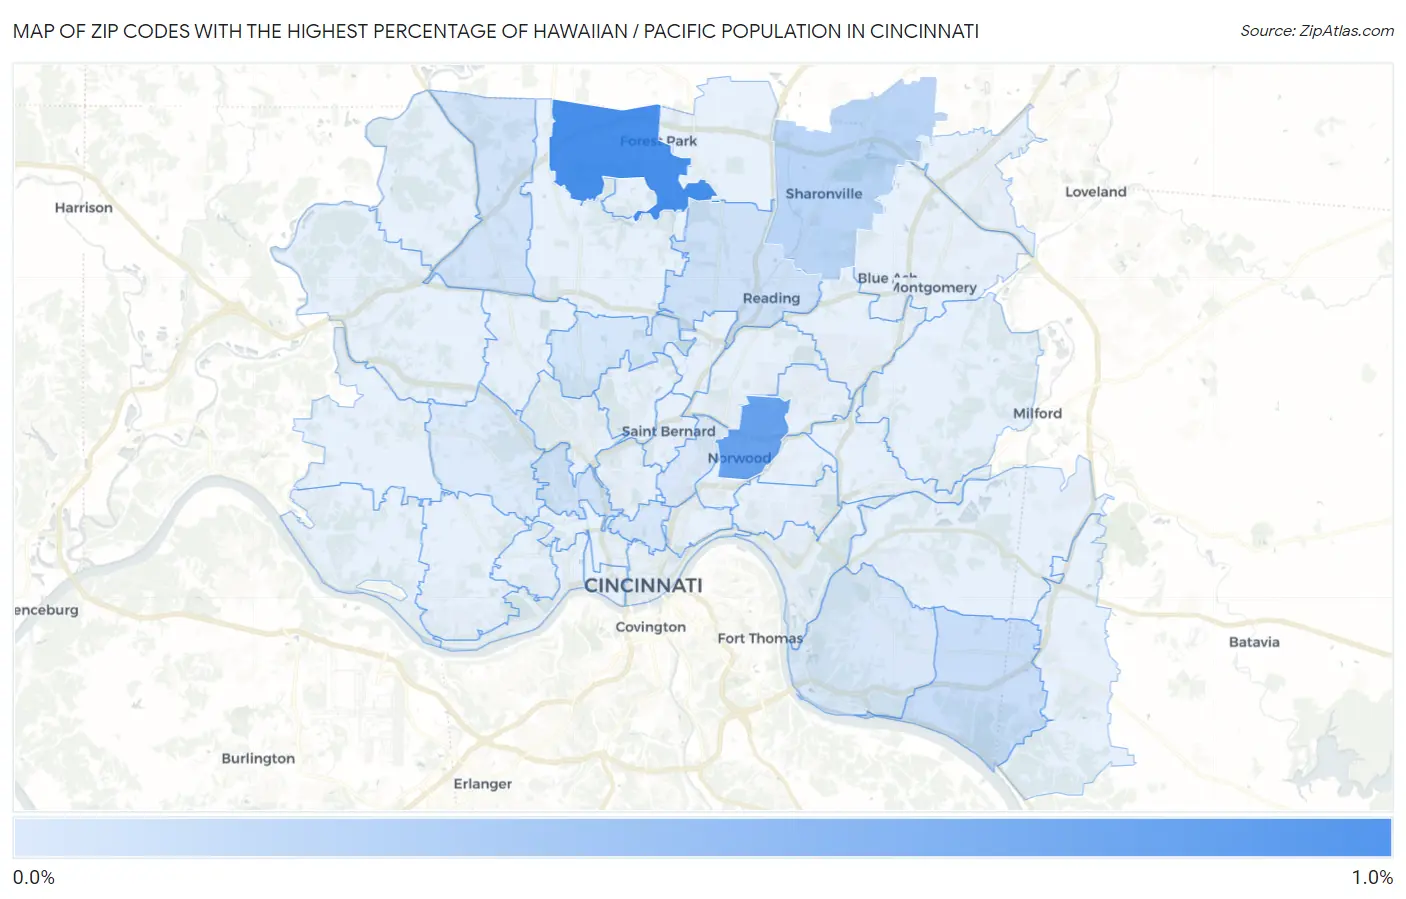
Map of Zip Codes with the Highest Percentage of Hawaiian / Pacific Population in Cincinnati
0.040%
0.80%
Zip Codes with the Highest Percentage of Hawaiian / Pacific Population in Cincinnati, OH
| Zip Code | Hawaiian / Pacific | vs State | vs National | |
| 1. | 45240 | 0.80% | 0.034%(+0.767)#11 | 0.19%(+0.612)#924 |
| 2. | 45212 | 0.63% | 0.034%(+0.598)#14 | 0.19%(+0.444)#1,171 |
| 3. | 45241 | 0.21% | 0.034%(+0.176)#36 | 0.19%(+0.022)#2,717 |
| 4. | 45255 | 0.14% | 0.034%(+0.107)#58 | 0.19%(-0.048)#3,457 |
| 5. | 45215 | 0.11% | 0.034%(+0.072)#70 | 0.19%(-0.082)#3,918 |
| 6. | 45251 | 0.096% | 0.034%(+0.062)#78 | 0.19%(-0.093)#4,119 |
| 7. | 45225 | 0.096% | 0.034%(+0.061)#79 | 0.19%(-0.093)#4,128 |
| 8. | 45224 | 0.076% | 0.034%(+0.042)#85 | 0.19%(-0.112)#4,487 |
| 9. | 45219 | 0.067% | 0.034%(+0.032)#90 | 0.19%(-0.122)#4,709 |
| 10. | 45230 | 0.058% | 0.034%(+0.024)#98 | 0.19%(-0.130)#4,888 |
| 11. | 45229 | 0.052% | 0.034%(+0.018)#104 | 0.19%(-0.137)#5,038 |
| 12. | 45211 | 0.040% | 0.034%(+0.006)#112 | 0.19%(-0.149)#5,341 |
1
Common Questions
What are the Top 10 Zip Codes with the Highest Percentage of Hawaiian / Pacific Population in Cincinnati, OH?
Top 10 Zip Codes with the Highest Percentage of Hawaiian / Pacific Population in Cincinnati, OH are:
What zip code has the Highest Percentage of Hawaiian / Pacific Population in Cincinnati, OH?
45240 has the Highest Percentage of Hawaiian / Pacific Population in Cincinnati, OH with 0.80%.
What is the Percentage of Hawaiian / Pacific Population in Cincinnati, OH?
Percentage of Hawaiian / Pacific Population in Cincinnati is 0.020%.
What is the Percentage of Hawaiian / Pacific Population in Ohio?
Percentage of Hawaiian / Pacific Population in Ohio is 0.034%.
What is the Percentage of Hawaiian / Pacific Population in the United States?
Percentage of Hawaiian / Pacific Population in the United States is 0.19%.