Zip Codes with the Highest Percentage of Population Employed in Firefighting & Prevention in Cincinnati, OH
RELATED REPORTS & OPTIONS
Firefighting & Prevention
Cincinnati
Compare Zip Codes
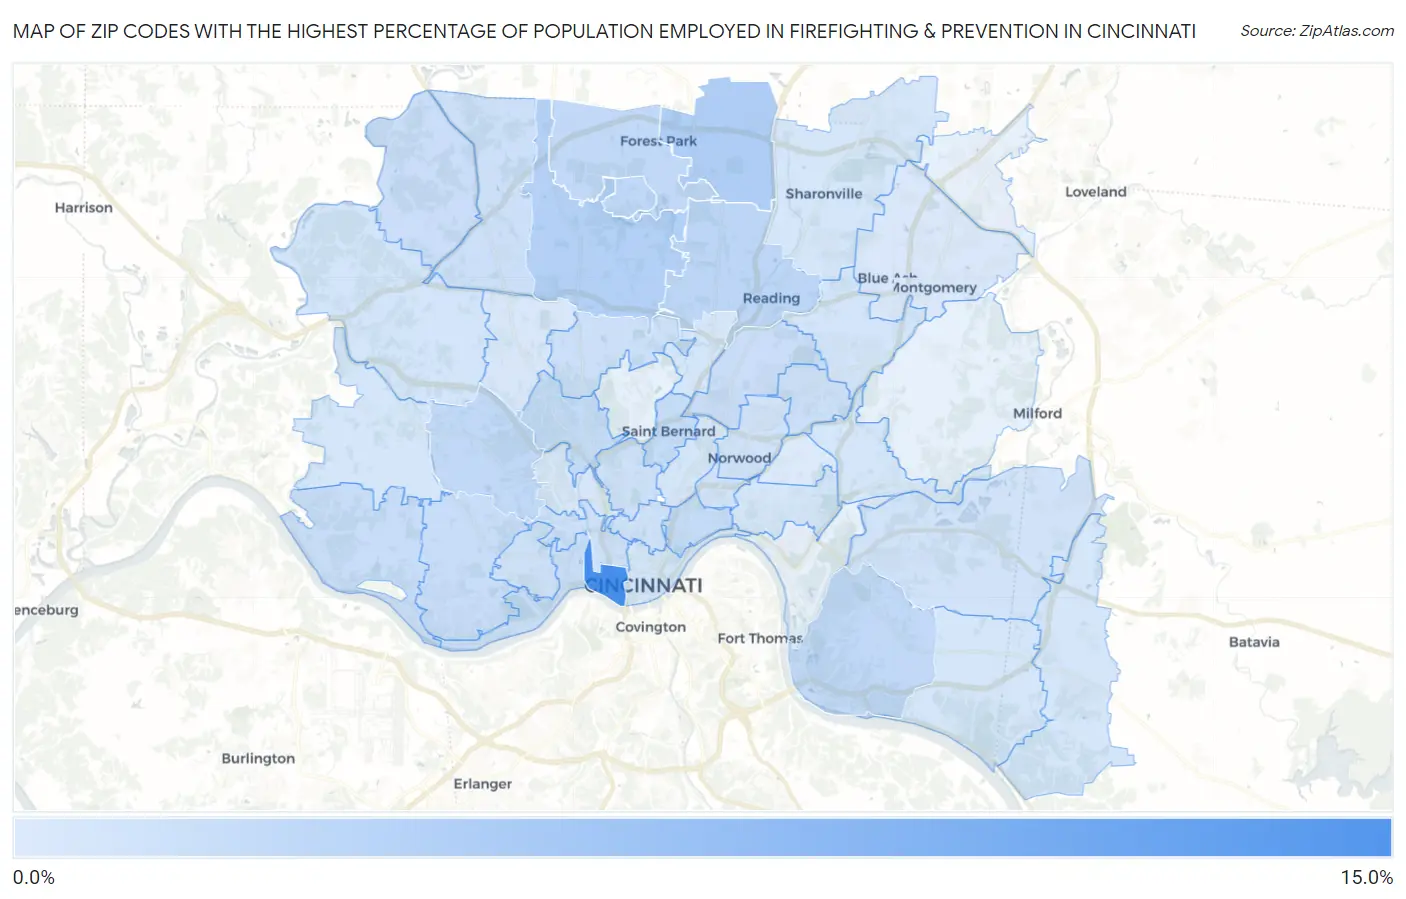
Map of Zip Codes with the Highest Percentage of Population Employed in Firefighting & Prevention in Cincinnati
0.16%
10.6%
Zip Codes with the Highest Percentage of Population Employed in Firefighting & Prevention in Cincinnati, OH
| Zip Code | % Employed | vs State | vs National | |
| 1. | 45203 | 10.6% | 1.1%(+9.50)#5 | 1.2%(+9.38)#276 |
| 2. | 45246 | 3.2% | 1.1%(+2.16)#51 | 1.2%(+2.04)#1,998 |
| 3. | 45231 | 2.9% | 1.1%(+1.88)#58 | 1.2%(+1.76)#2,322 |
| 4. | 45215 | 2.2% | 1.1%(+1.17)#106 | 1.2%(+1.05)#3,743 |
| 5. | 45218 | 2.2% | 1.1%(+1.15)#109 | 1.2%(+1.03)#3,817 |
| 6. | 45230 | 2.1% | 1.1%(+1.00)#121 | 1.2%(+0.882)#4,267 |
| 7. | 45240 | 2.0% | 1.1%(+0.924)#132 | 1.2%(+0.805)#4,536 |
| 8. | 45211 | 2.0% | 1.1%(+0.915)#135 | 1.2%(+0.795)#4,582 |
| 9. | 45217 | 1.7% | 1.1%(+0.640)#177 | 1.2%(+0.520)#5,814 |
| 10. | 45223 | 1.7% | 1.1%(+0.623)#178 | 1.2%(+0.503)#5,895 |
| 11. | 45206 | 1.7% | 1.1%(+0.622)#179 | 1.2%(+0.502)#5,905 |
| 12. | 45238 | 1.6% | 1.1%(+0.519)#202 | 1.2%(+0.399)#6,463 |
| 13. | 45233 | 1.5% | 1.1%(+0.455)#214 | 1.2%(+0.335)#6,845 |
| 14. | 45204 | 1.5% | 1.1%(+0.422)#223 | 1.2%(+0.302)#7,054 |
| 15. | 45237 | 1.4% | 1.1%(+0.378)#239 | 1.2%(+0.258)#7,355 |
| 16. | 45252 | 1.4% | 1.1%(+0.358)#241 | 1.2%(+0.238)#7,475 |
| 17. | 45224 | 1.3% | 1.1%(+0.228)#272 | 1.2%(+0.108)#8,385 |
| 18. | 45251 | 1.3% | 1.1%(+0.225)#274 | 1.2%(+0.105)#8,412 |
| 19. | 45213 | 1.2% | 1.1%(+0.157)#294 | 1.2%(+0.037)#8,966 |
| 20. | 45214 | 1.2% | 1.1%(+0.133)#302 | 1.2%(+0.014)#9,145 |
| 21. | 45220 | 1.1% | 1.1%(+0.083)#323 | 1.2%(-0.037)#9,629 |
| 22. | 45205 | 1.1% | 1.1%(-0.006)#364 | 1.2%(-0.126)#10,482 |
| 23. | 45219 | 1.0% | 1.1%(-0.056)#387 | 1.2%(-0.176)#10,999 |
| 24. | 45244 | 0.95% | 1.1%(-0.114)#423 | 1.2%(-0.233)#11,615 |
| 25. | 45207 | 0.88% | 1.1%(-0.191)#459 | 1.2%(-0.311)#12,418 |
| 26. | 45212 | 0.86% | 1.1%(-0.203)#467 | 1.2%(-0.323)#12,547 |
| 27. | 45236 | 0.83% | 1.1%(-0.236)#482 | 1.2%(-0.356)#12,865 |
| 28. | 45247 | 0.72% | 1.1%(-0.348)#533 | 1.2%(-0.468)#14,128 |
| 29. | 45202 | 0.70% | 1.1%(-0.363)#545 | 1.2%(-0.483)#14,297 |
| 30. | 45248 | 0.69% | 1.1%(-0.376)#554 | 1.2%(-0.496)#14,453 |
| 31. | 45245 | 0.66% | 1.1%(-0.405)#570 | 1.2%(-0.525)#14,787 |
| 32. | 45208 | 0.65% | 1.1%(-0.421)#580 | 1.2%(-0.540)#14,945 |
| 33. | 45255 | 0.64% | 1.1%(-0.424)#584 | 1.2%(-0.544)#14,992 |
| 34. | 45229 | 0.64% | 1.1%(-0.426)#585 | 1.2%(-0.546)#15,014 |
| 35. | 45241 | 0.61% | 1.1%(-0.455)#596 | 1.2%(-0.575)#15,304 |
| 36. | 45216 | 0.60% | 1.1%(-0.463)#598 | 1.2%(-0.583)#15,391 |
| 37. | 45227 | 0.56% | 1.1%(-0.502)#612 | 1.2%(-0.622)#15,798 |
| 38. | 45225 | 0.52% | 1.1%(-0.544)#636 | 1.2%(-0.663)#16,293 |
| 39. | 45239 | 0.43% | 1.1%(-0.631)#678 | 1.2%(-0.751)#17,277 |
| 40. | 45242 | 0.35% | 1.1%(-0.712)#713 | 1.2%(-0.832)#18,184 |
| 41. | 45209 | 0.16% | 1.1%(-0.904)#770 | 1.2%(-1.02)#19,956 |
1
Common Questions
What are the Top 10 Zip Codes with the Highest Percentage of Population Employed in Firefighting & Prevention in Cincinnati, OH?
Top 10 Zip Codes with the Highest Percentage of Population Employed in Firefighting & Prevention in Cincinnati, OH are:
What zip code has the Highest Percentage of Population Employed in Firefighting & Prevention in Cincinnati, OH?
45203 has the Highest Percentage of Population Employed in Firefighting & Prevention in Cincinnati, OH with 10.6%.
What is the Percentage of Population Employed in Firefighting & Prevention in Cincinnati, OH?
Percentage of Population Employed in Firefighting & Prevention in Cincinnati is 1.3%.
What is the Percentage of Population Employed in Firefighting & Prevention in Ohio?
Percentage of Population Employed in Firefighting & Prevention in Ohio is 1.1%.
What is the Percentage of Population Employed in Firefighting & Prevention in the United States?
Percentage of Population Employed in Firefighting & Prevention in the United States is 1.2%.