Zip Codes with the Highest Percentage of Households with Income Below $10,000 in Cincinnati, OH
RELATED REPORTS & OPTIONS
Household Income | $0-10k
Cincinnati
Compare Zip Codes
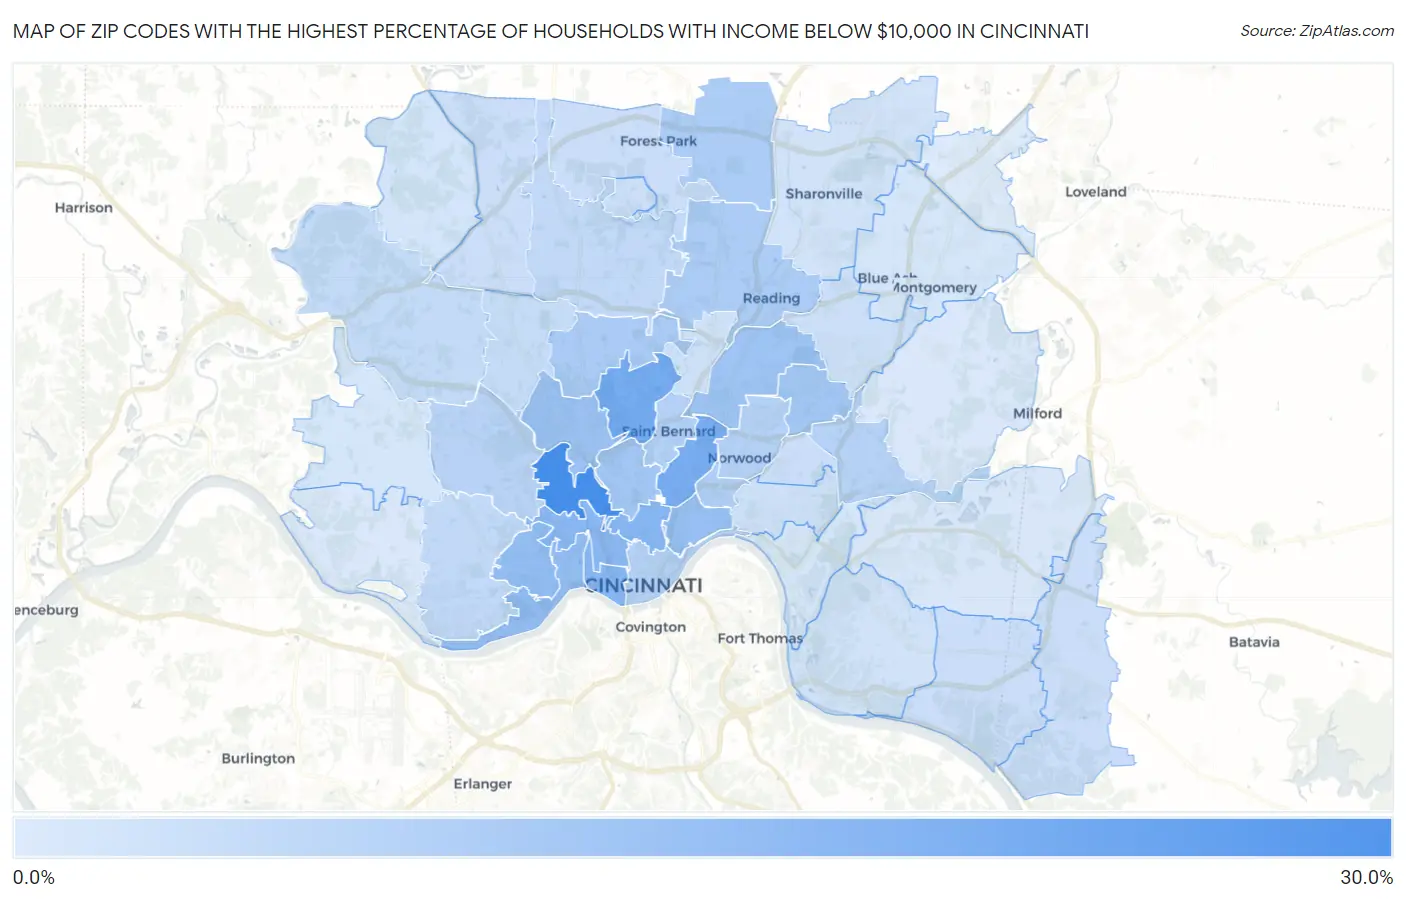
Map of Zip Codes with the Highest Percentage of Households with Income Below $10,000 in Cincinnati
1.6%
26.0%
Zip Codes with the Highest Percentage of Households with Income Below $10,000 in Cincinnati, OH
| Zip Code | Households with Income < $10k | vs State | vs National | |
| 1. | 45225 | 26.0% | 5.2%(+20.8)#10 | 4.9%(+21.1)#440 |
| 2. | 45232 | 18.1% | 5.2%(+12.9)#26 | 4.9%(+13.2)#1,011 |
| 3. | 45229 | 17.5% | 5.2%(+12.3)#30 | 4.9%(+12.6)#1,088 |
| 4. | 45219 | 14.8% | 5.2%(+9.60)#45 | 4.9%(+9.90)#1,562 |
| 5. | 45203 | 14.8% | 5.2%(+9.60)#47 | 4.9%(+9.90)#1,571 |
| 6. | 45214 | 14.5% | 5.2%(+9.30)#49 | 4.9%(+9.60)#1,647 |
| 7. | 45204 | 12.9% | 5.2%(+7.70)#69 | 4.9%(+8.00)#2,120 |
| 8. | 45205 | 12.8% | 5.2%(+7.60)#71 | 4.9%(+7.90)#2,158 |
| 9. | 45206 | 12.3% | 5.2%(+7.10)#79 | 4.9%(+7.40)#2,334 |
| 10. | 45223 | 11.7% | 5.2%(+6.50)#89 | 4.9%(+6.80)#2,587 |
| 11. | 45237 | 11.0% | 5.2%(+5.80)#94 | 4.9%(+6.10)#2,951 |
| 12. | 45220 | 10.2% | 5.2%(+5.00)#115 | 4.9%(+5.30)#3,434 |
| 13. | 45213 | 10.2% | 5.2%(+5.00)#116 | 4.9%(+5.30)#3,436 |
| 14. | 45224 | 9.3% | 5.2%(+4.10)#135 | 4.9%(+4.40)#4,105 |
| 15. | 45215 | 8.9% | 5.2%(+3.70)#148 | 4.9%(+4.00)#4,509 |
| 16. | 45246 | 8.9% | 5.2%(+3.70)#150 | 4.9%(+4.00)#4,524 |
| 17. | 45207 | 8.1% | 5.2%(+2.90)#179 | 4.9%(+3.20)#5,456 |
| 18. | 45202 | 7.8% | 5.2%(+2.60)#195 | 4.9%(+2.90)#5,830 |
| 19. | 45217 | 7.8% | 5.2%(+2.60)#197 | 4.9%(+2.90)#5,847 |
| 20. | 45227 | 7.6% | 5.2%(+2.40)#205 | 4.9%(+2.70)#6,088 |
| 21. | 45212 | 7.5% | 5.2%(+2.30)#210 | 4.9%(+2.60)#6,221 |
| 22. | 45211 | 7.2% | 5.2%(+2.00)#222 | 4.9%(+2.30)#6,626 |
| 23. | 45238 | 5.8% | 5.2%(+0.600)#330 | 4.9%(+0.900)#9,444 |
| 24. | 45231 | 5.8% | 5.2%(+0.600)#332 | 4.9%(+0.900)#9,455 |
| 25. | 45247 | 5.4% | 5.2%(+0.200)#367 | 4.9%(+0.500)#10,482 |
| 26. | 45239 | 5.0% | 5.2%(-0.200)#403 | 4.9%(+0.100)#11,683 |
| 27. | 45255 | 4.3% | 5.2%(-0.900)#490 | 4.9%(-0.600)#14,116 |
| 28. | 45251 | 4.3% | 5.2%(-0.900)#491 | 4.9%(-0.600)#14,120 |
| 29. | 45245 | 4.3% | 5.2%(-0.900)#492 | 4.9%(-0.600)#14,121 |
| 30. | 45209 | 4.3% | 5.2%(-0.900)#495 | 4.9%(-0.600)#14,186 |
| 31. | 45240 | 4.2% | 5.2%(-1.00)#509 | 4.9%(-0.700)#14,498 |
| 32. | 45236 | 4.1% | 5.2%(-1.10)#527 | 4.9%(-0.800)#14,881 |
| 33. | 45218 | 3.9% | 5.2%(-1.30)#564 | 4.9%(-1.00)#15,797 |
| 34. | 45208 | 3.5% | 5.2%(-1.70)#623 | 4.9%(-1.40)#17,304 |
| 35. | 45216 | 3.5% | 5.2%(-1.70)#628 | 4.9%(-1.40)#17,365 |
| 36. | 45241 | 3.4% | 5.2%(-1.80)#638 | 4.9%(-1.50)#17,697 |
| 37. | 45230 | 3.2% | 5.2%(-2.00)#661 | 4.9%(-1.70)#18,519 |
| 38. | 45252 | 2.9% | 5.2%(-2.30)#699 | 4.9%(-2.00)#20,010 |
| 39. | 45242 | 2.6% | 5.2%(-2.60)#728 | 4.9%(-2.30)#21,148 |
| 40. | 45226 | 2.6% | 5.2%(-2.60)#736 | 4.9%(-2.30)#21,276 |
| 41. | 45248 | 2.5% | 5.2%(-2.70)#751 | 4.9%(-2.40)#21,600 |
| 42. | 45244 | 2.3% | 5.2%(-2.90)#784 | 4.9%(-2.60)#22,456 |
| 43. | 45233 | 2.0% | 5.2%(-3.20)#842 | 4.9%(-2.90)#23,673 |
| 44. | 45243 | 1.9% | 5.2%(-3.30)#852 | 4.9%(-3.00)#24,054 |
| 45. | 45249 | 1.6% | 5.2%(-3.60)#901 | 4.9%(-3.30)#25,131 |
1
Common Questions
What are the Top 10 Zip Codes with the Highest Percentage of Households with Income Below $10,000 in Cincinnati, OH?
Top 10 Zip Codes with the Highest Percentage of Households with Income Below $10,000 in Cincinnati, OH are:
What zip code has the Highest Percentage of Households with Income Below $10,000 in Cincinnati, OH?
45225 has the Highest Percentage of Households with Income Below $10,000 in Cincinnati, OH with 26.0%.
What is the Percentage of Households with Income Below $10,000 in Cincinnati, OH?
Percentage of Households with Income Below $10,000 in Cincinnati is 10.7%.
What is the Percentage of Households with Income Below $10,000 in Ohio?
Percentage of Households with Income Below $10,000 in Ohio is 5.2%.
What is the Percentage of Households with Income Below $10,000 in the United States?
Percentage of Households with Income Below $10,000 in the United States is 4.9%.