Zip Codes with the Highest Percentage of Population Employed in Arts, Entertainment & Recreation in Cincinnati, OH
RELATED REPORTS & OPTIONS
Arts, Entertainment & Recreation
Cincinnati
Compare Zip Codes
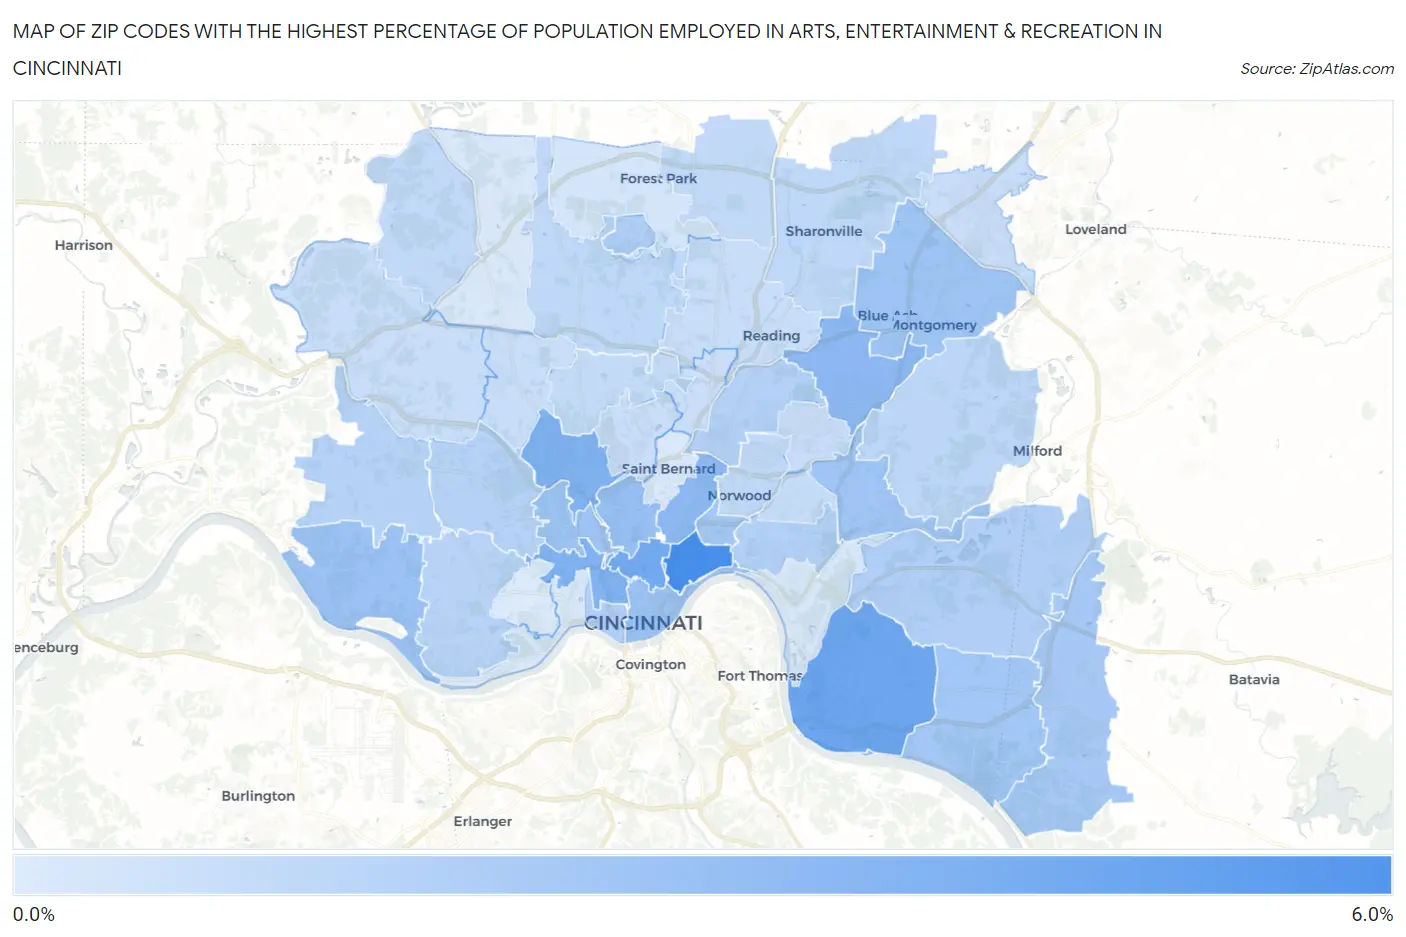
Map of Zip Codes with the Highest Percentage of Population Employed in Arts, Entertainment & Recreation in Cincinnati
0.66%
5.4%
Zip Codes with the Highest Percentage of Population Employed in Arts, Entertainment & Recreation in Cincinnati, OH
| Zip Code | % Employed | vs State | vs National | |
| 1. | 45206 | 5.4% | 1.7%(+3.75)#27 | 2.1%(+3.35)#2,004 |
| 2. | 45230 | 4.1% | 1.7%(+2.46)#54 | 2.1%(+2.05)#3,167 |
| 3. | 45219 | 4.0% | 1.7%(+2.33)#56 | 2.1%(+1.93)#3,319 |
| 4. | 45223 | 3.6% | 1.7%(+1.89)#73 | 2.1%(+1.49)#3,996 |
| 5. | 45214 | 3.6% | 1.7%(+1.89)#74 | 2.1%(+1.49)#4,006 |
| 6. | 45236 | 3.2% | 1.7%(+1.52)#95 | 2.1%(+1.11)#4,813 |
| 7. | 45229 | 3.2% | 1.7%(+1.50)#97 | 2.1%(+1.10)#4,858 |
| 8. | 45220 | 2.9% | 1.7%(+1.18)#115 | 2.1%(+0.773)#5,797 |
| 9. | 45202 | 2.7% | 1.7%(+1.07)#126 | 2.1%(+0.664)#6,204 |
| 10. | 45233 | 2.7% | 1.7%(+1.07)#127 | 2.1%(+0.662)#6,211 |
| 11. | 45242 | 2.6% | 1.7%(+0.969)#144 | 2.1%(+0.565)#6,567 |
| 12. | 45225 | 2.6% | 1.7%(+0.933)#152 | 2.1%(+0.529)#6,707 |
| 13. | 45227 | 2.5% | 1.7%(+0.839)#167 | 2.1%(+0.435)#7,103 |
| 14. | 45255 | 2.5% | 1.7%(+0.797)#171 | 2.1%(+0.393)#7,283 |
| 15. | 45207 | 2.5% | 1.7%(+0.779)#178 | 2.1%(+0.375)#7,374 |
| 16. | 45245 | 2.4% | 1.7%(+0.750)#185 | 2.1%(+0.346)#7,514 |
| 17. | 45218 | 2.1% | 1.7%(+0.431)#235 | 2.1%(+0.027)#9,162 |
| 18. | 45244 | 2.0% | 1.7%(+0.363)#249 | 2.1%(-0.041)#9,539 |
| 19. | 45203 | 2.0% | 1.7%(+0.325)#257 | 2.1%(-0.079)#9,756 |
| 20. | 45237 | 2.0% | 1.7%(+0.290)#264 | 2.1%(-0.114)#9,961 |
| 21. | 45208 | 2.0% | 1.7%(+0.277)#272 | 2.1%(-0.127)#10,038 |
| 22. | 45248 | 1.9% | 1.7%(+0.244)#285 | 2.1%(-0.160)#10,240 |
| 23. | 45211 | 1.9% | 1.7%(+0.222)#289 | 2.1%(-0.182)#10,383 |
| 24. | 45238 | 1.8% | 1.7%(+0.135)#311 | 2.1%(-0.269)#10,923 |
| 25. | 45243 | 1.7% | 1.7%(+0.025)#342 | 2.1%(-0.379)#11,711 |
| 26. | 45231 | 1.6% | 1.7%(-0.061)#370 | 2.1%(-0.465)#12,322 |
| 27. | 45241 | 1.6% | 1.7%(-0.100)#381 | 2.1%(-0.504)#12,618 |
| 28. | 45252 | 1.5% | 1.7%(-0.133)#391 | 2.1%(-0.537)#12,904 |
| 29. | 45212 | 1.5% | 1.7%(-0.144)#397 | 2.1%(-0.548)#13,001 |
| 30. | 45246 | 1.5% | 1.7%(-0.153)#398 | 2.1%(-0.557)#13,063 |
| 31. | 45224 | 1.5% | 1.7%(-0.221)#416 | 2.1%(-0.625)#13,540 |
| 32. | 45209 | 1.4% | 1.7%(-0.275)#438 | 2.1%(-0.679)#13,957 |
| 33. | 45249 | 1.3% | 1.7%(-0.349)#460 | 2.1%(-0.753)#14,512 |
| 34. | 45213 | 1.3% | 1.7%(-0.355)#464 | 2.1%(-0.759)#14,552 |
| 35. | 45215 | 1.3% | 1.7%(-0.366)#471 | 2.1%(-0.770)#14,624 |
| 36. | 45247 | 1.3% | 1.7%(-0.384)#480 | 2.1%(-0.788)#14,752 |
| 37. | 45239 | 1.3% | 1.7%(-0.394)#484 | 2.1%(-0.798)#14,828 |
| 38. | 45232 | 1.3% | 1.7%(-0.416)#491 | 2.1%(-0.820)#15,005 |
| 39. | 45216 | 1.3% | 1.7%(-0.425)#494 | 2.1%(-0.829)#15,075 |
| 40. | 45240 | 0.94% | 1.7%(-0.740)#604 | 2.1%(-1.14)#17,403 |
| 41. | 45226 | 0.82% | 1.7%(-0.857)#636 | 2.1%(-1.26)#18,250 |
| 42. | 45204 | 0.79% | 1.7%(-0.885)#646 | 2.1%(-1.29)#18,448 |
| 43. | 45251 | 0.77% | 1.7%(-0.904)#652 | 2.1%(-1.31)#18,592 |
| 44. | 45217 | 0.75% | 1.7%(-0.930)#665 | 2.1%(-1.33)#18,777 |
| 45. | 45205 | 0.66% | 1.7%(-1.02)#694 | 2.1%(-1.42)#19,418 |
1
Common Questions
What are the Top 10 Zip Codes with the Highest Percentage of Population Employed in Arts, Entertainment & Recreation in Cincinnati, OH?
Top 10 Zip Codes with the Highest Percentage of Population Employed in Arts, Entertainment & Recreation in Cincinnati, OH are:
What zip code has the Highest Percentage of Population Employed in Arts, Entertainment & Recreation in Cincinnati, OH?
45206 has the Highest Percentage of Population Employed in Arts, Entertainment & Recreation in Cincinnati, OH with 5.4%.
What is the Percentage of Population Employed in Arts, Entertainment & Recreation in Cincinnati, OH?
Percentage of Population Employed in Arts, Entertainment & Recreation in Cincinnati is 2.2%.
What is the Percentage of Population Employed in Arts, Entertainment & Recreation in Ohio?
Percentage of Population Employed in Arts, Entertainment & Recreation in Ohio is 1.7%.
What is the Percentage of Population Employed in Arts, Entertainment & Recreation in the United States?
Percentage of Population Employed in Arts, Entertainment & Recreation in the United States is 2.1%.