Zip Codes with the Highest Percentage of Population with a Degree in Science and Engineering in New Hampshire
RELATED REPORTS & OPTIONS
Science and Engineering
New Hampshire
Compare Zip Codes
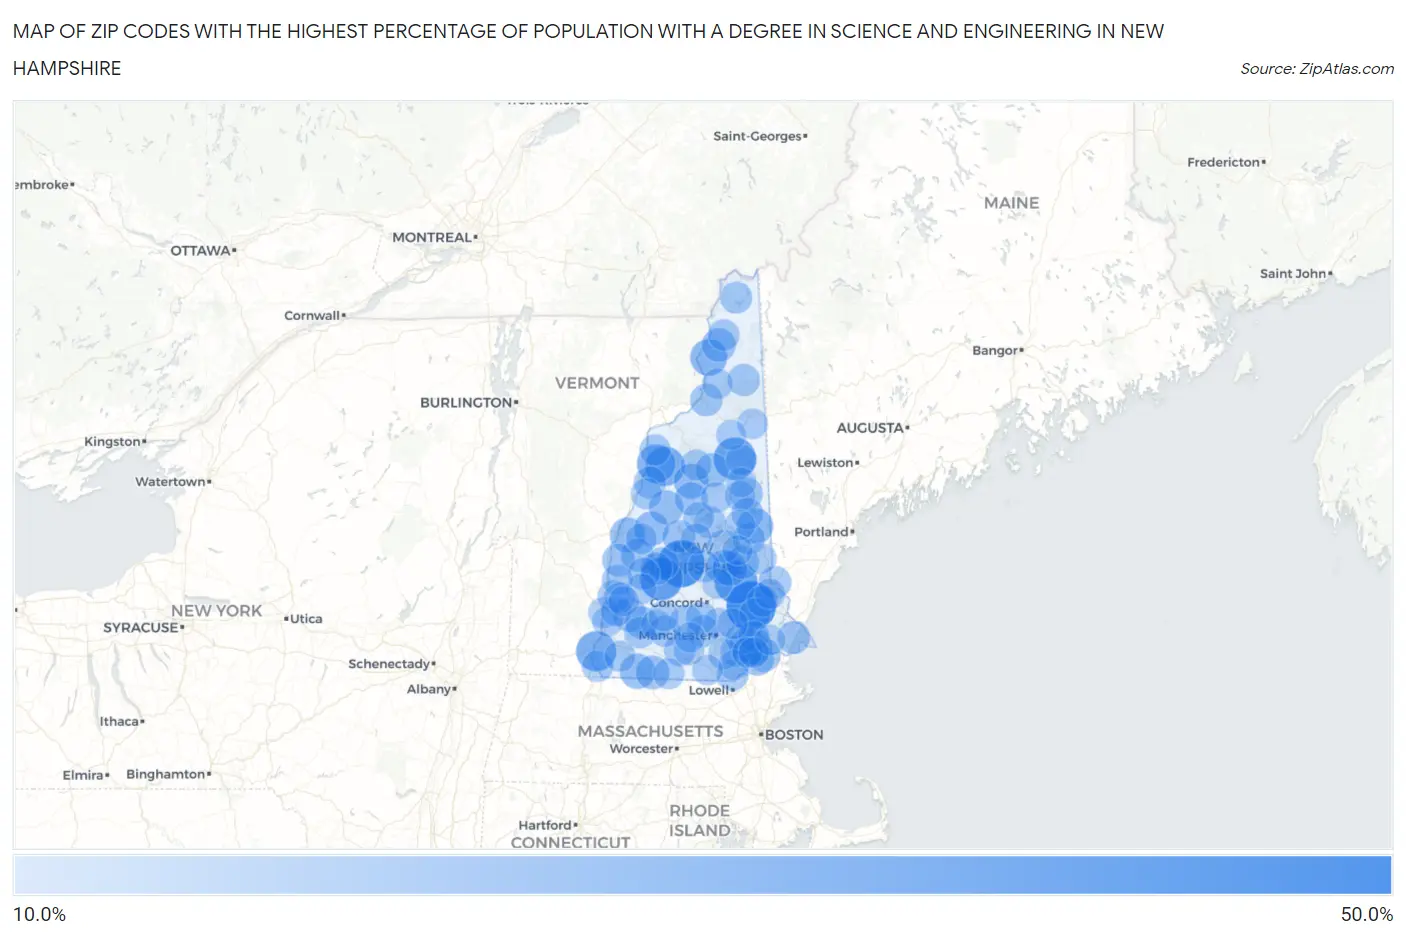
Map of Zip Codes with the Highest Percentage of Population with a Degree in Science and Engineering in New Hampshire
10.0%
50.0%
Zip Codes with the Highest Percentage of Population with a Degree in Science and Engineering in New Hampshire
| Zip Code | % Graduates | vs State | vs National | |
| 1. | 03291 | 50.0% | 9.5%(+40.5)#1 | 9.8%(+40.2)#409 |
| 2. | 03231 | 44.4% | 9.5%(+35.0)#2 | 9.8%(+34.7)#541 |
| 3. | 03260 | 36.3% | 9.5%(+26.8)#3 | 9.8%(+26.5)#857 |
| 4. | 03218 | 36.1% | 9.5%(+26.6)#4 | 9.8%(+26.3)#870 |
| 5. | 03812 | 35.3% | 9.5%(+25.8)#5 | 9.8%(+25.5)#920 |
| 6. | 03466 | 30.6% | 9.5%(+21.1)#6 | 9.8%(+20.8)#1,261 |
| 7. | 03785 | 29.0% | 9.5%(+19.5)#7 | 9.8%(+19.2)#1,410 |
| 8. | 03774 | 27.4% | 9.5%(+17.9)#8 | 9.8%(+17.6)#1,614 |
| 9. | 03590 | 23.8% | 9.5%(+14.3)#9 | 9.8%(+14.0)#2,192 |
| 10. | 03819 | 22.7% | 9.5%(+13.2)#10 | 9.8%(+12.9)#2,465 |
| 11. | 03864 | 22.5% | 9.5%(+13.0)#11 | 9.8%(+12.7)#2,505 |
| 12. | 03873 | 20.5% | 9.5%(+11.0)#12 | 9.8%(+10.7)#3,160 |
| 13. | 03447 | 20.3% | 9.5%(+10.8)#13 | 9.8%(+10.5)#3,209 |
| 14. | 03293 | 20.0% | 9.5%(+10.5)#14 | 9.8%(+10.2)#3,391 |
| 15. | 03766 | 19.8% | 9.5%(+10.4)#15 | 9.8%(+10.1)#3,436 |
| 16. | 03237 | 19.3% | 9.5%(+9.81)#16 | 9.8%(+9.52)#3,650 |
| 17. | 03741 | 19.1% | 9.5%(+9.56)#17 | 9.8%(+9.27)#3,766 |
| 18. | 03837 | 19.0% | 9.5%(+9.50)#18 | 9.8%(+9.21)#3,804 |
| 19. | 03266 | 18.8% | 9.5%(+9.32)#19 | 9.8%(+9.03)#3,879 |
| 20. | 03456 | 17.7% | 9.5%(+8.23)#20 | 9.8%(+7.94)#4,467 |
| 21. | 03597 | 17.6% | 9.5%(+8.16)#21 | 9.8%(+7.87)#4,513 |
| 22. | 03461 | 17.5% | 9.5%(+8.05)#22 | 9.8%(+7.76)#4,592 |
| 23. | 03858 | 17.2% | 9.5%(+7.74)#23 | 9.8%(+7.45)#4,771 |
| 24. | 03865 | 17.2% | 9.5%(+7.68)#24 | 9.8%(+7.39)#4,801 |
| 25. | 03215 | 17.1% | 9.5%(+7.63)#25 | 9.8%(+7.34)#4,853 |
| 26. | 03875 | 16.2% | 9.5%(+6.76)#26 | 9.8%(+6.47)#5,542 |
| 27. | 03223 | 16.2% | 9.5%(+6.72)#27 | 9.8%(+6.43)#5,576 |
| 28. | 03753 | 16.1% | 9.5%(+6.63)#28 | 9.8%(+6.34)#5,641 |
| 29. | 03809 | 16.0% | 9.5%(+6.52)#29 | 9.8%(+6.23)#5,724 |
| 30. | 03745 | 16.0% | 9.5%(+6.46)#30 | 9.8%(+6.17)#5,767 |
| 31. | 03868 | 15.6% | 9.5%(+6.11)#31 | 9.8%(+5.82)#6,088 |
| 32. | 03281 | 15.6% | 9.5%(+6.08)#32 | 9.8%(+5.79)#6,110 |
| 33. | 03871 | 15.5% | 9.5%(+5.98)#33 | 9.8%(+5.69)#6,207 |
| 34. | 03287 | 15.4% | 9.5%(+5.96)#34 | 9.8%(+5.67)#6,230 |
| 35. | 03222 | 15.3% | 9.5%(+5.85)#35 | 9.8%(+5.56)#6,355 |
| 36. | 03249 | 15.2% | 9.5%(+5.68)#36 | 9.8%(+5.39)#6,540 |
| 37. | 03257 | 15.1% | 9.5%(+5.62)#37 | 9.8%(+5.33)#6,593 |
| 38. | 03464 | 15.0% | 9.5%(+5.56)#38 | 9.8%(+5.27)#6,662 |
| 39. | 03584 | 15.0% | 9.5%(+5.51)#39 | 9.8%(+5.22)#6,704 |
| 40. | 03588 | 14.8% | 9.5%(+5.28)#40 | 9.8%(+4.99)#6,931 |
| 41. | 03779 | 14.6% | 9.5%(+5.11)#41 | 9.8%(+4.82)#7,124 |
| 42. | 03782 | 14.4% | 9.5%(+4.89)#42 | 9.8%(+4.60)#7,367 |
| 43. | 03276 | 14.3% | 9.5%(+4.84)#43 | 9.8%(+4.55)#7,417 |
| 44. | 03082 | 14.3% | 9.5%(+4.82)#44 | 9.8%(+4.53)#7,432 |
| 45. | 03894 | 14.2% | 9.5%(+4.72)#45 | 9.8%(+4.43)#7,600 |
| 46. | 03603 | 14.1% | 9.5%(+4.63)#46 | 9.8%(+4.34)#7,707 |
| 47. | 03045 | 14.0% | 9.5%(+4.47)#47 | 9.8%(+4.18)#7,899 |
| 48. | 03226 | 13.8% | 9.5%(+4.30)#48 | 9.8%(+4.01)#8,133 |
| 49. | 03592 | 13.8% | 9.5%(+4.28)#49 | 9.8%(+3.99)#8,168 |
| 50. | 03814 | 13.7% | 9.5%(+4.19)#50 | 9.8%(+3.90)#8,273 |
| 51. | 03076 | 13.3% | 9.5%(+3.84)#51 | 9.8%(+3.55)#8,750 |
| 52. | 03106 | 13.1% | 9.5%(+3.61)#52 | 9.8%(+3.32)#9,092 |
| 53. | 03046 | 13.1% | 9.5%(+3.57)#53 | 9.8%(+3.28)#9,137 |
| 54. | 03576 | 13.1% | 9.5%(+3.56)#54 | 9.8%(+3.27)#9,156 |
| 55. | 03442 | 13.0% | 9.5%(+3.54)#55 | 9.8%(+3.25)#9,209 |
| 56. | 03457 | 13.0% | 9.5%(+3.49)#56 | 9.8%(+3.20)#9,273 |
| 57. | 03038 | 12.9% | 9.5%(+3.43)#57 | 9.8%(+3.14)#9,355 |
| 58. | 03451 | 12.8% | 9.5%(+3.31)#58 | 9.8%(+3.02)#9,543 |
| 59. | 03036 | 12.7% | 9.5%(+3.25)#59 | 9.8%(+2.96)#9,650 |
| 60. | 03740 | 12.6% | 9.5%(+3.15)#60 | 9.8%(+2.86)#9,791 |
| 61. | 03290 | 12.6% | 9.5%(+3.13)#61 | 9.8%(+2.84)#9,815 |
| 62. | 03743 | 12.6% | 9.5%(+3.06)#62 | 9.8%(+2.77)#9,932 |
| 63. | 03825 | 12.5% | 9.5%(+3.00)#63 | 9.8%(+2.71)#10,077 |
| 64. | 03071 | 12.4% | 9.5%(+2.90)#64 | 9.8%(+2.61)#10,209 |
| 65. | 03777 | 12.3% | 9.5%(+2.82)#65 | 9.8%(+2.53)#10,349 |
| 66. | 03245 | 12.3% | 9.5%(+2.76)#66 | 9.8%(+2.47)#10,446 |
| 67. | 03251 | 12.1% | 9.5%(+2.64)#67 | 9.8%(+2.35)#10,675 |
| 68. | 03446 | 12.1% | 9.5%(+2.60)#68 | 9.8%(+2.31)#10,745 |
| 69. | 03053 | 12.0% | 9.5%(+2.50)#69 | 9.8%(+2.21)#10,913 |
| 70. | 03609 | 11.9% | 9.5%(+2.45)#70 | 9.8%(+2.16)#10,998 |
| 71. | 03256 | 11.9% | 9.5%(+2.38)#71 | 9.8%(+2.09)#11,144 |
| 72. | 03748 | 11.8% | 9.5%(+2.26)#72 | 9.8%(+1.97)#11,370 |
| 73. | 03044 | 11.7% | 9.5%(+2.26)#73 | 9.8%(+1.97)#11,380 |
| 74. | 03608 | 11.7% | 9.5%(+2.21)#74 | 9.8%(+1.92)#11,467 |
| 75. | 03582 | 11.7% | 9.5%(+2.18)#75 | 9.8%(+1.89)#11,532 |
| 76. | 03034 | 11.6% | 9.5%(+2.09)#76 | 9.8%(+1.80)#11,689 |
| 77. | 03838 | 11.5% | 9.5%(+2.03)#77 | 9.8%(+1.74)#11,799 |
| 78. | 03259 | 11.5% | 9.5%(+2.02)#78 | 9.8%(+1.73)#11,812 |
| 79. | 03752 | 11.4% | 9.5%(+1.89)#79 | 9.8%(+1.60)#12,081 |
| 80. | 03817 | 11.3% | 9.5%(+1.81)#80 | 9.8%(+1.52)#12,235 |
| 81. | 03581 | 11.3% | 9.5%(+1.80)#81 | 9.8%(+1.51)#12,271 |
| 82. | 03057 | 11.3% | 9.5%(+1.79)#82 | 9.8%(+1.50)#12,285 |
| 83. | 03087 | 11.3% | 9.5%(+1.78)#83 | 9.8%(+1.49)#12,300 |
| 84. | 03602 | 11.3% | 9.5%(+1.77)#84 | 9.8%(+1.48)#12,324 |
| 85. | 03887 | 11.2% | 9.5%(+1.72)#85 | 9.8%(+1.43)#12,429 |
| 86. | 03601 | 11.1% | 9.5%(+1.62)#86 | 9.8%(+1.33)#12,626 |
| 87. | 03607 | 11.1% | 9.5%(+1.62)#87 | 9.8%(+1.33)#12,633 |
| 88. | 03440 | 11.0% | 9.5%(+1.55)#88 | 9.8%(+1.26)#12,773 |
| 89. | 03839 | 11.0% | 9.5%(+1.51)#89 | 9.8%(+1.22)#12,879 |
| 90. | 03063 | 11.0% | 9.5%(+1.48)#90 | 9.8%(+1.19)#12,928 |
| 91. | 03307 | 10.9% | 9.5%(+1.44)#91 | 9.8%(+1.15)#13,020 |
| 92. | 03816 | 10.9% | 9.5%(+1.43)#92 | 9.8%(+1.14)#13,029 |
| 93. | 03244 | 10.9% | 9.5%(+1.42)#93 | 9.8%(+1.13)#13,057 |
| 94. | 03841 | 10.9% | 9.5%(+1.37)#94 | 9.8%(+1.08)#13,170 |
| 95. | 03826 | 10.9% | 9.5%(+1.37)#95 | 9.8%(+1.08)#13,180 |
| 96. | 03833 | 10.7% | 9.5%(+1.25)#96 | 9.8%(+0.958)#13,443 |
| 97. | 03070 | 10.7% | 9.5%(+1.24)#97 | 9.8%(+0.949)#13,459 |
| 98. | 03810 | 10.6% | 9.5%(+1.14)#98 | 9.8%(+0.850)#13,677 |
| 99. | 03593 | 10.6% | 9.5%(+1.09)#99 | 9.8%(+0.802)#13,776 |
| 100. | 03818 | 10.5% | 9.5%(+1.05)#100 | 9.8%(+0.762)#13,858 |
Common Questions
What are the Top 10 Zip Codes with the Highest Percentage of Population with a Degree in Science and Engineering in New Hampshire?
Top 10 Zip Codes with the Highest Percentage of Population with a Degree in Science and Engineering in New Hampshire are:
What zip code has the Highest Percentage of Population with a Degree in Science and Engineering in New Hampshire?
03291 has the Highest Percentage of Population with a Degree in Science and Engineering in New Hampshire with 50.0%.
What is the Percentage of Population with a Degree in Science and Engineering in the State of New Hampshire?
Percentage of Population with a Degree in Science and Engineering in New Hampshire is 9.5%.
What is the Percentage of Population with a Degree in Science and Engineering in the United States?
Percentage of Population with a Degree in Science and Engineering in the United States is 9.8%.