Zip Codes with the Highest Percentage of Population Employed in Computer & Mathematics in Bowling Green, KY
RELATED REPORTS & OPTIONS
Computer & Mathematics
Bowling Green
Compare Zip Codes
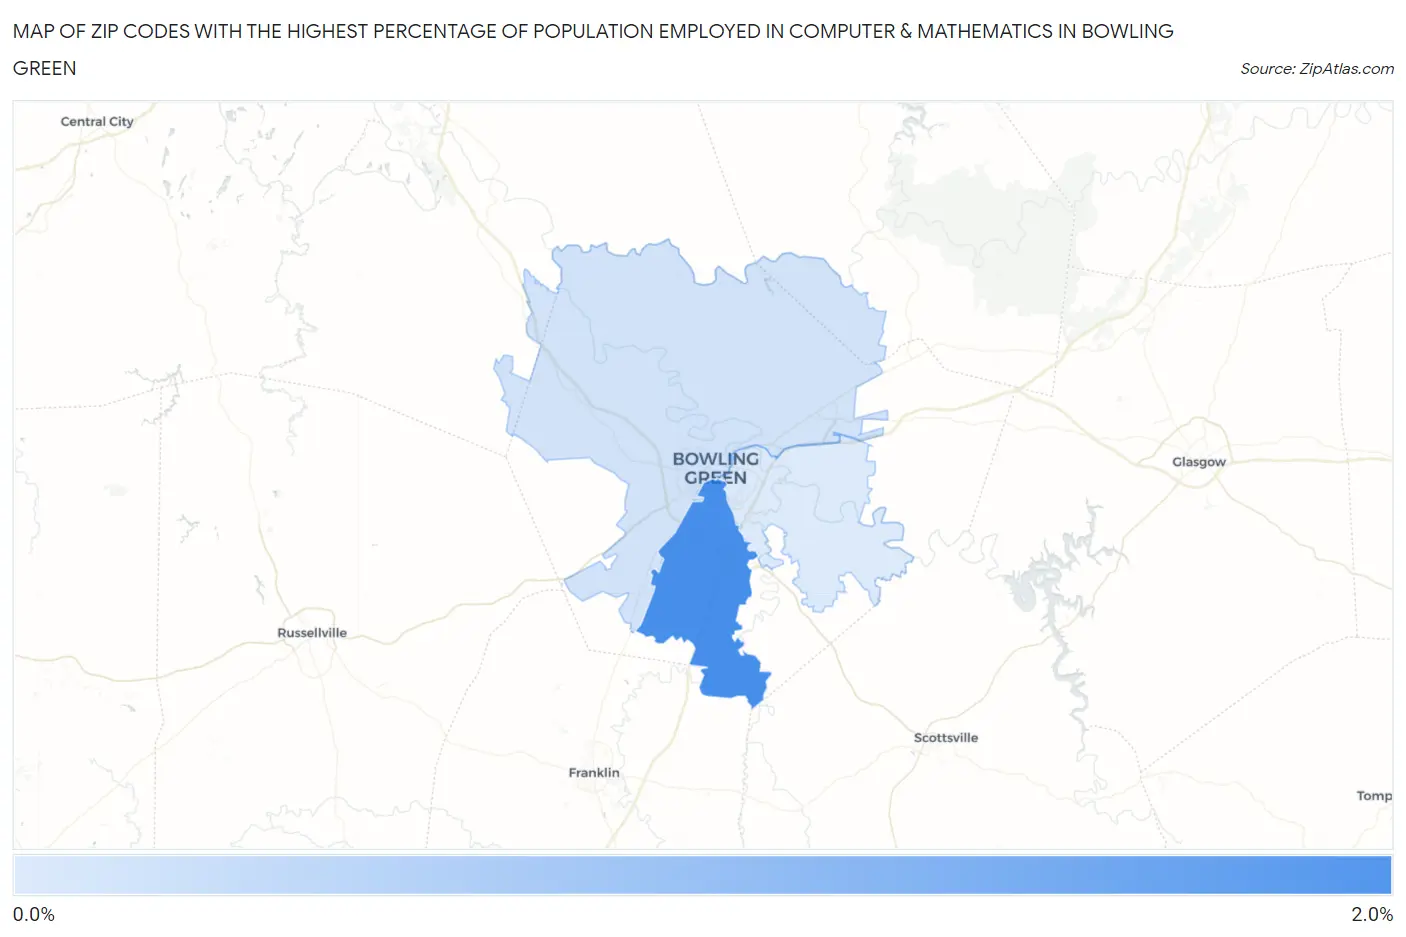
Map of Zip Codes with the Highest Percentage of Population Employed in Computer & Mathematics in Bowling Green
0.86%
1.6%
Zip Codes with the Highest Percentage of Population Employed in Computer & Mathematics in Bowling Green, KY
| Zip Code | % Employed | vs State | vs National | |
| 1. | 42104 | 1.6% | 2.2%(-0.577)#206 | 3.5%(-1.94)#13,879 |
| 2. | 42101 | 0.91% | 2.2%(-1.25)#269 | 3.5%(-2.61)#17,965 |
| 3. | 42103 | 0.86% | 2.2%(-1.31)#281 | 3.5%(-2.67)#18,304 |
1
Common Questions
What are the Top Zip Codes with the Highest Percentage of Population Employed in Computer & Mathematics in Bowling Green, KY?
Top Zip Codes with the Highest Percentage of Population Employed in Computer & Mathematics in Bowling Green, KY are:
What zip code has the Highest Percentage of Population Employed in Computer & Mathematics in Bowling Green, KY?
42104 has the Highest Percentage of Population Employed in Computer & Mathematics in Bowling Green, KY with 1.6%.
What is the Percentage of Population Employed in Computer & Mathematics in Bowling Green, KY?
Percentage of Population Employed in Computer & Mathematics in Bowling Green is 1.1%.
What is the Percentage of Population Employed in Computer & Mathematics in Kentucky?
Percentage of Population Employed in Computer & Mathematics in Kentucky is 2.2%.
What is the Percentage of Population Employed in Computer & Mathematics in the United States?
Percentage of Population Employed in Computer & Mathematics in the United States is 3.5%.