South American vs Paiute Self-Care Disability
COMPARE
South American
Paiute
Self-Care Disability
Self-Care Disability Comparison
South Americans
Paiute
2.4%
SELF-CARE DISABILITY
93.2/ 100
METRIC RATING
113th/ 347
METRIC RANK
2.9%
SELF-CARE DISABILITY
0.0/ 100
METRIC RATING
326th/ 347
METRIC RANK
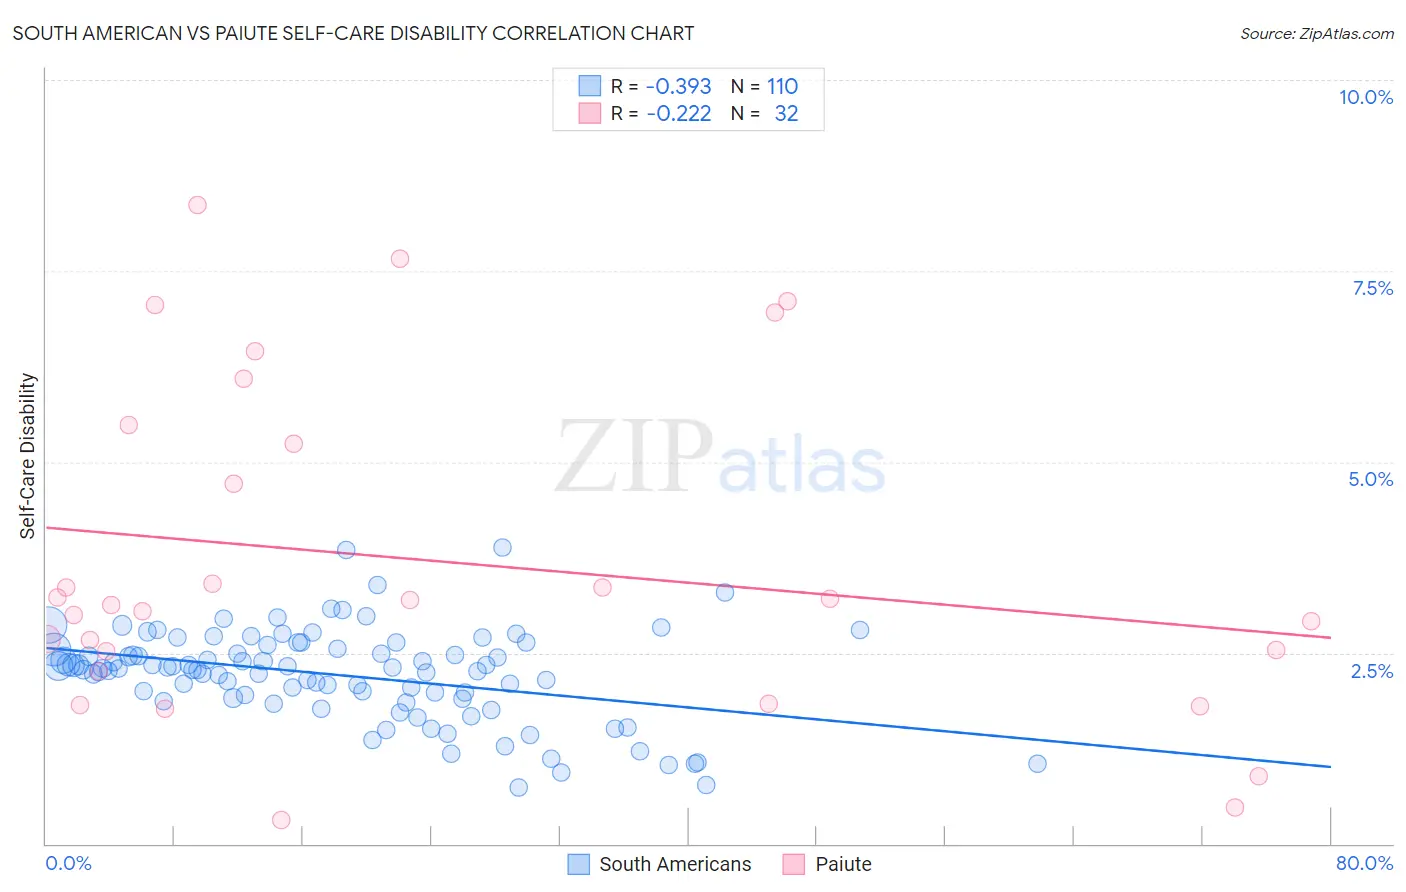
South American vs Paiute Self-Care Disability Correlation Chart
The statistical analysis conducted on geographies consisting of 493,131,874 people shows a mild negative correlation between the proportion of South Americans and percentage of population with self-care disability in the United States with a correlation coefficient (R) of -0.393 and weighted average of 2.4%. Similarly, the statistical analysis conducted on geographies consisting of 58,381,143 people shows a weak negative correlation between the proportion of Paiute and percentage of population with self-care disability in the United States with a correlation coefficient (R) of -0.222 and weighted average of 2.9%, a difference of 22.2%.
Self-Care Disability Correlation Summary
| Measurement | South American | Paiute |
| Minimum | 0.74% | 0.31% |
| Maximum | 3.9% | 8.4% |
| Range | 3.1% | 8.1% |
| Mean | 2.2% | 3.7% |
| Median | 2.3% | 3.2% |
| Interquartile 25% (IQ1) | 1.9% | 2.4% |
| Interquartile 75% (IQ3) | 2.6% | 5.4% |
| Interquartile Range (IQR) | 0.65% | 3.0% |
| Standard Deviation (Sample) | 0.60% | 2.2% |
| Standard Deviation (Population) | 0.59% | 2.1% |
Similar Demographics by Self-Care Disability
Demographics Similar to South Americans by Self-Care Disability
In terms of self-care disability, the demographic groups most similar to South Americans are Immigrants from North Macedonia (2.4%, a difference of 0.0%), Immigrants from Hong Kong (2.4%, a difference of 0.010%), Scandinavian (2.4%, a difference of 0.060%), Northern European (2.4%, a difference of 0.060%), and Serbian (2.4%, a difference of 0.090%).
| Demographics | Rating | Rank | Self-Care Disability |
| Immigrants | Indonesia | 94.3 /100 | #106 | Exceptional 2.4% |
| British | 94.3 /100 | #107 | Exceptional 2.4% |
| Greeks | 94.1 /100 | #108 | Exceptional 2.4% |
| Slovenes | 94.1 /100 | #109 | Exceptional 2.4% |
| Immigrants | Africa | 93.7 /100 | #110 | Exceptional 2.4% |
| Serbians | 93.6 /100 | #111 | Exceptional 2.4% |
| Scandinavians | 93.5 /100 | #112 | Exceptional 2.4% |
| South Americans | 93.2 /100 | #113 | Exceptional 2.4% |
| Immigrants | North Macedonia | 93.1 /100 | #114 | Exceptional 2.4% |
| Immigrants | Hong Kong | 93.1 /100 | #115 | Exceptional 2.4% |
| Northern Europeans | 92.9 /100 | #116 | Exceptional 2.4% |
| Taiwanese | 92.5 /100 | #117 | Exceptional 2.4% |
| Immigrants | Canada | 92.0 /100 | #118 | Exceptional 2.4% |
| Immigrants | Sierra Leone | 91.8 /100 | #119 | Exceptional 2.4% |
| Uruguayans | 91.5 /100 | #120 | Exceptional 2.4% |
Demographics Similar to Paiute by Self-Care Disability
In terms of self-care disability, the demographic groups most similar to Paiute are Black/African American (2.9%, a difference of 0.070%), Hopi (2.9%, a difference of 0.45%), Cajun (2.9%, a difference of 0.67%), Immigrants from Uzbekistan (2.9%, a difference of 0.94%), and Nepalese (3.0%, a difference of 1.4%).
| Demographics | Rating | Rank | Self-Care Disability |
| Spanish American Indians | 0.0 /100 | #319 | Tragic 2.9% |
| Chickasaw | 0.0 /100 | #320 | Tragic 2.9% |
| Navajo | 0.0 /100 | #321 | Tragic 2.9% |
| Comanche | 0.0 /100 | #322 | Tragic 2.9% |
| Seminole | 0.0 /100 | #323 | Tragic 2.9% |
| Cherokee | 0.0 /100 | #324 | Tragic 2.9% |
| Immigrants | Uzbekistan | 0.0 /100 | #325 | Tragic 2.9% |
| Paiute | 0.0 /100 | #326 | Tragic 2.9% |
| Blacks/African Americans | 0.0 /100 | #327 | Tragic 2.9% |
| Hopi | 0.0 /100 | #328 | Tragic 2.9% |
| Cajuns | 0.0 /100 | #329 | Tragic 2.9% |
| Nepalese | 0.0 /100 | #330 | Tragic 3.0% |
| Lumbee | 0.0 /100 | #331 | Tragic 3.0% |
| Kiowa | 0.0 /100 | #332 | Tragic 3.0% |
| Dutch West Indians | 0.0 /100 | #333 | Tragic 3.0% |