Potawatomi vs Yugoslavian Self-Care Disability
COMPARE
Potawatomi
Yugoslavian
Self-Care Disability
Self-Care Disability Comparison
Potawatomi
Yugoslavians
2.6%
SELF-CARE DISABILITY
0.3/ 100
METRIC RATING
257th/ 347
METRIC RANK
2.5%
SELF-CARE DISABILITY
36.1/ 100
METRIC RATING
184th/ 347
METRIC RANK
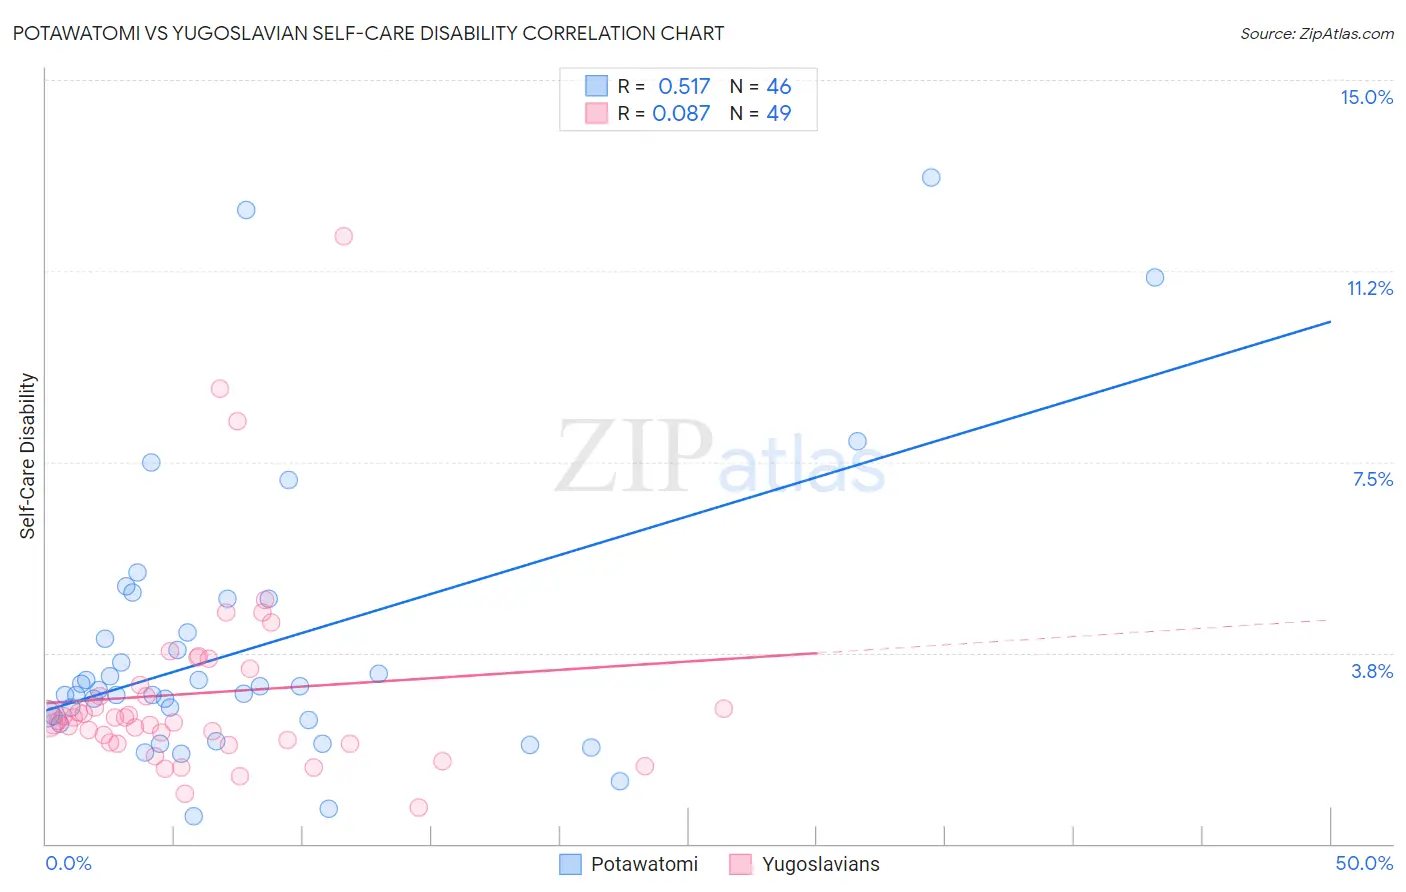
Potawatomi vs Yugoslavian Self-Care Disability Correlation Chart
The statistical analysis conducted on geographies consisting of 117,741,431 people shows a substantial positive correlation between the proportion of Potawatomi and percentage of population with self-care disability in the United States with a correlation coefficient (R) of 0.517 and weighted average of 2.6%. Similarly, the statistical analysis conducted on geographies consisting of 285,516,060 people shows a slight positive correlation between the proportion of Yugoslavians and percentage of population with self-care disability in the United States with a correlation coefficient (R) of 0.087 and weighted average of 2.5%, a difference of 6.3%.
Self-Care Disability Correlation Summary
| Measurement | Potawatomi | Yugoslavian |
| Minimum | 0.54% | 0.70% |
| Maximum | 13.1% | 11.9% |
| Range | 12.5% | 11.2% |
| Mean | 3.8% | 3.0% |
| Median | 3.0% | 2.5% |
| Interquartile 25% (IQ1) | 2.4% | 2.0% |
| Interquartile 75% (IQ3) | 4.2% | 3.3% |
| Interquartile Range (IQR) | 1.7% | 1.3% |
| Standard Deviation (Sample) | 2.7% | 2.0% |
| Standard Deviation (Population) | 2.7% | 2.0% |
Similar Demographics by Self-Care Disability
Demographics Similar to Potawatomi by Self-Care Disability
In terms of self-care disability, the demographic groups most similar to Potawatomi are Nonimmigrants (2.6%, a difference of 0.070%), Immigrants from Belarus (2.6%, a difference of 0.14%), Chippewa (2.6%, a difference of 0.18%), Immigrants from Central America (2.6%, a difference of 0.20%), and Arapaho (2.6%, a difference of 0.20%).
| Demographics | Rating | Rank | Self-Care Disability |
| Portuguese | 0.4 /100 | #250 | Tragic 2.6% |
| Immigrants | Liberia | 0.4 /100 | #251 | Tragic 2.6% |
| Immigrants | Bangladesh | 0.4 /100 | #252 | Tragic 2.6% |
| Immigrants | Haiti | 0.3 /100 | #253 | Tragic 2.6% |
| Haitians | 0.3 /100 | #254 | Tragic 2.6% |
| Tsimshian | 0.3 /100 | #255 | Tragic 2.6% |
| Immigrants | Central America | 0.3 /100 | #256 | Tragic 2.6% |
| Potawatomi | 0.3 /100 | #257 | Tragic 2.6% |
| Immigrants | Nonimmigrants | 0.3 /100 | #258 | Tragic 2.6% |
| Immigrants | Belarus | 0.2 /100 | #259 | Tragic 2.6% |
| Chippewa | 0.2 /100 | #260 | Tragic 2.6% |
| Arapaho | 0.2 /100 | #261 | Tragic 2.6% |
| Shoshone | 0.2 /100 | #262 | Tragic 2.7% |
| Immigrants | Latin America | 0.2 /100 | #263 | Tragic 2.7% |
| Immigrants | Iran | 0.2 /100 | #264 | Tragic 2.7% |
Demographics Similar to Yugoslavians by Self-Care Disability
In terms of self-care disability, the demographic groups most similar to Yugoslavians are Salvadoran (2.5%, a difference of 0.020%), Maltese (2.5%, a difference of 0.070%), Slavic (2.5%, a difference of 0.090%), Immigrants from El Salvador (2.5%, a difference of 0.17%), and Ghanaian (2.5%, a difference of 0.21%).
| Demographics | Rating | Rank | Self-Care Disability |
| Immigrants | Kazakhstan | 46.7 /100 | #177 | Average 2.5% |
| English | 46.2 /100 | #178 | Average 2.5% |
| Hungarians | 45.5 /100 | #179 | Average 2.5% |
| Indonesians | 41.2 /100 | #180 | Average 2.5% |
| Ghanaians | 40.4 /100 | #181 | Average 2.5% |
| Maltese | 37.5 /100 | #182 | Fair 2.5% |
| Salvadorans | 36.4 /100 | #183 | Fair 2.5% |
| Yugoslavians | 36.1 /100 | #184 | Fair 2.5% |
| Slavs | 34.3 /100 | #185 | Fair 2.5% |
| Immigrants | El Salvador | 33.0 /100 | #186 | Fair 2.5% |
| Irish | 28.7 /100 | #187 | Fair 2.5% |
| Immigrants | Oceania | 28.3 /100 | #188 | Fair 2.5% |
| Immigrants | Eastern Europe | 28.0 /100 | #189 | Fair 2.5% |
| Sioux | 24.6 /100 | #190 | Fair 2.5% |
| Moroccans | 22.9 /100 | #191 | Fair 2.5% |