New Zealander Female Disability
COMPARE
New Zealander
Select to Compare
Female Disability
New Zealander Female Disability
11.7%
DISABILITY | FEMALES
98.1/ 100
METRIC RATING
108th/ 347
METRIC RANK
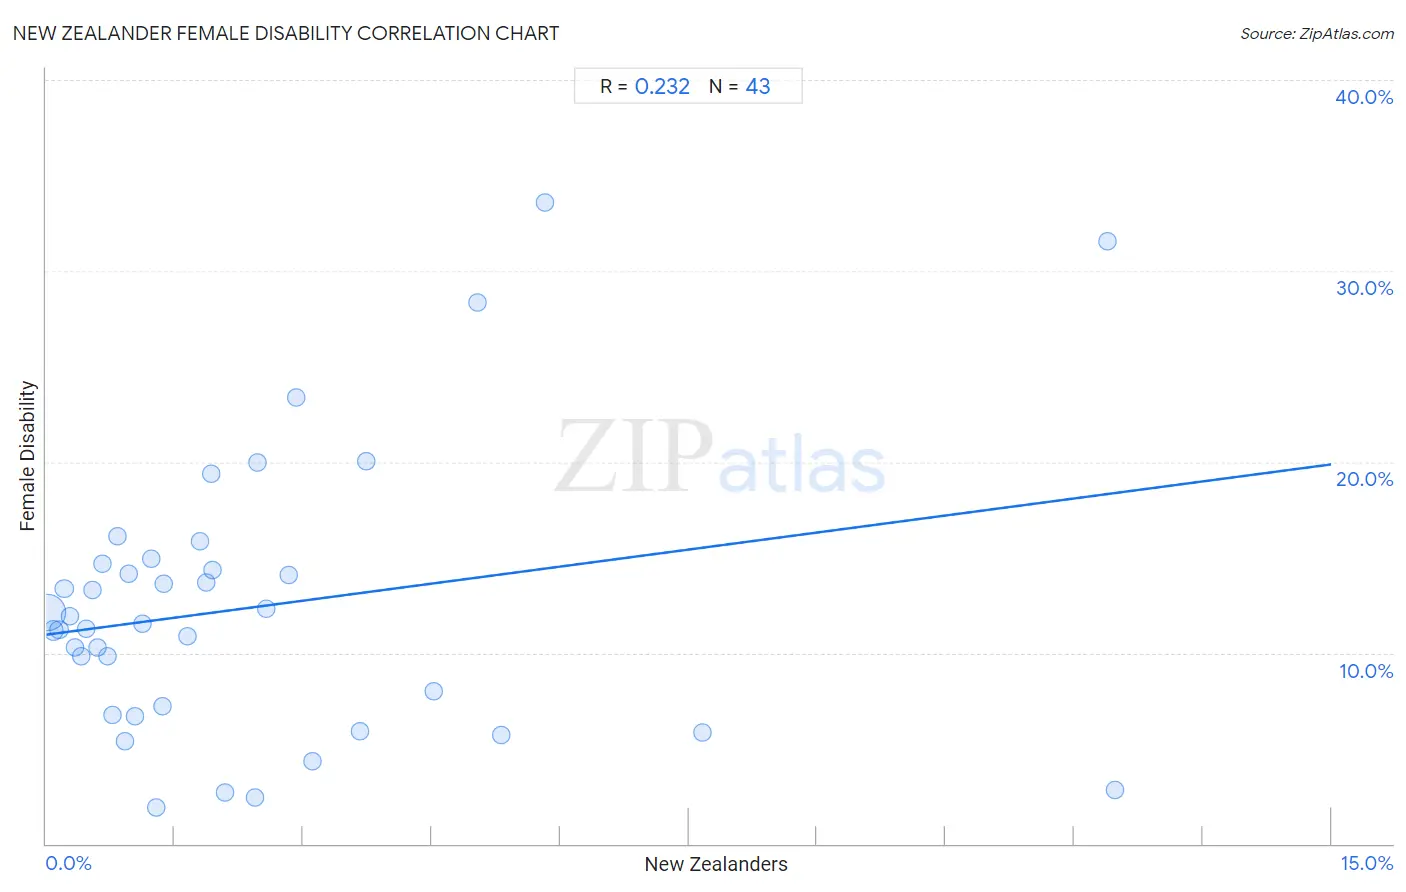
New Zealander Female Disability Correlation Chart
The statistical analysis conducted on geographies consisting of 106,921,285 people shows a weak positive correlation between the proportion of New Zealanders and percentage of females with a disability in the United States with a correlation coefficient (R) of 0.232 and weighted average of 11.7%. On average, for every 1% (one percent) increase in New Zealanders within a typical geography, there is an increase of 0.59% in percentage of females with a disability.
It is essential to understand that the correlation between the percentage of New Zealanders and percentage of females with a disability does not imply a direct cause-and-effect relationship. It remains uncertain whether the presence of New Zealanders influences an upward or downward trend in the level of percentage of females with a disability within an area, or if New Zealanders simply ended up residing in those areas with higher or lower levels of percentage of females with a disability due to other factors.
Demographics Similar to New Zealanders by Female Disability
In terms of female disability, the demographic groups most similar to New Zealanders are Latvian (11.7%, a difference of 0.020%), Immigrants (11.7%, a difference of 0.030%), Soviet Union (11.7%, a difference of 0.030%), Immigrants from Greece (11.7%, a difference of 0.050%), and Costa Rican (11.7%, a difference of 0.050%).
| Demographics | Rating | Rank | Female Disability |
| Immigrants from Costa Rica | 98.4 /100 | #101 | Exceptional 11.7% |
| Immigrants from South Eastern Asia | 98.4 /100 | #102 | Exceptional 11.7% |
| Immigrants from Eastern Africa | 98.3 /100 | #103 | Exceptional 11.7% |
| Immigrants from Western Asia | 98.3 /100 | #104 | Exceptional 11.7% |
| Australians | 98.3 /100 | #105 | Exceptional 11.7% |
| Immigrants from Greece | 98.2 /100 | #106 | Exceptional 11.7% |
| Latvians | 98.2 /100 | #107 | Exceptional 11.7% |
| New Zealanders | 98.1 /100 | #108 | Exceptional 11.7% |
| Immigrants | 98.1 /100 | #109 | Exceptional 11.7% |
| Soviet Union | 98.1 /100 | #110 | Exceptional 11.7% |
| Costa Ricans | 98.1 /100 | #111 | Exceptional 11.7% |
| Immigrants from Bangladesh | 97.8 /100 | #112 | Exceptional 11.8% |
| Immigrants from Belarus | 97.8 /100 | #113 | Exceptional 11.8% |
| South Africans | 97.7 /100 | #114 | Exceptional 11.8% |
| Brazilians | 97.7 /100 | #115 | Exceptional 11.8% |
New Zealander Female Disability Correlation Summary
| Measurement | New Zealander Data | Female Disability Data |
| Minimum | 0.016% | 1.9% |
| Maximum | 12.5% | 33.6% |
| Range | 12.5% | 31.7% |
| Mean | 2.4% | 12.4% |
| Median | 1.4% | 11.6% |
| Interquartile 25% (IQ1) | 0.66% | 6.7% |
| Interquartile 75% (IQ3) | 2.9% | 14.7% |
| Interquartile Range (IQR) | 2.3% | 7.9% |
| Standard Deviation (Sample) | 2.8% | 7.2% |
| Standard Deviation (Population) | 2.8% | 7.1% |
Correlation Details
| New Zealander Percentile | Sample Size | Female Disability |
[ 0.0% - 0.5% ] 0.016% | 93,462,306 | 12.1% |
[ 0.0% - 0.5% ] 0.086% | 7,622,686 | 11.2% |
[ 0.0% - 0.5% ] 0.15% | 2,744,646 | 11.2% |
[ 0.0% - 0.5% ] 0.21% | 997,112 | 13.3% |
[ 0.0% - 0.5% ] 0.27% | 672,956 | 11.9% |
[ 0.0% - 0.5% ] 0.34% | 447,216 | 10.3% |
[ 0.0% - 0.5% ] 0.40% | 215,327 | 9.8% |
[ 0.0% - 0.5% ] 0.47% | 202,537 | 11.3% |
[ 0.5% - 1.0% ] 0.54% | 140,065 | 13.3% |
[ 0.5% - 1.0% ] 0.60% | 54,436 | 10.3% |
[ 0.5% - 1.0% ] 0.66% | 62,608 | 14.7% |
[ 0.5% - 1.0% ] 0.71% | 57,516 | 9.8% |
[ 0.5% - 1.0% ] 0.78% | 28,543 | 6.7% |
[ 0.5% - 1.0% ] 0.84% | 58,018 | 16.1% |
[ 0.5% - 1.0% ] 0.92% | 35,587 | 5.4% |
[ 0.5% - 1.0% ] 0.96% | 26,023 | 14.1% |
[ 1.0% - 1.5% ] 1.03% | 7,645 | 6.7% |
[ 1.0% - 1.5% ] 1.12% | 5,012 | 11.6% |
[ 1.0% - 1.5% ] 1.23% | 7,787 | 14.9% |
[ 1.0% - 1.5% ] 1.29% | 16,056 | 1.9% |
[ 1.0% - 1.5% ] 1.35% | 13,322 | 7.2% |
[ 1.0% - 1.5% ] 1.38% | 6,534 | 13.6% |
[ 1.5% - 2.0% ] 1.65% | 363 | 10.9% |
[ 1.5% - 2.0% ] 1.79% | 6,467 | 15.8% |
[ 1.5% - 2.0% ] 1.86% | 1,019 | 13.7% |
[ 1.5% - 2.0% ] 1.92% | 1,247 | 19.4% |
[ 1.5% - 2.0% ] 1.95% | 976 | 14.4% |
[ 2.0% - 2.5% ] 2.09% | 3,305 | 2.7% |
[ 2.0% - 2.5% ] 2.43% | 2,016 | 2.4% |
[ 2.0% - 2.5% ] 2.47% | 3,367 | 20.0% |
[ 2.5% - 3.0% ] 2.57% | 4,402 | 12.3% |
[ 2.5% - 3.0% ] 2.84% | 282 | 14.1% |
[ 2.5% - 3.0% ] 2.92% | 6,345 | 23.4% |
[ 3.0% - 3.5% ] 3.11% | 1,413 | 4.3% |
[ 3.5% - 4.0% ] 3.67% | 491 | 5.9% |
[ 3.5% - 4.0% ] 3.73% | 1,340 | 20.1% |
[ 4.5% - 5.0% ] 4.52% | 177 | 8.0% |
[ 5.0% - 5.5% ] 5.03% | 894 | 28.4% |
[ 5.0% - 5.5% ] 5.30% | 886 | 5.7% |
[ 5.5% - 6.0% ] 5.82% | 498 | 33.6% |
[ 7.5% - 8.0% ] 7.66% | 1,240 | 5.8% |
[ 12.0% - 12.5% ] 12.39% | 218 | 31.6% |
[ 12.0% - 12.5% ] 12.47% | 401 | 2.8% |