New Zealander vs Arab Self-Care Disability
COMPARE
New Zealander
Arab
Self-Care Disability
Self-Care Disability Comparison
New Zealanders
Arabs
2.3%
SELF-CARE DISABILITY
99.5/ 100
METRIC RATING
59th/ 347
METRIC RANK
2.4%
SELF-CARE DISABILITY
75.7/ 100
METRIC RATING
149th/ 347
METRIC RANK
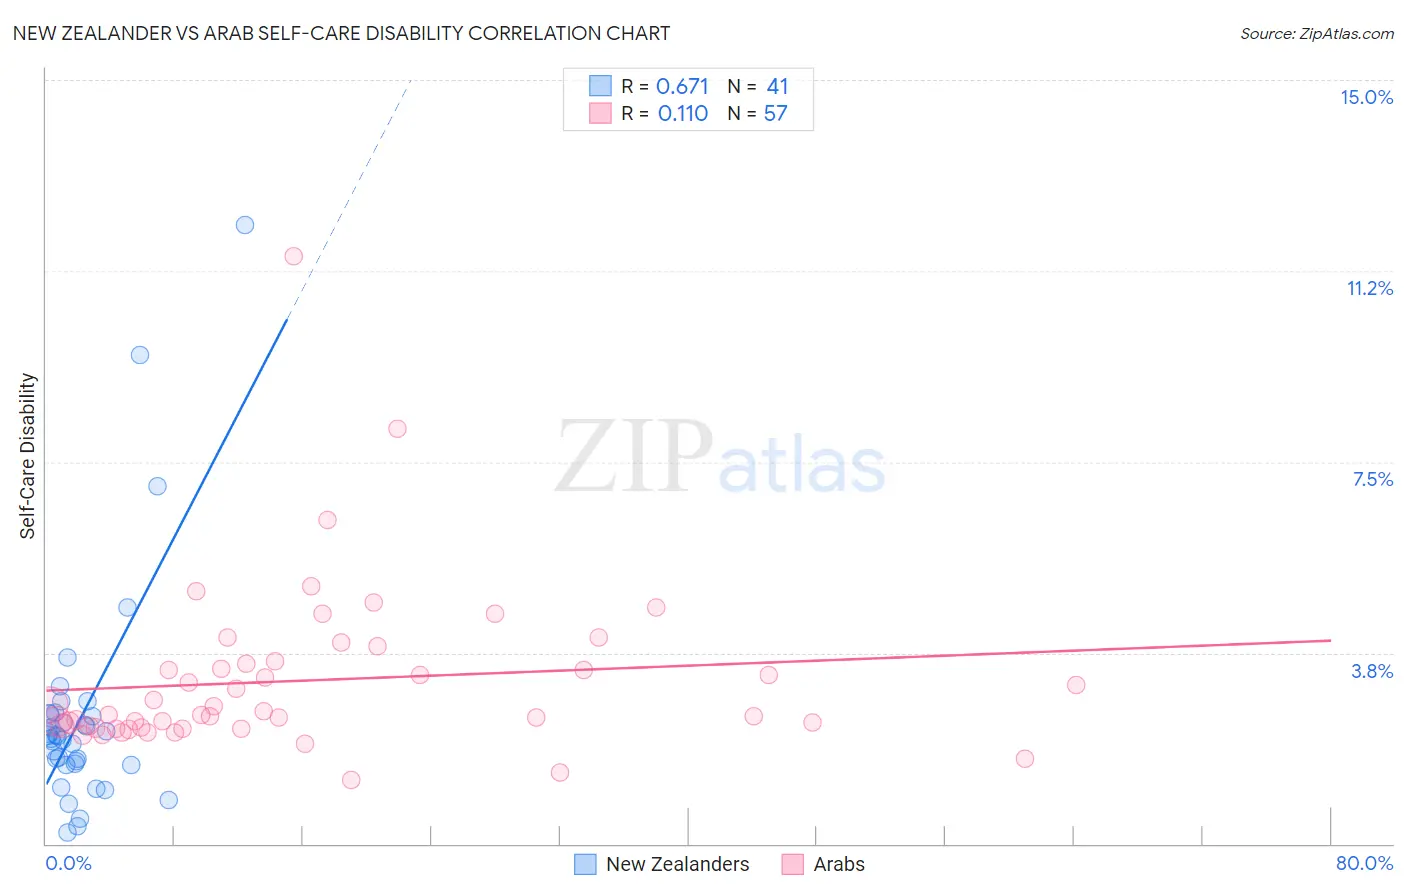
New Zealander vs Arab Self-Care Disability Correlation Chart
The statistical analysis conducted on geographies consisting of 106,879,653 people shows a significant positive correlation between the proportion of New Zealanders and percentage of population with self-care disability in the United States with a correlation coefficient (R) of 0.671 and weighted average of 2.3%. Similarly, the statistical analysis conducted on geographies consisting of 485,999,863 people shows a poor positive correlation between the proportion of Arabs and percentage of population with self-care disability in the United States with a correlation coefficient (R) of 0.110 and weighted average of 2.4%, a difference of 5.3%.
Self-Care Disability Correlation Summary
| Measurement | New Zealander | Arab |
| Minimum | 0.21% | 1.3% |
| Maximum | 12.2% | 11.5% |
| Range | 11.9% | 10.3% |
| Mean | 2.5% | 3.2% |
| Median | 2.1% | 2.5% |
| Interquartile 25% (IQ1) | 1.6% | 2.3% |
| Interquartile 75% (IQ3) | 2.5% | 3.6% |
| Interquartile Range (IQR) | 0.97% | 1.3% |
| Standard Deviation (Sample) | 2.3% | 1.6% |
| Standard Deviation (Population) | 2.2% | 1.6% |
Similar Demographics by Self-Care Disability
Demographics Similar to New Zealanders by Self-Care Disability
In terms of self-care disability, the demographic groups most similar to New Zealanders are Immigrants from Cameroon (2.3%, a difference of 0.11%), Immigrants from Japan (2.3%, a difference of 0.14%), Immigrants from Belgium (2.3%, a difference of 0.18%), Immigrants from Eastern Asia (2.3%, a difference of 0.19%), and Immigrants from France (2.3%, a difference of 0.23%).
| Demographics | Rating | Rank | Self-Care Disability |
| Immigrants | Serbia | 99.6 /100 | #52 | Exceptional 2.3% |
| Australians | 99.6 /100 | #53 | Exceptional 2.3% |
| Argentineans | 99.6 /100 | #54 | Exceptional 2.3% |
| Immigrants | France | 99.6 /100 | #55 | Exceptional 2.3% |
| Immigrants | Eastern Asia | 99.6 /100 | #56 | Exceptional 2.3% |
| Immigrants | Belgium | 99.6 /100 | #57 | Exceptional 2.3% |
| Immigrants | Cameroon | 99.6 /100 | #58 | Exceptional 2.3% |
| New Zealanders | 99.5 /100 | #59 | Exceptional 2.3% |
| Immigrants | Japan | 99.5 /100 | #60 | Exceptional 2.3% |
| Palestinians | 99.4 /100 | #61 | Exceptional 2.3% |
| Egyptians | 99.4 /100 | #62 | Exceptional 2.3% |
| Mongolians | 99.3 /100 | #63 | Exceptional 2.3% |
| Swedes | 99.3 /100 | #64 | Exceptional 2.3% |
| Brazilians | 99.3 /100 | #65 | Exceptional 2.3% |
| Immigrants | Argentina | 99.3 /100 | #66 | Exceptional 2.3% |
Demographics Similar to Arabs by Self-Care Disability
In terms of self-care disability, the demographic groups most similar to Arabs are Romanian (2.4%, a difference of 0.010%), Immigrants from Costa Rica (2.4%, a difference of 0.040%), Basque (2.4%, a difference of 0.11%), Dutch (2.4%, a difference of 0.12%), and Tlingit-Haida (2.4%, a difference of 0.14%).
| Demographics | Rating | Rank | Self-Care Disability |
| Immigrants | Peru | 83.2 /100 | #142 | Excellent 2.4% |
| Afghans | 82.3 /100 | #143 | Excellent 2.4% |
| Costa Ricans | 80.8 /100 | #144 | Excellent 2.4% |
| Germans | 80.1 /100 | #145 | Excellent 2.4% |
| Israelis | 80.0 /100 | #146 | Good 2.4% |
| Dutch | 77.5 /100 | #147 | Good 2.4% |
| Romanians | 75.8 /100 | #148 | Good 2.4% |
| Arabs | 75.7 /100 | #149 | Good 2.4% |
| Immigrants | Costa Rica | 75.1 /100 | #150 | Good 2.4% |
| Basques | 74.0 /100 | #151 | Good 2.4% |
| Tlingit-Haida | 73.5 /100 | #152 | Good 2.4% |
| Immigrants | England | 73.5 /100 | #153 | Good 2.4% |
| Italians | 72.2 /100 | #154 | Good 2.4% |
| Pakistanis | 71.4 /100 | #155 | Good 2.4% |
| Nigerians | 70.6 /100 | #156 | Good 2.4% |