New Zealander vs Immigrants from Russia Self-Care Disability
COMPARE
New Zealander
Immigrants from Russia
Self-Care Disability
Self-Care Disability Comparison
New Zealanders
Immigrants from Russia
2.3%
SELF-CARE DISABILITY
99.5/ 100
METRIC RATING
59th/ 347
METRIC RANK
2.5%
SELF-CARE DISABILITY
11.0/ 100
METRIC RATING
205th/ 347
METRIC RANK
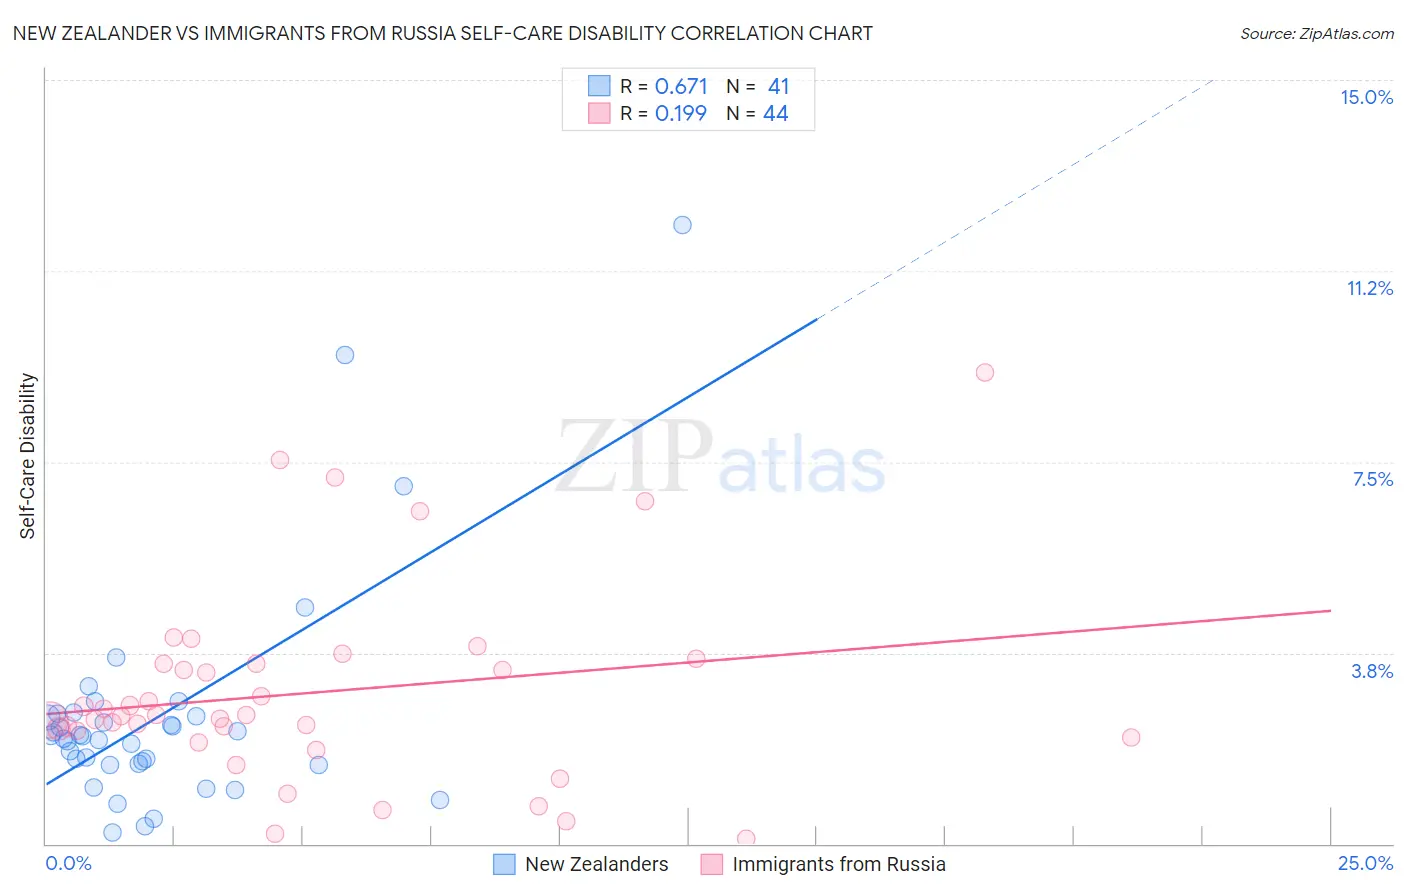
New Zealander vs Immigrants from Russia Self-Care Disability Correlation Chart
The statistical analysis conducted on geographies consisting of 106,879,653 people shows a significant positive correlation between the proportion of New Zealanders and percentage of population with self-care disability in the United States with a correlation coefficient (R) of 0.671 and weighted average of 2.3%. Similarly, the statistical analysis conducted on geographies consisting of 347,529,839 people shows a poor positive correlation between the proportion of Immigrants from Russia and percentage of population with self-care disability in the United States with a correlation coefficient (R) of 0.199 and weighted average of 2.5%, a difference of 9.5%.
Self-Care Disability Correlation Summary
| Measurement | New Zealander | Immigrants from Russia |
| Minimum | 0.21% | 0.094% |
| Maximum | 12.2% | 9.3% |
| Range | 11.9% | 9.2% |
| Mean | 2.5% | 3.0% |
| Median | 2.1% | 2.5% |
| Interquartile 25% (IQ1) | 1.6% | 2.2% |
| Interquartile 75% (IQ3) | 2.5% | 3.5% |
| Interquartile Range (IQR) | 0.97% | 1.4% |
| Standard Deviation (Sample) | 2.3% | 1.9% |
| Standard Deviation (Population) | 2.2% | 1.9% |
Similar Demographics by Self-Care Disability
Demographics Similar to New Zealanders by Self-Care Disability
In terms of self-care disability, the demographic groups most similar to New Zealanders are Immigrants from Cameroon (2.3%, a difference of 0.11%), Immigrants from Japan (2.3%, a difference of 0.14%), Immigrants from Belgium (2.3%, a difference of 0.18%), Immigrants from Eastern Asia (2.3%, a difference of 0.19%), and Immigrants from France (2.3%, a difference of 0.23%).
| Demographics | Rating | Rank | Self-Care Disability |
| Immigrants | Serbia | 99.6 /100 | #52 | Exceptional 2.3% |
| Australians | 99.6 /100 | #53 | Exceptional 2.3% |
| Argentineans | 99.6 /100 | #54 | Exceptional 2.3% |
| Immigrants | France | 99.6 /100 | #55 | Exceptional 2.3% |
| Immigrants | Eastern Asia | 99.6 /100 | #56 | Exceptional 2.3% |
| Immigrants | Belgium | 99.6 /100 | #57 | Exceptional 2.3% |
| Immigrants | Cameroon | 99.6 /100 | #58 | Exceptional 2.3% |
| New Zealanders | 99.5 /100 | #59 | Exceptional 2.3% |
| Immigrants | Japan | 99.5 /100 | #60 | Exceptional 2.3% |
| Palestinians | 99.4 /100 | #61 | Exceptional 2.3% |
| Egyptians | 99.4 /100 | #62 | Exceptional 2.3% |
| Mongolians | 99.3 /100 | #63 | Exceptional 2.3% |
| Swedes | 99.3 /100 | #64 | Exceptional 2.3% |
| Brazilians | 99.3 /100 | #65 | Exceptional 2.3% |
| Immigrants | Argentina | 99.3 /100 | #66 | Exceptional 2.3% |
Demographics Similar to Immigrants from Russia by Self-Care Disability
In terms of self-care disability, the demographic groups most similar to Immigrants from Russia are Alaskan Athabascan (2.5%, a difference of 0.080%), Immigrants from Bahamas (2.5%, a difference of 0.10%), French (2.5%, a difference of 0.14%), Immigrants from Lebanon (2.5%, a difference of 0.15%), and Slovak (2.5%, a difference of 0.18%).
| Demographics | Rating | Rank | Self-Care Disability |
| Immigrants | Immigrants | 15.0 /100 | #198 | Poor 2.5% |
| Immigrants | Ghana | 14.7 /100 | #199 | Poor 2.5% |
| Immigrants | Western Africa | 13.3 /100 | #200 | Poor 2.5% |
| Immigrants | South Eastern Asia | 12.9 /100 | #201 | Poor 2.5% |
| Slovaks | 12.6 /100 | #202 | Poor 2.5% |
| Immigrants | Lebanon | 12.4 /100 | #203 | Poor 2.5% |
| Immigrants | Bahamas | 11.9 /100 | #204 | Poor 2.5% |
| Immigrants | Russia | 11.0 /100 | #205 | Poor 2.5% |
| Alaskan Athabascans | 10.4 /100 | #206 | Poor 2.5% |
| French | 9.9 /100 | #207 | Tragic 2.5% |
| Central Americans | 8.7 /100 | #208 | Tragic 2.5% |
| Malaysians | 7.7 /100 | #209 | Tragic 2.5% |
| Panamanians | 6.4 /100 | #210 | Tragic 2.5% |
| Native Hawaiians | 5.1 /100 | #211 | Tragic 2.6% |
| Samoans | 5.1 /100 | #212 | Tragic 2.6% |