Immigrants from Panama vs Hungarian Self-Care Disability
COMPARE
Immigrants from Panama
Hungarian
Self-Care Disability
Self-Care Disability Comparison
Immigrants from Panama
Hungarians
2.6%
SELF-CARE DISABILITY
1.2/ 100
METRIC RATING
239th/ 347
METRIC RANK
2.5%
SELF-CARE DISABILITY
45.5/ 100
METRIC RATING
179th/ 347
METRIC RANK
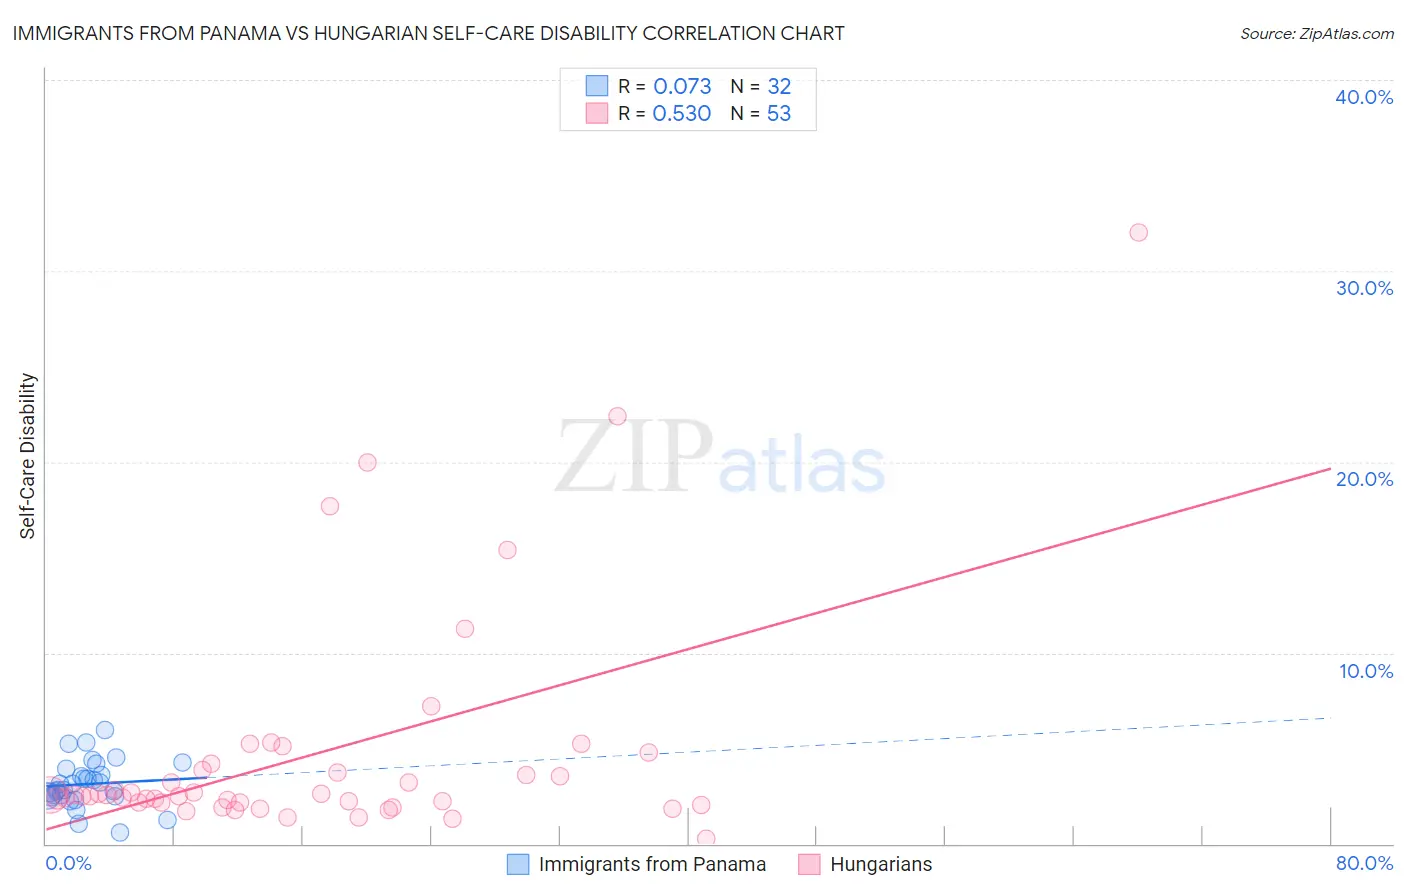
Immigrants from Panama vs Hungarian Self-Care Disability Correlation Chart
The statistical analysis conducted on geographies consisting of 221,140,353 people shows a slight positive correlation between the proportion of Immigrants from Panama and percentage of population with self-care disability in the United States with a correlation coefficient (R) of 0.073 and weighted average of 2.6%. Similarly, the statistical analysis conducted on geographies consisting of 485,258,327 people shows a substantial positive correlation between the proportion of Hungarians and percentage of population with self-care disability in the United States with a correlation coefficient (R) of 0.530 and weighted average of 2.5%, a difference of 5.0%.
Self-Care Disability Correlation Summary
| Measurement | Immigrants from Panama | Hungarian |
| Minimum | 0.60% | 0.28% |
| Maximum | 6.0% | 32.0% |
| Range | 5.4% | 31.7% |
| Mean | 3.1% | 4.7% |
| Median | 3.0% | 2.5% |
| Interquartile 25% (IQ1) | 2.5% | 2.2% |
| Interquartile 75% (IQ3) | 3.7% | 4.0% |
| Interquartile Range (IQR) | 1.2% | 1.8% |
| Standard Deviation (Sample) | 1.2% | 6.0% |
| Standard Deviation (Population) | 1.2% | 5.9% |
Similar Demographics by Self-Care Disability
Demographics Similar to Immigrants from Panama by Self-Care Disability
In terms of self-care disability, the demographic groups most similar to Immigrants from Panama are Marshallese (2.6%, a difference of 0.030%), Senegalese (2.6%, a difference of 0.040%), Immigrants from Syria (2.6%, a difference of 0.20%), Immigrants from Senegal (2.6%, a difference of 0.31%), and Spanish (2.6%, a difference of 0.43%).
| Demographics | Rating | Rank | Self-Care Disability |
| Albanians | 2.2 /100 | #232 | Tragic 2.6% |
| Liberians | 2.1 /100 | #233 | Tragic 2.6% |
| Vietnamese | 2.1 /100 | #234 | Tragic 2.6% |
| Bahamians | 2.0 /100 | #235 | Tragic 2.6% |
| Bermudans | 1.9 /100 | #236 | Tragic 2.6% |
| Immigrants | Senegal | 1.6 /100 | #237 | Tragic 2.6% |
| Senegalese | 1.3 /100 | #238 | Tragic 2.6% |
| Immigrants | Panama | 1.2 /100 | #239 | Tragic 2.6% |
| Marshallese | 1.2 /100 | #240 | Tragic 2.6% |
| Immigrants | Syria | 1.0 /100 | #241 | Tragic 2.6% |
| Spanish | 0.8 /100 | #242 | Tragic 2.6% |
| Hawaiians | 0.8 /100 | #243 | Tragic 2.6% |
| Yuman | 0.8 /100 | #244 | Tragic 2.6% |
| Immigrants | Western Asia | 0.6 /100 | #245 | Tragic 2.6% |
| Cheyenne | 0.6 /100 | #246 | Tragic 2.6% |
Demographics Similar to Hungarians by Self-Care Disability
In terms of self-care disability, the demographic groups most similar to Hungarians are English (2.5%, a difference of 0.030%), Immigrants from Kazakhstan (2.5%, a difference of 0.060%), Immigrants from Afghanistan (2.5%, a difference of 0.10%), Immigrants from Bosnia and Herzegovina (2.5%, a difference of 0.20%), and Indonesian (2.5%, a difference of 0.21%).
| Demographics | Rating | Rank | Self-Care Disability |
| Czechoslovakians | 53.5 /100 | #172 | Average 2.5% |
| Immigrants | Burma/Myanmar | 52.8 /100 | #173 | Average 2.5% |
| Welsh | 50.0 /100 | #174 | Average 2.5% |
| Immigrants | Bosnia and Herzegovina | 49.6 /100 | #175 | Average 2.5% |
| Immigrants | Afghanistan | 47.6 /100 | #176 | Average 2.5% |
| Immigrants | Kazakhstan | 46.7 /100 | #177 | Average 2.5% |
| English | 46.2 /100 | #178 | Average 2.5% |
| Hungarians | 45.5 /100 | #179 | Average 2.5% |
| Indonesians | 41.2 /100 | #180 | Average 2.5% |
| Ghanaians | 40.4 /100 | #181 | Average 2.5% |
| Maltese | 37.5 /100 | #182 | Fair 2.5% |
| Salvadorans | 36.4 /100 | #183 | Fair 2.5% |
| Yugoslavians | 36.1 /100 | #184 | Fair 2.5% |
| Slavs | 34.3 /100 | #185 | Fair 2.5% |
| Immigrants | El Salvador | 33.0 /100 | #186 | Fair 2.5% |