Immigrants from Greece vs Asian Self-Care Disability
COMPARE
Immigrants from Greece
Asian
Self-Care Disability
Self-Care Disability Comparison
Immigrants from Greece
Asians
2.5%
SELF-CARE DISABILITY
57.3/ 100
METRIC RATING
167th/ 347
METRIC RANK
2.3%
SELF-CARE DISABILITY
99.2/ 100
METRIC RATING
71st/ 347
METRIC RANK
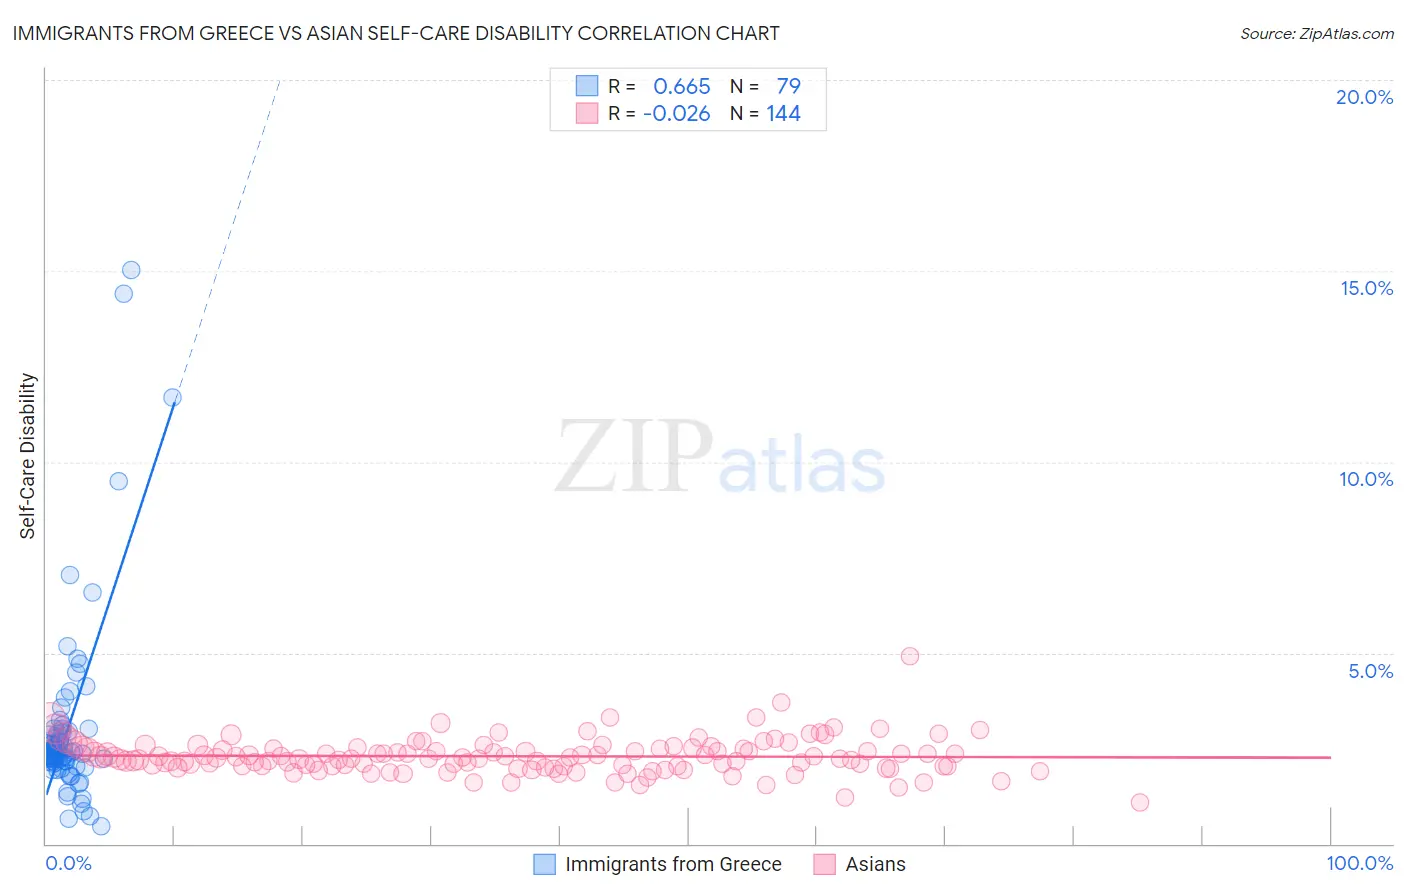
Immigrants from Greece vs Asian Self-Care Disability Correlation Chart
The statistical analysis conducted on geographies consisting of 216,801,636 people shows a significant positive correlation between the proportion of Immigrants from Greece and percentage of population with self-care disability in the United States with a correlation coefficient (R) of 0.665 and weighted average of 2.5%. Similarly, the statistical analysis conducted on geographies consisting of 549,189,639 people shows no correlation between the proportion of Asians and percentage of population with self-care disability in the United States with a correlation coefficient (R) of -0.026 and weighted average of 2.3%, a difference of 5.7%.
Self-Care Disability Correlation Summary
| Measurement | Immigrants from Greece | Asian |
| Minimum | 0.45% | 1.1% |
| Maximum | 15.0% | 4.9% |
| Range | 14.6% | 3.8% |
| Mean | 3.1% | 2.3% |
| Median | 2.4% | 2.2% |
| Interquartile 25% (IQ1) | 2.1% | 2.0% |
| Interquartile 75% (IQ3) | 2.9% | 2.5% |
| Interquartile Range (IQR) | 0.81% | 0.47% |
| Standard Deviation (Sample) | 2.5% | 0.47% |
| Standard Deviation (Population) | 2.5% | 0.47% |
Similar Demographics by Self-Care Disability
Demographics Similar to Immigrants from Greece by Self-Care Disability
In terms of self-care disability, the demographic groups most similar to Immigrants from Greece are Ute (2.5%, a difference of 0.010%), Canadian (2.5%, a difference of 0.070%), Immigrants from Somalia (2.5%, a difference of 0.070%), Syrian (2.5%, a difference of 0.080%), and Immigrants from Vietnam (2.5%, a difference of 0.10%).
| Demographics | Rating | Rank | Self-Care Disability |
| Finns | 67.0 /100 | #160 | Good 2.4% |
| Lebanese | 66.5 /100 | #161 | Good 2.4% |
| Somalis | 63.7 /100 | #162 | Good 2.5% |
| German Russians | 62.7 /100 | #163 | Good 2.5% |
| Immigrants | Vietnam | 59.3 /100 | #164 | Average 2.5% |
| Syrians | 59.0 /100 | #165 | Average 2.5% |
| Canadians | 58.8 /100 | #166 | Average 2.5% |
| Immigrants | Greece | 57.3 /100 | #167 | Average 2.5% |
| Ute | 57.1 /100 | #168 | Average 2.5% |
| Immigrants | Somalia | 55.9 /100 | #169 | Average 2.5% |
| Scottish | 54.3 /100 | #170 | Average 2.5% |
| Pennsylvania Germans | 53.5 /100 | #171 | Average 2.5% |
| Czechoslovakians | 53.5 /100 | #172 | Average 2.5% |
| Immigrants | Burma/Myanmar | 52.8 /100 | #173 | Average 2.5% |
| Welsh | 50.0 /100 | #174 | Average 2.5% |
Demographics Similar to Asians by Self-Care Disability
In terms of self-care disability, the demographic groups most similar to Asians are Eastern European (2.3%, a difference of 0.030%), Immigrants from Northern Europe (2.3%, a difference of 0.040%), Immigrants from Egypt (2.3%, a difference of 0.060%), Immigrants from Zaire (2.3%, a difference of 0.070%), and Immigrants from Norway (2.3%, a difference of 0.070%).
| Demographics | Rating | Rank | Self-Care Disability |
| Swedes | 99.3 /100 | #64 | Exceptional 2.3% |
| Brazilians | 99.3 /100 | #65 | Exceptional 2.3% |
| Immigrants | Argentina | 99.3 /100 | #66 | Exceptional 2.3% |
| South Africans | 99.3 /100 | #67 | Exceptional 2.3% |
| Immigrants | Zaire | 99.2 /100 | #68 | Exceptional 2.3% |
| Immigrants | Norway | 99.2 /100 | #69 | Exceptional 2.3% |
| Immigrants | Northern Europe | 99.2 /100 | #70 | Exceptional 2.3% |
| Asians | 99.2 /100 | #71 | Exceptional 2.3% |
| Eastern Europeans | 99.2 /100 | #72 | Exceptional 2.3% |
| Immigrants | Egypt | 99.1 /100 | #73 | Exceptional 2.3% |
| Immigrants | Switzerland | 99.1 /100 | #74 | Exceptional 2.3% |
| Immigrants | Netherlands | 99.1 /100 | #75 | Exceptional 2.3% |
| Immigrants | China | 99.1 /100 | #76 | Exceptional 2.3% |
| Immigrants | Middle Africa | 99.0 /100 | #77 | Exceptional 2.3% |
| Immigrants | Ireland | 99.0 /100 | #78 | Exceptional 2.3% |