Immigrants from Greece vs Immigrants from Western Asia Self-Care Disability
COMPARE
Immigrants from Greece
Immigrants from Western Asia
Self-Care Disability
Self-Care Disability Comparison
Immigrants from Greece
Immigrants from Western Asia
2.5%
SELF-CARE DISABILITY
57.3/ 100
METRIC RATING
167th/ 347
METRIC RANK
2.6%
SELF-CARE DISABILITY
0.6/ 100
METRIC RATING
245th/ 347
METRIC RANK
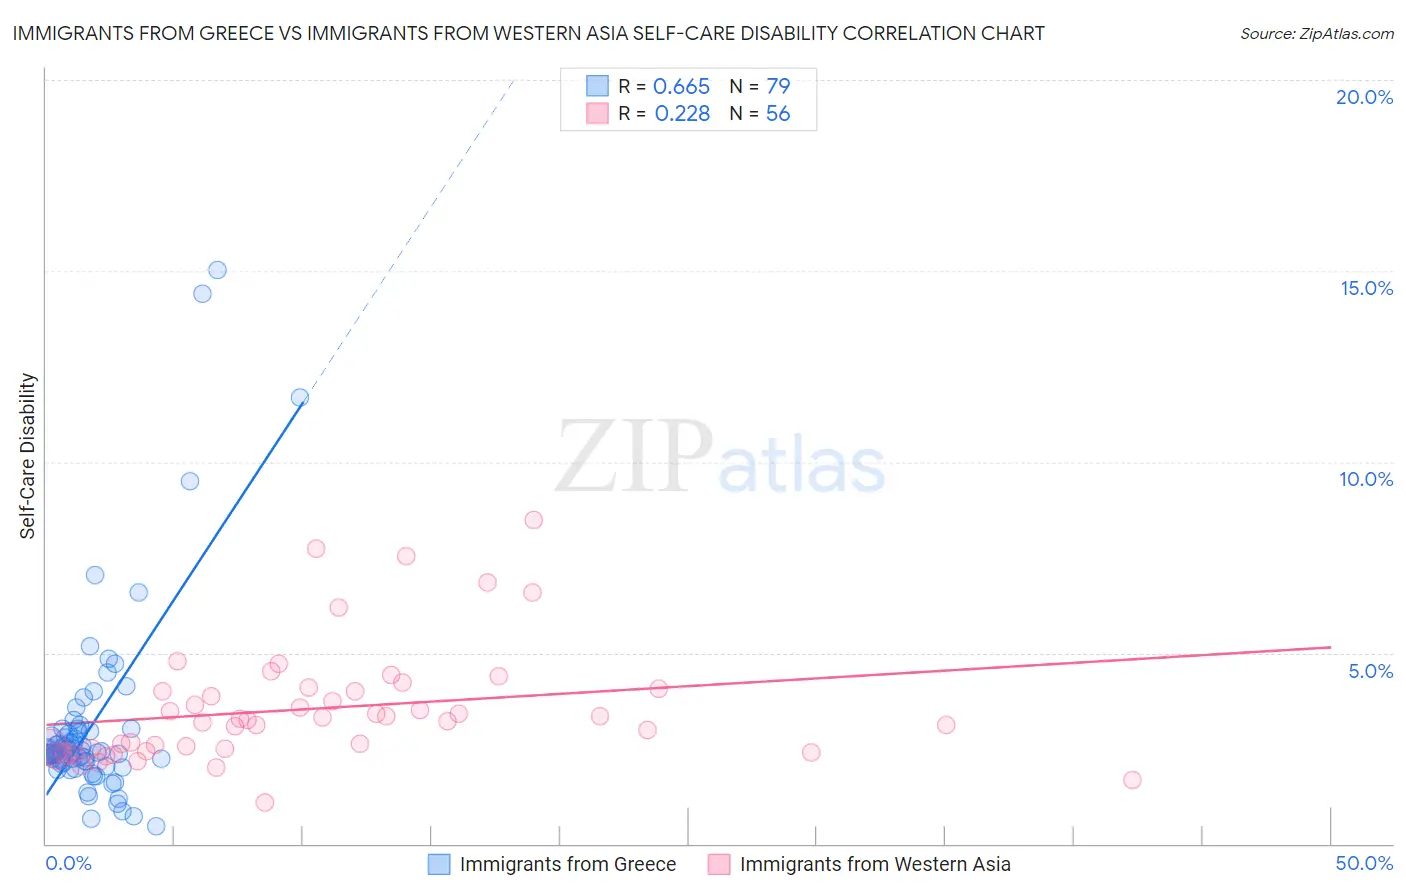
Immigrants from Greece vs Immigrants from Western Asia Self-Care Disability Correlation Chart
The statistical analysis conducted on geographies consisting of 216,801,636 people shows a significant positive correlation between the proportion of Immigrants from Greece and percentage of population with self-care disability in the United States with a correlation coefficient (R) of 0.665 and weighted average of 2.5%. Similarly, the statistical analysis conducted on geographies consisting of 403,944,060 people shows a weak positive correlation between the proportion of Immigrants from Western Asia and percentage of population with self-care disability in the United States with a correlation coefficient (R) of 0.228 and weighted average of 2.6%, a difference of 6.4%.
Self-Care Disability Correlation Summary
| Measurement | Immigrants from Greece | Immigrants from Western Asia |
| Minimum | 0.45% | 1.1% |
| Maximum | 15.0% | 8.5% |
| Range | 14.6% | 7.4% |
| Mean | 3.1% | 3.5% |
| Median | 2.4% | 3.3% |
| Interquartile 25% (IQ1) | 2.1% | 2.5% |
| Interquartile 75% (IQ3) | 2.9% | 4.0% |
| Interquartile Range (IQR) | 0.81% | 1.5% |
| Standard Deviation (Sample) | 2.5% | 1.5% |
| Standard Deviation (Population) | 2.5% | 1.5% |
Similar Demographics by Self-Care Disability
Demographics Similar to Immigrants from Greece by Self-Care Disability
In terms of self-care disability, the demographic groups most similar to Immigrants from Greece are Ute (2.5%, a difference of 0.010%), Canadian (2.5%, a difference of 0.070%), Immigrants from Somalia (2.5%, a difference of 0.070%), Syrian (2.5%, a difference of 0.080%), and Immigrants from Vietnam (2.5%, a difference of 0.10%).
| Demographics | Rating | Rank | Self-Care Disability |
| Finns | 67.0 /100 | #160 | Good 2.4% |
| Lebanese | 66.5 /100 | #161 | Good 2.4% |
| Somalis | 63.7 /100 | #162 | Good 2.5% |
| German Russians | 62.7 /100 | #163 | Good 2.5% |
| Immigrants | Vietnam | 59.3 /100 | #164 | Average 2.5% |
| Syrians | 59.0 /100 | #165 | Average 2.5% |
| Canadians | 58.8 /100 | #166 | Average 2.5% |
| Immigrants | Greece | 57.3 /100 | #167 | Average 2.5% |
| Ute | 57.1 /100 | #168 | Average 2.5% |
| Immigrants | Somalia | 55.9 /100 | #169 | Average 2.5% |
| Scottish | 54.3 /100 | #170 | Average 2.5% |
| Pennsylvania Germans | 53.5 /100 | #171 | Average 2.5% |
| Czechoslovakians | 53.5 /100 | #172 | Average 2.5% |
| Immigrants | Burma/Myanmar | 52.8 /100 | #173 | Average 2.5% |
| Welsh | 50.0 /100 | #174 | Average 2.5% |
Demographics Similar to Immigrants from Western Asia by Self-Care Disability
In terms of self-care disability, the demographic groups most similar to Immigrants from Western Asia are Cheyenne (2.6%, a difference of 0.020%), Immigrants from Albania (2.6%, a difference of 0.15%), Nicaraguan (2.6%, a difference of 0.15%), Yuman (2.6%, a difference of 0.19%), and Hawaiian (2.6%, a difference of 0.23%).
| Demographics | Rating | Rank | Self-Care Disability |
| Senegalese | 1.3 /100 | #238 | Tragic 2.6% |
| Immigrants | Panama | 1.2 /100 | #239 | Tragic 2.6% |
| Marshallese | 1.2 /100 | #240 | Tragic 2.6% |
| Immigrants | Syria | 1.0 /100 | #241 | Tragic 2.6% |
| Spanish | 0.8 /100 | #242 | Tragic 2.6% |
| Hawaiians | 0.8 /100 | #243 | Tragic 2.6% |
| Yuman | 0.8 /100 | #244 | Tragic 2.6% |
| Immigrants | Western Asia | 0.6 /100 | #245 | Tragic 2.6% |
| Cheyenne | 0.6 /100 | #246 | Tragic 2.6% |
| Immigrants | Albania | 0.6 /100 | #247 | Tragic 2.6% |
| Nicaraguans | 0.6 /100 | #248 | Tragic 2.6% |
| Mexican American Indians | 0.5 /100 | #249 | Tragic 2.6% |
| Portuguese | 0.4 /100 | #250 | Tragic 2.6% |
| Immigrants | Liberia | 0.4 /100 | #251 | Tragic 2.6% |
| Immigrants | Bangladesh | 0.4 /100 | #252 | Tragic 2.6% |