Immigrants from Greece vs Vietnamese Self-Care Disability
COMPARE
Immigrants from Greece
Vietnamese
Self-Care Disability
Self-Care Disability Comparison
Immigrants from Greece
Vietnamese
2.5%
SELF-CARE DISABILITY
57.3/ 100
METRIC RATING
167th/ 347
METRIC RANK
2.6%
SELF-CARE DISABILITY
2.1/ 100
METRIC RATING
234th/ 347
METRIC RANK
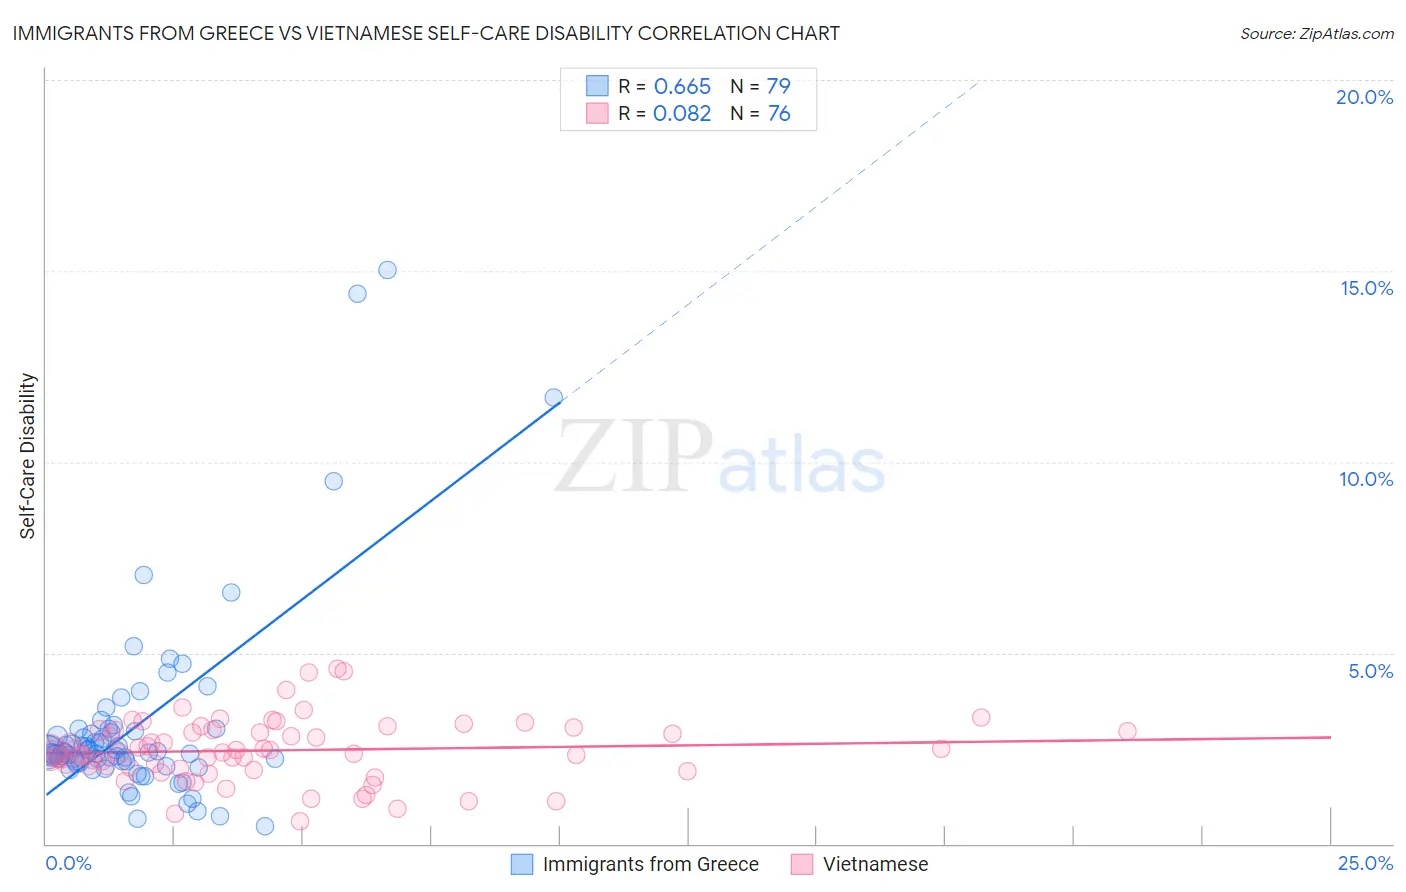
Immigrants from Greece vs Vietnamese Self-Care Disability Correlation Chart
The statistical analysis conducted on geographies consisting of 216,801,636 people shows a significant positive correlation between the proportion of Immigrants from Greece and percentage of population with self-care disability in the United States with a correlation coefficient (R) of 0.665 and weighted average of 2.5%. Similarly, the statistical analysis conducted on geographies consisting of 170,626,473 people shows a slight positive correlation between the proportion of Vietnamese and percentage of population with self-care disability in the United States with a correlation coefficient (R) of 0.082 and weighted average of 2.6%, a difference of 5.0%.
Self-Care Disability Correlation Summary
| Measurement | Immigrants from Greece | Vietnamese |
| Minimum | 0.45% | 0.58% |
| Maximum | 15.0% | 4.6% |
| Range | 14.6% | 4.0% |
| Mean | 3.1% | 2.4% |
| Median | 2.4% | 2.4% |
| Interquartile 25% (IQ1) | 2.1% | 2.0% |
| Interquartile 75% (IQ3) | 2.9% | 3.0% |
| Interquartile Range (IQR) | 0.81% | 0.99% |
| Standard Deviation (Sample) | 2.5% | 0.82% |
| Standard Deviation (Population) | 2.5% | 0.81% |
Similar Demographics by Self-Care Disability
Demographics Similar to Immigrants from Greece by Self-Care Disability
In terms of self-care disability, the demographic groups most similar to Immigrants from Greece are Ute (2.5%, a difference of 0.010%), Canadian (2.5%, a difference of 0.070%), Immigrants from Somalia (2.5%, a difference of 0.070%), Syrian (2.5%, a difference of 0.080%), and Immigrants from Vietnam (2.5%, a difference of 0.10%).
| Demographics | Rating | Rank | Self-Care Disability |
| Finns | 67.0 /100 | #160 | Good 2.4% |
| Lebanese | 66.5 /100 | #161 | Good 2.4% |
| Somalis | 63.7 /100 | #162 | Good 2.5% |
| German Russians | 62.7 /100 | #163 | Good 2.5% |
| Immigrants | Vietnam | 59.3 /100 | #164 | Average 2.5% |
| Syrians | 59.0 /100 | #165 | Average 2.5% |
| Canadians | 58.8 /100 | #166 | Average 2.5% |
| Immigrants | Greece | 57.3 /100 | #167 | Average 2.5% |
| Ute | 57.1 /100 | #168 | Average 2.5% |
| Immigrants | Somalia | 55.9 /100 | #169 | Average 2.5% |
| Scottish | 54.3 /100 | #170 | Average 2.5% |
| Pennsylvania Germans | 53.5 /100 | #171 | Average 2.5% |
| Czechoslovakians | 53.5 /100 | #172 | Average 2.5% |
| Immigrants | Burma/Myanmar | 52.8 /100 | #173 | Average 2.5% |
| Welsh | 50.0 /100 | #174 | Average 2.5% |
Demographics Similar to Vietnamese by Self-Care Disability
In terms of self-care disability, the demographic groups most similar to Vietnamese are Liberian (2.6%, a difference of 0.010%), Bahamian (2.6%, a difference of 0.040%), Albanian (2.6%, a difference of 0.050%), Immigrants from Guatemala (2.6%, a difference of 0.070%), and Bermudan (2.6%, a difference of 0.10%).
| Demographics | Rating | Rank | Self-Care Disability |
| Immigrants | Philippines | 2.7 /100 | #227 | Tragic 2.6% |
| Guatemalans | 2.7 /100 | #228 | Tragic 2.6% |
| Guamanians/Chamorros | 2.5 /100 | #229 | Tragic 2.6% |
| Immigrants | Ecuador | 2.5 /100 | #230 | Tragic 2.6% |
| Immigrants | Guatemala | 2.2 /100 | #231 | Tragic 2.6% |
| Albanians | 2.2 /100 | #232 | Tragic 2.6% |
| Liberians | 2.1 /100 | #233 | Tragic 2.6% |
| Vietnamese | 2.1 /100 | #234 | Tragic 2.6% |
| Bahamians | 2.0 /100 | #235 | Tragic 2.6% |
| Bermudans | 1.9 /100 | #236 | Tragic 2.6% |
| Immigrants | Senegal | 1.6 /100 | #237 | Tragic 2.6% |
| Senegalese | 1.3 /100 | #238 | Tragic 2.6% |
| Immigrants | Panama | 1.2 /100 | #239 | Tragic 2.6% |
| Marshallese | 1.2 /100 | #240 | Tragic 2.6% |
| Immigrants | Syria | 1.0 /100 | #241 | Tragic 2.6% |