Immigrants from Eastern Africa vs Soviet Union Self-Care Disability
COMPARE
Immigrants from Eastern Africa
Soviet Union
Self-Care Disability
Self-Care Disability Comparison
Immigrants from Eastern Africa
Soviet Union
2.3%
SELF-CARE DISABILITY
99.9/ 100
METRIC RATING
38th/ 347
METRIC RANK
2.5%
SELF-CARE DISABILITY
22.2/ 100
METRIC RATING
192nd/ 347
METRIC RANK
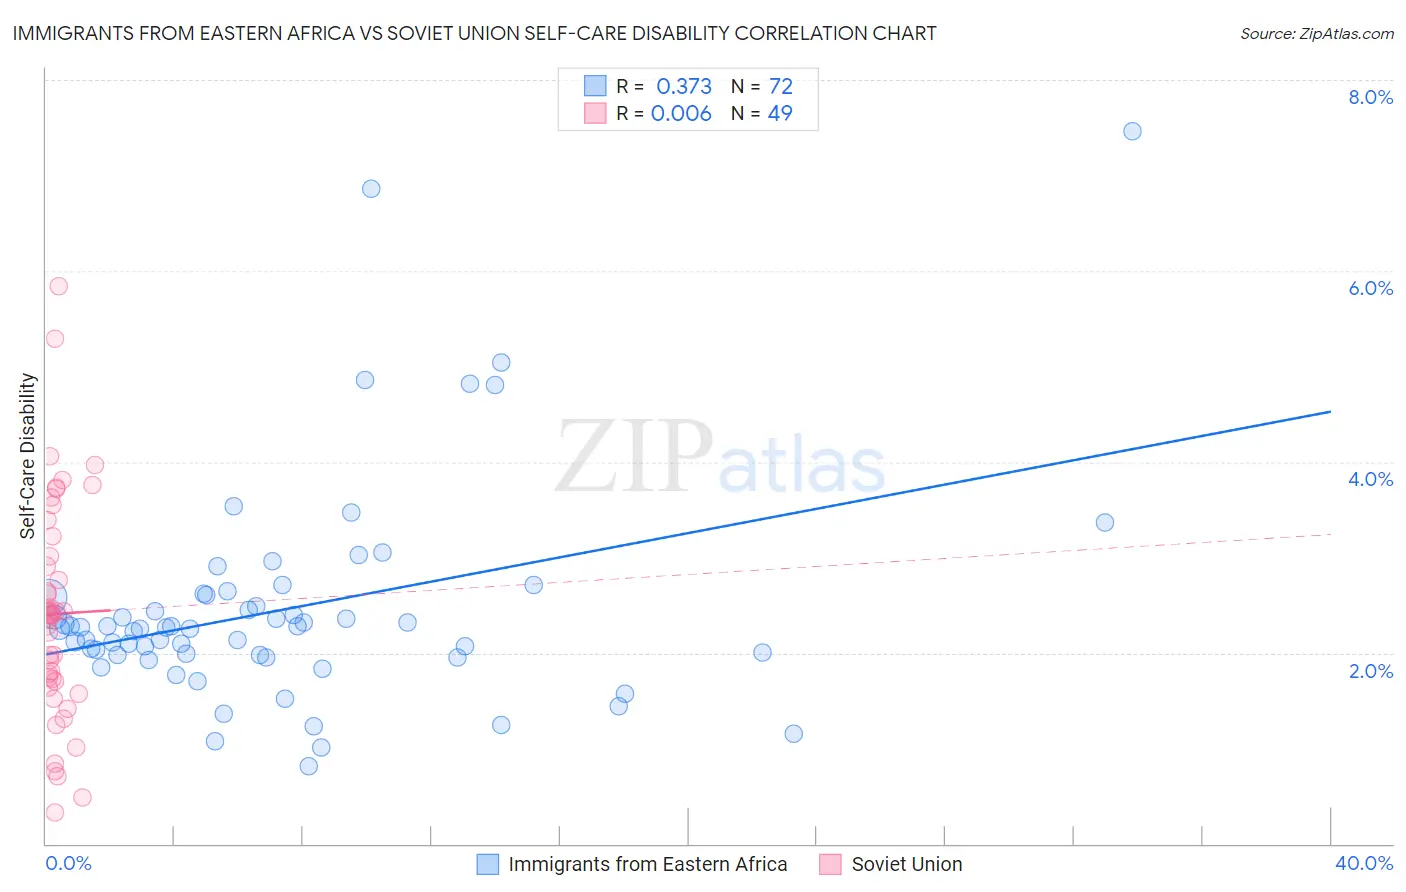
Immigrants from Eastern Africa vs Soviet Union Self-Care Disability Correlation Chart
The statistical analysis conducted on geographies consisting of 354,752,249 people shows a mild positive correlation between the proportion of Immigrants from Eastern Africa and percentage of population with self-care disability in the United States with a correlation coefficient (R) of 0.373 and weighted average of 2.3%. Similarly, the statistical analysis conducted on geographies consisting of 43,492,822 people shows no correlation between the proportion of Soviet Union and percentage of population with self-care disability in the United States with a correlation coefficient (R) of 0.006 and weighted average of 2.5%, a difference of 10.1%.
Self-Care Disability Correlation Summary
| Measurement | Immigrants from Eastern Africa | Soviet Union |
| Minimum | 0.81% | 0.32% |
| Maximum | 7.5% | 5.8% |
| Range | 6.7% | 5.5% |
| Mean | 2.5% | 2.4% |
| Median | 2.3% | 2.4% |
| Interquartile 25% (IQ1) | 2.0% | 1.7% |
| Interquartile 75% (IQ3) | 2.6% | 3.1% |
| Interquartile Range (IQR) | 0.61% | 1.5% |
| Standard Deviation (Sample) | 1.1% | 1.2% |
| Standard Deviation (Population) | 1.1% | 1.1% |
Similar Demographics by Self-Care Disability
Demographics Similar to Immigrants from Eastern Africa by Self-Care Disability
In terms of self-care disability, the demographic groups most similar to Immigrants from Eastern Africa are Immigrants from Bulgaria (2.3%, a difference of 0.10%), Immigrants from Sweden (2.3%, a difference of 0.13%), Iranian (2.3%, a difference of 0.15%), Immigrants from Sudan (2.3%, a difference of 0.22%), and Immigrants from Lithuania (2.3%, a difference of 0.30%).
| Demographics | Rating | Rank | Self-Care Disability |
| Danes | 99.9 /100 | #31 | Exceptional 2.3% |
| Burmese | 99.9 /100 | #32 | Exceptional 2.3% |
| Immigrants | Korea | 99.9 /100 | #33 | Exceptional 2.3% |
| Immigrants | Turkey | 99.9 /100 | #34 | Exceptional 2.3% |
| Immigrants | Australia | 99.9 /100 | #35 | Exceptional 2.3% |
| Immigrants | Lithuania | 99.9 /100 | #36 | Exceptional 2.3% |
| Immigrants | Sweden | 99.9 /100 | #37 | Exceptional 2.3% |
| Immigrants | Eastern Africa | 99.9 /100 | #38 | Exceptional 2.3% |
| Immigrants | Bulgaria | 99.8 /100 | #39 | Exceptional 2.3% |
| Iranians | 99.8 /100 | #40 | Exceptional 2.3% |
| Immigrants | Sudan | 99.8 /100 | #41 | Exceptional 2.3% |
| Immigrants | Uganda | 99.8 /100 | #42 | Exceptional 2.3% |
| Immigrants | Pakistan | 99.8 /100 | #43 | Exceptional 2.3% |
| Immigrants | South Africa | 99.8 /100 | #44 | Exceptional 2.3% |
| Norwegians | 99.8 /100 | #45 | Exceptional 2.3% |
Demographics Similar to Soviet Union by Self-Care Disability
In terms of self-care disability, the demographic groups most similar to Soviet Union are Moroccan (2.5%, a difference of 0.050%), Ukrainian (2.5%, a difference of 0.060%), Sioux (2.5%, a difference of 0.16%), Immigrants from Germany (2.5%, a difference of 0.32%), and Immigrants from Eastern Europe (2.5%, a difference of 0.36%).
| Demographics | Rating | Rank | Self-Care Disability |
| Slavs | 34.3 /100 | #185 | Fair 2.5% |
| Immigrants | El Salvador | 33.0 /100 | #186 | Fair 2.5% |
| Irish | 28.7 /100 | #187 | Fair 2.5% |
| Immigrants | Oceania | 28.3 /100 | #188 | Fair 2.5% |
| Immigrants | Eastern Europe | 28.0 /100 | #189 | Fair 2.5% |
| Sioux | 24.6 /100 | #190 | Fair 2.5% |
| Moroccans | 22.9 /100 | #191 | Fair 2.5% |
| Soviet Union | 22.2 /100 | #192 | Fair 2.5% |
| Ukrainians | 21.4 /100 | #193 | Fair 2.5% |
| Immigrants | Germany | 17.9 /100 | #194 | Poor 2.5% |
| Immigrants | Southern Europe | 15.6 /100 | #195 | Poor 2.5% |
| Koreans | 15.5 /100 | #196 | Poor 2.5% |
| Crow | 15.2 /100 | #197 | Poor 2.5% |
| Immigrants | Immigrants | 15.0 /100 | #198 | Poor 2.5% |
| Immigrants | Ghana | 14.7 /100 | #199 | Poor 2.5% |