Hopi vs Somali Self-Care Disability
COMPARE
Hopi
Somali
Self-Care Disability
Self-Care Disability Comparison
Hopi
Somalis
2.9%
SELF-CARE DISABILITY
0.0/ 100
METRIC RATING
328th/ 347
METRIC RANK
2.5%
SELF-CARE DISABILITY
63.7/ 100
METRIC RATING
162nd/ 347
METRIC RANK
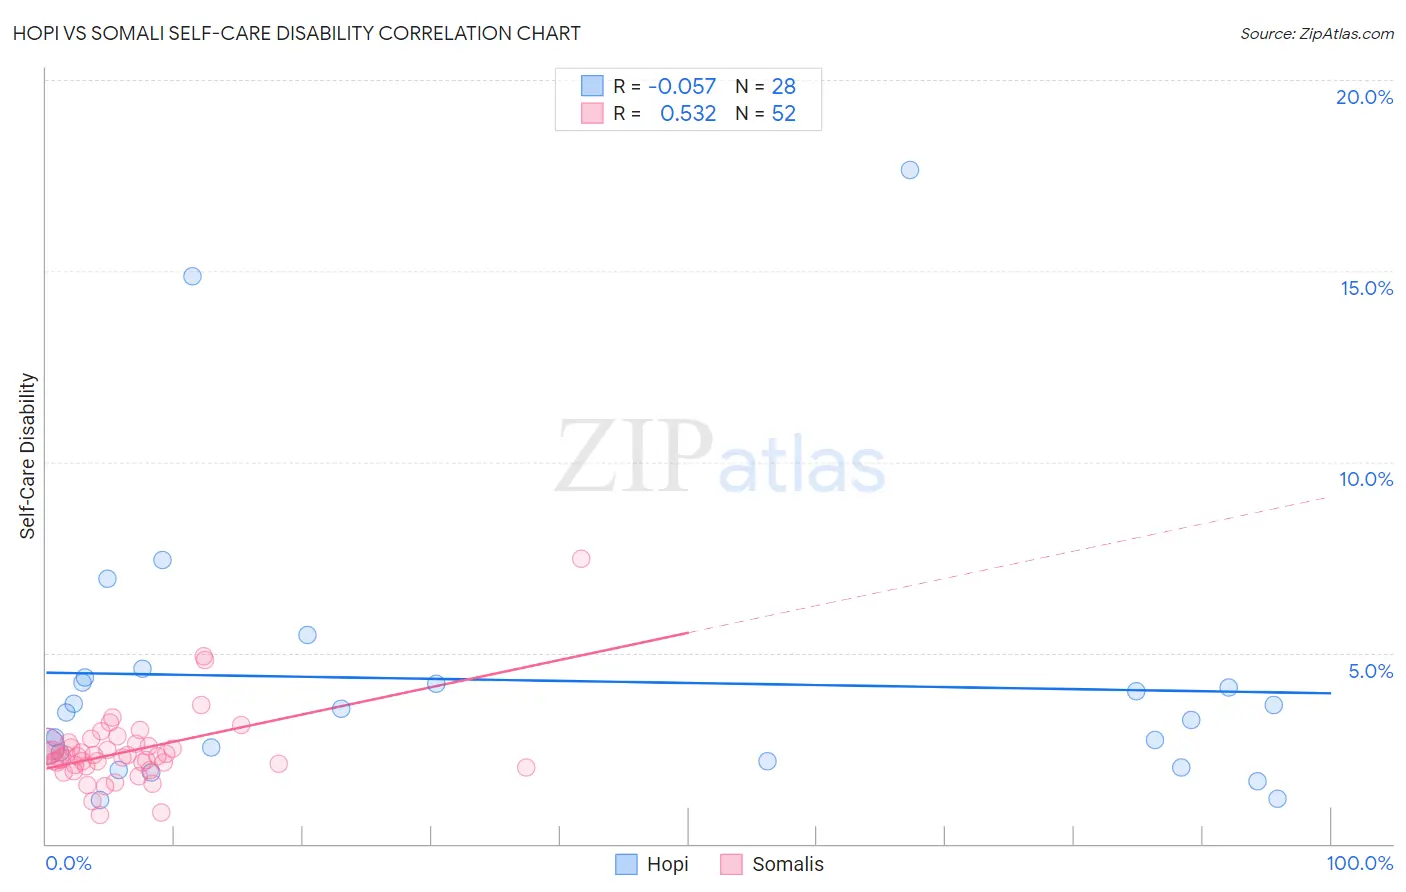
Hopi vs Somali Self-Care Disability Correlation Chart
The statistical analysis conducted on geographies consisting of 74,708,657 people shows a slight negative correlation between the proportion of Hopi and percentage of population with self-care disability in the United States with a correlation coefficient (R) of -0.057 and weighted average of 2.9%. Similarly, the statistical analysis conducted on geographies consisting of 99,258,512 people shows a substantial positive correlation between the proportion of Somalis and percentage of population with self-care disability in the United States with a correlation coefficient (R) of 0.532 and weighted average of 2.5%, a difference of 19.8%.
Self-Care Disability Correlation Summary
| Measurement | Hopi | Somali |
| Minimum | 1.2% | 0.74% |
| Maximum | 17.6% | 7.5% |
| Range | 16.5% | 6.7% |
| Mean | 4.3% | 2.4% |
| Median | 3.5% | 2.3% |
| Interquartile 25% (IQ1) | 2.3% | 2.0% |
| Interquartile 75% (IQ3) | 4.3% | 2.6% |
| Interquartile Range (IQR) | 2.0% | 0.54% |
| Standard Deviation (Sample) | 3.7% | 1.0% |
| Standard Deviation (Population) | 3.7% | 1.0% |
Similar Demographics by Self-Care Disability
Demographics Similar to Hopi by Self-Care Disability
In terms of self-care disability, the demographic groups most similar to Hopi are Cajun (2.9%, a difference of 0.21%), Black/African American (2.9%, a difference of 0.39%), Paiute (2.9%, a difference of 0.45%), Nepalese (3.0%, a difference of 0.96%), and Lumbee (3.0%, a difference of 1.1%).
| Demographics | Rating | Rank | Self-Care Disability |
| Navajo | 0.0 /100 | #321 | Tragic 2.9% |
| Comanche | 0.0 /100 | #322 | Tragic 2.9% |
| Seminole | 0.0 /100 | #323 | Tragic 2.9% |
| Cherokee | 0.0 /100 | #324 | Tragic 2.9% |
| Immigrants | Uzbekistan | 0.0 /100 | #325 | Tragic 2.9% |
| Paiute | 0.0 /100 | #326 | Tragic 2.9% |
| Blacks/African Americans | 0.0 /100 | #327 | Tragic 2.9% |
| Hopi | 0.0 /100 | #328 | Tragic 2.9% |
| Cajuns | 0.0 /100 | #329 | Tragic 2.9% |
| Nepalese | 0.0 /100 | #330 | Tragic 3.0% |
| Lumbee | 0.0 /100 | #331 | Tragic 3.0% |
| Kiowa | 0.0 /100 | #332 | Tragic 3.0% |
| Dutch West Indians | 0.0 /100 | #333 | Tragic 3.0% |
| Houma | 0.0 /100 | #334 | Tragic 3.0% |
| Immigrants | Azores | 0.0 /100 | #335 | Tragic 3.0% |
Demographics Similar to Somalis by Self-Care Disability
In terms of self-care disability, the demographic groups most similar to Somalis are German Russian (2.5%, a difference of 0.050%), Lebanese (2.4%, a difference of 0.14%), Finnish (2.4%, a difference of 0.17%), Immigrants from Vietnam (2.5%, a difference of 0.23%), and Syrian (2.5%, a difference of 0.24%).
| Demographics | Rating | Rank | Self-Care Disability |
| Pakistanis | 71.4 /100 | #155 | Good 2.4% |
| Nigerians | 70.6 /100 | #156 | Good 2.4% |
| Immigrants | Europe | 69.6 /100 | #157 | Good 2.4% |
| Immigrants | Western Europe | 68.6 /100 | #158 | Good 2.4% |
| Immigrants | Italy | 68.5 /100 | #159 | Good 2.4% |
| Finns | 67.0 /100 | #160 | Good 2.4% |
| Lebanese | 66.5 /100 | #161 | Good 2.4% |
| Somalis | 63.7 /100 | #162 | Good 2.5% |
| German Russians | 62.7 /100 | #163 | Good 2.5% |
| Immigrants | Vietnam | 59.3 /100 | #164 | Average 2.5% |
| Syrians | 59.0 /100 | #165 | Average 2.5% |
| Canadians | 58.8 /100 | #166 | Average 2.5% |
| Immigrants | Greece | 57.3 /100 | #167 | Average 2.5% |
| Ute | 57.1 /100 | #168 | Average 2.5% |
| Immigrants | Somalia | 55.9 /100 | #169 | Average 2.5% |