French American Indian vs Chickasaw Self-Care Disability
COMPARE
French American Indian
Chickasaw
Self-Care Disability
Self-Care Disability Comparison
French American Indians
Chickasaw
2.7%
SELF-CARE DISABILITY
0.0/ 100
METRIC RATING
286th/ 347
METRIC RANK
2.9%
SELF-CARE DISABILITY
0.0/ 100
METRIC RATING
320th/ 347
METRIC RANK
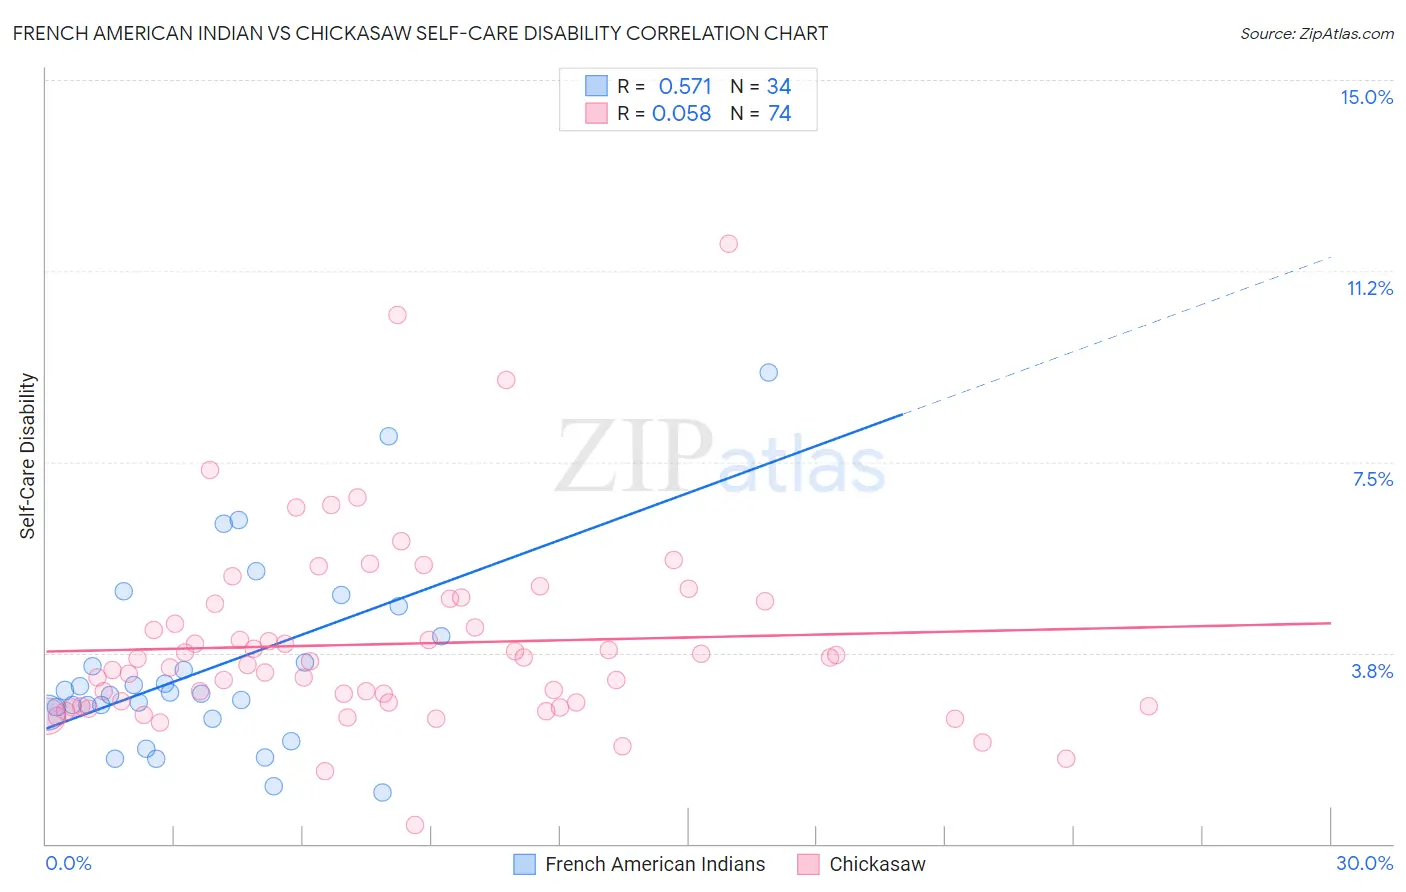
French American Indian vs Chickasaw Self-Care Disability Correlation Chart
The statistical analysis conducted on geographies consisting of 131,926,488 people shows a substantial positive correlation between the proportion of French American Indians and percentage of population with self-care disability in the United States with a correlation coefficient (R) of 0.571 and weighted average of 2.7%. Similarly, the statistical analysis conducted on geographies consisting of 147,605,375 people shows a slight positive correlation between the proportion of Chickasaw and percentage of population with self-care disability in the United States with a correlation coefficient (R) of 0.058 and weighted average of 2.9%, a difference of 5.3%.
Self-Care Disability Correlation Summary
| Measurement | French American Indian | Chickasaw |
| Minimum | 1.0% | 0.38% |
| Maximum | 9.3% | 11.8% |
| Range | 8.2% | 11.4% |
| Mean | 3.5% | 3.9% |
| Median | 3.0% | 3.5% |
| Interquartile 25% (IQ1) | 2.6% | 2.7% |
| Interquartile 75% (IQ3) | 4.1% | 4.7% |
| Interquartile Range (IQR) | 1.5% | 2.0% |
| Standard Deviation (Sample) | 1.8% | 1.9% |
| Standard Deviation (Population) | 1.8% | 1.9% |
Similar Demographics by Self-Care Disability
Demographics Similar to French American Indians by Self-Care Disability
In terms of self-care disability, the demographic groups most similar to French American Indians are Immigrants from Jamaica (2.7%, a difference of 0.33%), Immigrants from Barbados (2.7%, a difference of 0.37%), African (2.7%, a difference of 0.47%), Jamaican (2.7%, a difference of 0.60%), and Cuban (2.7%, a difference of 0.62%).
| Demographics | Rating | Rank | Self-Care Disability |
| Iroquois | 0.1 /100 | #279 | Tragic 2.7% |
| Hispanics or Latinos | 0.1 /100 | #280 | Tragic 2.7% |
| Immigrants | Iraq | 0.0 /100 | #281 | Tragic 2.7% |
| Apache | 0.0 /100 | #282 | Tragic 2.7% |
| Delaware | 0.0 /100 | #283 | Tragic 2.7% |
| Fijians | 0.0 /100 | #284 | Tragic 2.7% |
| Jamaicans | 0.0 /100 | #285 | Tragic 2.7% |
| French American Indians | 0.0 /100 | #286 | Tragic 2.7% |
| Immigrants | Jamaica | 0.0 /100 | #287 | Tragic 2.7% |
| Immigrants | Barbados | 0.0 /100 | #288 | Tragic 2.7% |
| Africans | 0.0 /100 | #289 | Tragic 2.7% |
| Cubans | 0.0 /100 | #290 | Tragic 2.7% |
| Guyanese | 0.0 /100 | #291 | Tragic 2.7% |
| Central American Indians | 0.0 /100 | #292 | Tragic 2.7% |
| Belizeans | 0.0 /100 | #293 | Tragic 2.7% |
Demographics Similar to Chickasaw by Self-Care Disability
In terms of self-care disability, the demographic groups most similar to Chickasaw are Navajo (2.9%, a difference of 0.15%), Spanish American Indian (2.9%, a difference of 0.22%), Assyrian/Chaldean/Syriac (2.8%, a difference of 0.37%), Immigrants from Dominica (2.8%, a difference of 0.38%), and Comanche (2.9%, a difference of 0.47%).
| Demographics | Rating | Rank | Self-Care Disability |
| Spanish Americans | 0.0 /100 | #313 | Tragic 2.8% |
| Creek | 0.0 /100 | #314 | Tragic 2.8% |
| Immigrants | Cuba | 0.0 /100 | #315 | Tragic 2.8% |
| Menominee | 0.0 /100 | #316 | Tragic 2.8% |
| Immigrants | Dominica | 0.0 /100 | #317 | Tragic 2.8% |
| Assyrians/Chaldeans/Syriacs | 0.0 /100 | #318 | Tragic 2.8% |
| Spanish American Indians | 0.0 /100 | #319 | Tragic 2.9% |
| Chickasaw | 0.0 /100 | #320 | Tragic 2.9% |
| Navajo | 0.0 /100 | #321 | Tragic 2.9% |
| Comanche | 0.0 /100 | #322 | Tragic 2.9% |
| Seminole | 0.0 /100 | #323 | Tragic 2.9% |
| Cherokee | 0.0 /100 | #324 | Tragic 2.9% |
| Immigrants | Uzbekistan | 0.0 /100 | #325 | Tragic 2.9% |
| Paiute | 0.0 /100 | #326 | Tragic 2.9% |
| Blacks/African Americans | 0.0 /100 | #327 | Tragic 2.9% |