Zip Codes with the Highest Poverty Level in Delaware

RELATED REPORTS & OPTIONS

Highest Poverty
Population
Families and Households
Female Fertility
Female Fertility (Unmarried)
Race (Community Size)
Race (Percentage)
Ancestry (Community Size)
AfghanAfricanAlaska NativeAlaskan AthabascanAlbanianAleutAlsatianAmericanApacheArabArapahoArgentineanArmenianAssyrian / Chaldean / SyriacAustralianAustrianBahamianBangladeshiBarbadianBasqueBelgianBelizeanBermudanBhutaneseBlackfeetBolivianBrazilianBritishBritish West IndianBulgarianBurmeseCajunCambodianCanadianCape VerdeanCarpatho RusynCelticCentral AmericanCentral American IndianCherokeeCheyenneChickasawChileanChineseChippewaChoctawColombianColvilleComancheCosta RicanCreeCreekCroatianCrowCubanCypriotCzechCzechoslovakianDanishDelawareDominicanDutchDutch West IndianEastern EuropeanEcuadorianEgyptianEnglishEstonianEthiopianEuropeanFijianFilipinoFinnishFrenchFrench American IndianFrench CanadianGermanGerman RussianGhanaianGreekGuamanian / ChamorroGuatemalanGuyaneseHaitianHmongHonduranHopiHoumaHungarianIcelanderIndian (Asian)IndonesianInupiatIranianIraqiIrishIroquoisIsraeliItalianJamaicanJapaneseJordanianKenyanKiowaKoreanLaotianLatvianLebaneseLiberianLithuanianLumbeeLuxembourgerMacedonianMalaysianMalteseMarshalleseMenomineeMexicanMexican American IndianMongolianMoroccanNative HawaiianNavajoNepaleseNew ZealanderNicaraguanNigerianNorthern EuropeanNorwegianOkinawanOsageOttawaPaiutePakistaniPalestinianPanamanianParaguayanPennsylvania GermanPeruvianPimaPolishPortuguesePotawatomiPuebloPuerto RicanPuget Sound SalishRomanianRussianSalvadoranSamoanScandinavianScotch-IrishScottishSeminoleSenegaleseSerbianShoshoneSierra LeoneanSiouxSlavicSlovakSloveneSomaliSouth AfricanSouth AmericanSouth American IndianSoviet UnionSpaniardSpanishSpanish AmericanSpanish American IndianSri LankanSubsaharan AfricanSudaneseSwedishSwissSyrianTaiwaneseThaiTlingit-HaidaTohono O'OdhamTonganTrinidadian and TobagonianTsimshianTurkishU.S. Virgin IslanderUgandanUkrainianUruguayanUteVenezuelanVietnameseWelshWest IndianYakamaYaquiYugoslavianYumanYup'ikZimbabwean
Ancestry (Percentage)
AfghanAfricanAlaska NativeAlaskan AthabascanAlbanianAleutAlsatianAmericanApacheArabArapahoArgentineanArmenianAssyrian / Chaldean / SyriacAustralianAustrianBahamianBangladeshiBarbadianBasqueBelgianBelizeanBermudanBhutaneseBlackfeetBolivianBrazilianBritishBritish West IndianBulgarianBurmeseCajunCambodianCanadianCape VerdeanCarpatho RusynCelticCentral AmericanCentral American IndianCherokeeCheyenneChickasawChileanChineseChippewaChoctawColombianColvilleComancheCosta RicanCreeCreekCroatianCrowCubanCypriotCzechCzechoslovakianDanishDelawareDominicanDutchDutch West IndianEastern EuropeanEcuadorianEgyptianEnglishEstonianEthiopianEuropeanFijianFilipinoFinnishFrenchFrench American IndianFrench CanadianGermanGerman RussianGhanaianGreekGuamanian / ChamorroGuatemalanGuyaneseHaitianHmongHonduranHopiHoumaHungarianIcelanderIndian (Asian)IndonesianInupiatIranianIraqiIrishIroquoisIsraeliItalianJamaicanJapaneseJordanianKenyanKiowaKoreanLaotianLatvianLebaneseLiberianLithuanianLumbeeLuxembourgerMacedonianMalaysianMalteseMarshalleseMenomineeMexicanMexican American IndianMongolianMoroccanNative HawaiianNavajoNepaleseNew ZealanderNicaraguanNigerianNorthern EuropeanNorwegianOkinawanOsageOttawaPaiutePakistaniPalestinianPanamanianParaguayanPennsylvania GermanPeruvianPimaPolishPortuguesePotawatomiPuebloPuerto RicanPuget Sound SalishRomanianRussianSalvadoranSamoanScandinavianScotch-IrishScottishSeminoleSenegaleseSerbianShoshoneSierra LeoneanSiouxSlavicSlovakSloveneSomaliSouth AfricanSouth AmericanSouth American IndianSoviet UnionSpaniardSpanishSpanish AmericanSpanish American IndianSri LankanSubsaharan AfricanSudaneseSwedishSwissSyrianTaiwaneseThaiTlingit-HaidaTohono O'OdhamTonganTrinidadian and TobagonianTsimshianTurkishU.S. Virgin IslanderUgandanUkrainianUruguayanUteVenezuelanVietnameseWelshWest IndianYakamaYaquiYugoslavianYumanYup'ikZimbabwean
Immigrant Origin (Total)
AfghanistanAfricaAlbaniaArgentinaArmeniaAsiaAustraliaAustriaAzoresBahamasBangladeshBarbadosBelarusBelgiumBelizeBoliviaBosnia and HerzegovinaBrazilBulgariaBurma / MyanmarCabo VerdeCambodiaCameroonCanadaCaribbeanCentral AmericaChileChinaColombiaCongoCosta RicaCroatiaCubaCzechoslovakiaDenmarkDominicaDominican RepublicEastern AfricaEastern AsiaEastern EuropeEcuadorEgyptEl SalvadorEnglandEritreaEthiopiaEuropeFijiFranceGermanyGhanaGreeceGrenadaGuatemalaGuyanaHaitiHondurasHong KongHungaryIndiaIndonesiaIranIraqIrelandIsraelItalyJamaicaJapanJordanKazakhstanKenyaKoreaKuwaitLaosLatin AmericaLatviaLebanonLiberiaLithuaniaMalaysiaMexicoMicronesiaMiddle AfricaMoldovaMoroccoNepalNetherlandsNicaraguaNigeriaNorth MacedoniaNorthern AfricaNorthern EuropeNorwayOceaniaPakistanPanamaPeruPhilippinesPolandPortugalRomaniaRussiaSaudi ArabiaScotlandSenegalSerbiaSierra LeoneSingaporeSomaliaSouth AfricaSouth AmericaSouth Central AsiaSouth Eastern AsiaSouthern EuropeSpainSri LankaSt. Vincent and the GrenadinesSudanSwedenSwitzerlandSyriaTaiwanThailandTrinidad and TobagoTurkeyUgandaUkraineUruguayUzbekistanVenezuelaVietnamWest IndiesWestern AfricaWestern AsiaWestern EuropeYemenZaireZimbabwe
Immigrant Origin (Percentage)
AfghanistanAfricaAlbaniaArgentinaArmeniaAsiaAustraliaAustriaAzoresBahamasBangladeshBarbadosBelarusBelgiumBelizeBoliviaBosnia and HerzegovinaBrazilBulgariaBurma / MyanmarCabo VerdeCambodiaCameroonCanadaCaribbeanCentral AmericaChileChinaColombiaCongoCosta RicaCroatiaCubaCzechoslovakiaDenmarkDominicaDominican RepublicEastern AfricaEastern AsiaEastern EuropeEcuadorEgyptEl SalvadorEnglandEritreaEthiopiaEuropeFijiFranceGermanyGhanaGreeceGrenadaGuatemalaGuyanaHaitiHondurasHong KongHungaryIndiaIndonesiaIranIraqIrelandIsraelItalyJamaicaJapanJordanKazakhstanKenyaKoreaKuwaitLaosLatin AmericaLatviaLebanonLiberiaLithuaniaMalaysiaMexicoMicronesiaMiddle AfricaMoldovaMoroccoNepalNetherlandsNicaraguaNigeriaNorth MacedoniaNorthern AfricaNorthern EuropeNorwayOceaniaPakistanPanamaPeruPhilippinesPolandPortugalRomaniaRussiaSaudi ArabiaScotlandSenegalSerbiaSierra LeoneSingaporeSomaliaSouth AfricaSouth AmericaSouth Central AsiaSouth Eastern AsiaSouthern EuropeSpainSri LankaSt. Vincent and the GrenadinesSudanSwedenSwitzerlandSyriaTaiwanThailandTrinidad and TobagoTurkeyUgandaUkraineUruguayUzbekistanVenezuelaVietnamWest IndiesWestern AfricaWestern AsiaWestern EuropeYemenZaireZimbabwe
Income
Income (Families)
Income (Households)
Poverty
Poverty (Families)
Unemployment
Employment Occupations
Employment Industries
Employer Class
Commute Time
Commute Means
School Enrollment
Education by Degree Field
Occupancy
Finances
Physical Characteristics
Delaware
Compare Zip Codes
Comparison Subject

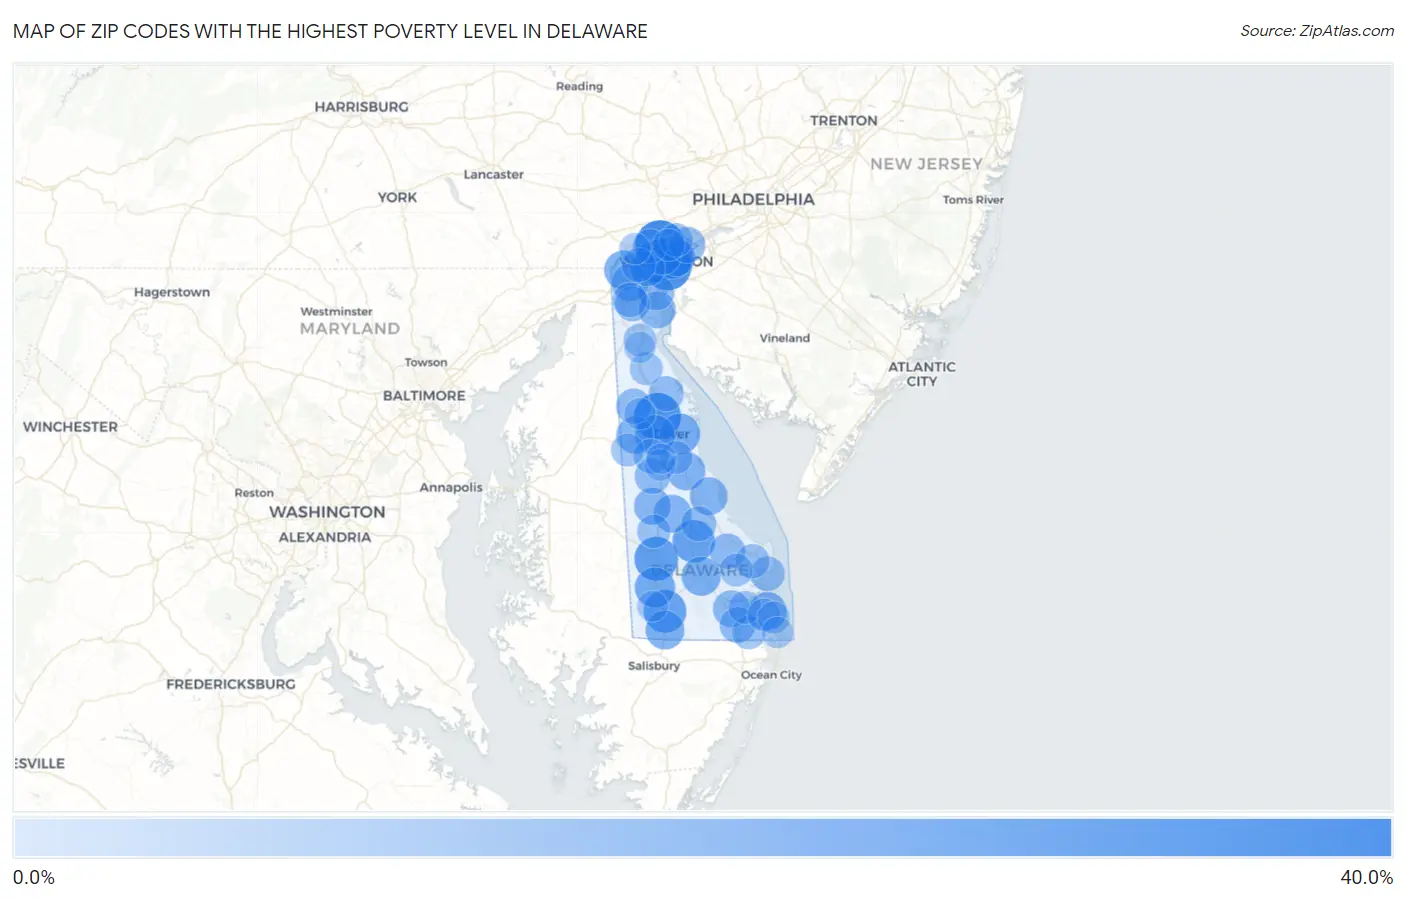
Map of Zip Codes with the Highest Poverty Level in Delaware

0.0%
40.0%
Zip Codes with the Highest Poverty Level in Delaware Map

Zip Codes with the Highest Poverty Level in Delaware

Zip Code Poverty vs State vs National
1.1973232.1%11.1%(+21.0)#112.5%(+19.6)#1,982
2.1980129.6%11.1%(+18.5)#212.5%(+17.1)#2,438
3.1993627.5%11.1%(+16.4)#312.5%(+14.9)#2,921
4.1993322.6%11.1%(+11.4)#412.5%(+10.0)#4,606
5.1980522.0%11.1%(+10.9)#512.5%(+9.45)#4,885
6.1980221.5%11.1%(+10.4)#612.5%(+8.95)#5,176
7.1995620.9%11.1%(+9.74)#712.5%(+8.33)#5,536
8.1994120.7%11.1%(+9.57)#812.5%(+8.16)#5,640
9.1990117.0%11.1%(+5.88)#912.5%(+4.47)#8,394
10.1997316.8%11.1%(+5.64)#1012.5%(+4.23)#8,621
11.1990416.3%11.1%(+5.20)#1112.5%(+3.79)#9,014
12.1994715.0%11.1%(+3.83)#1212.5%(+2.42)#10,506
13.1971114.9%11.1%(+3.82)#1312.5%(+2.41)#10,512
14.1994014.3%11.1%(+3.21)#1412.5%(+1.80)#11,208
15.1997013.7%11.1%(+2.57)#1512.5%(+1.15)#11,983
16.1994613.6%11.1%(+2.43)#1612.5%(+1.02)#12,141
17.1996312.8%11.1%(+1.68)#1712.5%(+0.272)#13,124
18.1995412.5%11.1%(+1.38)#1812.5%(-0.027)#13,549
19.1980912.3%11.1%(+1.19)#1912.5%(-0.219)#13,824
20.1980611.9%11.1%(+0.753)#2012.5%(-0.659)#14,453
21.1995311.8%11.1%(+0.727)#2112.5%(-0.685)#14,489
22.1971311.8%11.1%(+0.642)#2212.5%(-0.770)#14,615
23.1995211.4%11.1%(+0.316)#2312.5%(-1.10)#15,134
24.1970611.0%11.1%(-0.092)#2412.5%(-1.50)#15,777
25.1996610.9%11.1%(-0.260)#2512.5%(-1.67)#16,031
26.197039.7%11.1%(-1.39)#2612.5%(-2.80)#17,892
27.197209.7%11.1%(-1.45)#2712.5%(-2.87)#18,011
28.199459.3%11.1%(-1.80)#2812.5%(-3.21)#18,582
29.199689.2%11.1%(-1.96)#2912.5%(-3.38)#18,872
30.199438.9%11.1%(-2.20)#3012.5%(-3.61)#19,277
31.199388.7%11.1%(-2.42)#3112.5%(-3.83)#19,684
32.198048.4%11.1%(-2.68)#3212.5%(-4.09)#20,191
33.199778.3%11.1%(-2.84)#3312.5%(-4.25)#20,463
34.199348.2%11.1%(-2.92)#3412.5%(-4.33)#20,613
35.197018.0%11.1%(-3.11)#3512.5%(-4.52)#20,958
36.199607.9%11.1%(-3.18)#3612.5%(-4.59)#21,075
37.199717.7%11.1%(-3.45)#3712.5%(-4.86)#21,593
38.197027.5%11.1%(-3.67)#3812.5%(-5.08)#21,981
39.199587.1%11.1%(-4.05)#3912.5%(-5.46)#22,724
40.198076.9%11.1%(-4.18)#4012.5%(-5.59)#22,933
41.198086.8%11.1%(-4.32)#4112.5%(-5.73)#23,184
42.199755.8%11.1%(-5.36)#4212.5%(-6.77)#25,061
43.198105.7%11.1%(-5.42)#4312.5%(-6.83)#25,192
44.199505.6%11.1%(-5.55)#4412.5%(-6.96)#25,392
45.199394.9%11.1%(-6.21)#4512.5%(-7.62)#26,502
46.199514.9%11.1%(-6.24)#4612.5%(-7.66)#26,567
47.197344.8%11.1%(-6.29)#4712.5%(-7.71)#26,652
48.199644.8%11.1%(-6.37)#4812.5%(-7.78)#26,778
49.199624.8%11.1%(-6.37)#4912.5%(-7.78)#26,780
50.197094.7%11.1%(-6.42)#5012.5%(-7.83)#26,842
51.199674.4%11.1%(-6.73)#5112.5%(-8.14)#27,350
52.199303.6%11.1%(-7.51)#5212.5%(-8.92)#28,522
53.198033.6%11.1%(-7.54)#5312.5%(-8.95)#28,571
54.199552.6%11.1%(-8.52)#5412.5%(-9.93)#29,824
55.199442.6%11.1%(-8.55)#5512.5%(-9.96)#29,854
56.197072.5%11.1%(-8.67)#5612.5%(-10.1)#29,995
57.199792.5%11.1%(-8.67)#5712.5%(-10.1)#29,996
58.197302.0%11.1%(-9.15)#5812.5%(-10.6)#30,398
59.199311.6%11.1%(-9.53)#5912.5%(-10.9)#30,671
60.199800.66%11.1%(-10.5)#6012.5%(-11.9)#31,073

Common Questions

What are the Top 10 Zip Codes with the Highest Poverty Level in Delaware?
Top 10 Zip Codes with the Highest Poverty Level in Delaware are:
#1
32.1%
#2
29.6%
#3
27.5%
#4
22.6%
#5
22.0%
#6
21.5%
#7
20.9%
#8
20.7%
#9
17.0%
#10
16.8%
What zip code has the Highest Poverty Level in Delaware?
19732 has the Highest Poverty Level in Delaware with 32.1%.
What is the Poverty Level in the State of Delaware?
Poverty Level in Delaware is 11.1%.
What is the Poverty Level in the United States?
Poverty Level in the United States is 12.5%.