Zip Codes with the Highest Percentage of Population Employed in Health Care & Social Assistance in Delaware
RELATED REPORTS & OPTIONS
Health Care & Social Assistance
Delaware
Compare Zip Codes
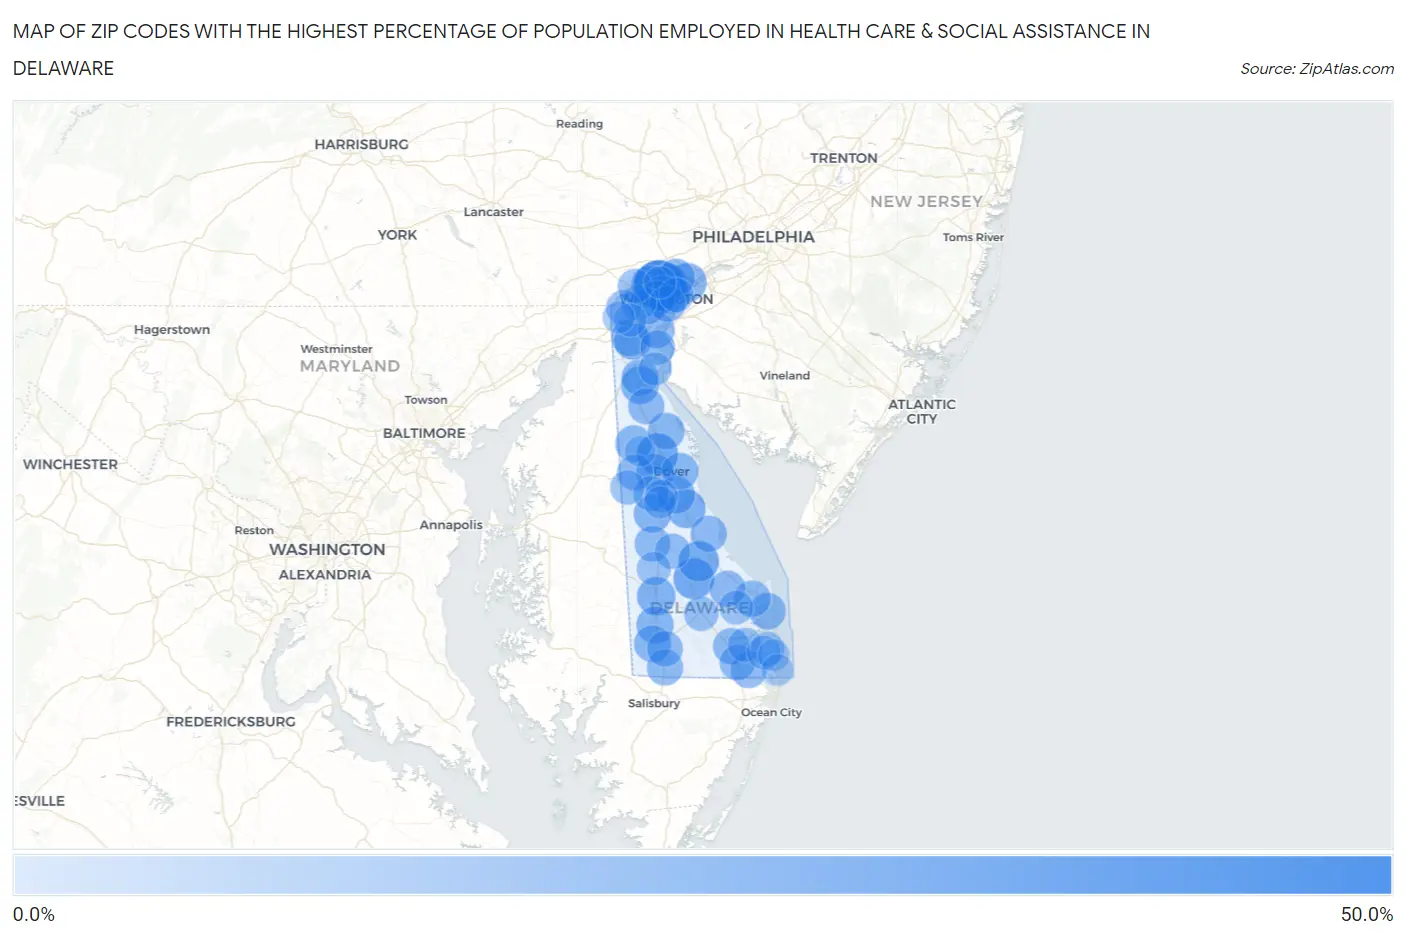
Map of Zip Codes with the Highest Percentage of Population Employed in Health Care & Social Assistance in Delaware
0.0%
50.0%
Zip Codes with the Highest Percentage of Population Employed in Health Care & Social Assistance in Delaware
| Zip Code | % Employed | vs State | vs National | |
| 1. | 19710 | 47.1% | 14.8%(+32.2)#1 | 13.9%(+33.1)#268 |
| 2. | 19936 | 26.2% | 14.8%(+11.3)#2 | 13.9%(+12.2)#1,494 |
| 3. | 19941 | 25.4% | 14.8%(+10.6)#3 | 13.9%(+11.5)#1,637 |
| 4. | 19960 | 24.5% | 14.8%(+9.71)#4 | 13.9%(+10.6)#1,850 |
| 5. | 19946 | 20.4% | 14.8%(+5.62)#5 | 13.9%(+6.51)#3,758 |
| 6. | 19703 | 20.1% | 14.8%(+5.25)#6 | 13.9%(+6.15)#4,021 |
| 7. | 19933 | 19.9% | 14.8%(+5.07)#7 | 13.9%(+5.97)#4,159 |
| 8. | 19730 | 18.7% | 14.8%(+3.87)#8 | 13.9%(+4.77)#5,310 |
| 9. | 19943 | 17.8% | 14.8%(+2.97)#9 | 13.9%(+3.86)#6,463 |
| 10. | 19803 | 17.7% | 14.8%(+2.86)#10 | 13.9%(+3.76)#6,634 |
| 11. | 19904 | 17.6% | 14.8%(+2.77)#11 | 13.9%(+3.66)#6,787 |
| 12. | 19962 | 17.6% | 14.8%(+2.75)#12 | 13.9%(+3.64)#6,817 |
| 13. | 19973 | 17.1% | 14.8%(+2.24)#13 | 13.9%(+3.13)#7,613 |
| 14. | 19802 | 17.0% | 14.8%(+2.16)#14 | 13.9%(+3.06)#7,735 |
| 15. | 19810 | 16.9% | 14.8%(+2.05)#15 | 13.9%(+2.95)#7,897 |
| 16. | 19702 | 16.7% | 14.8%(+1.91)#16 | 13.9%(+2.80)#8,140 |
| 17. | 19709 | 16.3% | 14.8%(+1.44)#17 | 13.9%(+2.33)#9,002 |
| 18. | 19938 | 16.2% | 14.8%(+1.38)#18 | 13.9%(+2.28)#9,104 |
| 19. | 19701 | 16.1% | 14.8%(+1.28)#19 | 13.9%(+2.18)#9,285 |
| 20. | 19931 | 16.0% | 14.8%(+1.13)#20 | 13.9%(+2.03)#9,565 |
| 21. | 19901 | 15.8% | 14.8%(+0.993)#21 | 13.9%(+1.89)#9,865 |
| 22. | 19977 | 15.7% | 14.8%(+0.872)#22 | 13.9%(+1.77)#10,106 |
| 23. | 19807 | 15.6% | 14.8%(+0.747)#23 | 13.9%(+1.64)#10,341 |
| 24. | 19806 | 15.5% | 14.8%(+0.681)#24 | 13.9%(+1.58)#10,490 |
| 25. | 19971 | 15.4% | 14.8%(+0.550)#25 | 13.9%(+1.45)#10,800 |
| 26. | 19805 | 15.3% | 14.8%(+0.454)#26 | 13.9%(+1.35)#11,006 |
| 27. | 19720 | 15.3% | 14.8%(+0.422)#27 | 13.9%(+1.32)#11,066 |
| 28. | 19958 | 15.2% | 14.8%(+0.334)#28 | 13.9%(+1.23)#11,268 |
| 29. | 19966 | 15.0% | 14.8%(+0.189)#29 | 13.9%(+1.09)#11,574 |
| 30. | 19804 | 15.0% | 14.8%(+0.170)#30 | 13.9%(+1.07)#11,620 |
| 31. | 19801 | 14.7% | 14.8%(-0.155)#31 | 13.9%(+0.742)#12,412 |
| 32. | 19963 | 14.6% | 14.8%(-0.243)#32 | 13.9%(+0.654)#12,620 |
| 33. | 19940 | 14.5% | 14.8%(-0.354)#33 | 13.9%(+0.543)#12,901 |
| 34. | 19734 | 14.3% | 14.8%(-0.507)#34 | 13.9%(+0.390)#13,275 |
| 35. | 19975 | 14.2% | 14.8%(-0.617)#35 | 13.9%(+0.280)#13,534 |
| 36. | 19968 | 14.1% | 14.8%(-0.766)#36 | 13.9%(+0.131)#13,902 |
| 37. | 19953 | 14.0% | 14.8%(-0.882)#37 | 13.9%(+0.015)#14,193 |
| 38. | 19952 | 13.5% | 14.8%(-1.36)#38 | 13.9%(-0.466)#15,362 |
| 39. | 19956 | 13.3% | 14.8%(-1.49)#39 | 13.9%(-0.597)#15,685 |
| 40. | 19945 | 13.3% | 14.8%(-1.53)#40 | 13.9%(-0.630)#15,778 |
| 41. | 19934 | 13.1% | 14.8%(-1.70)#41 | 13.9%(-0.803)#16,230 |
| 42. | 19954 | 12.4% | 14.8%(-2.42)#42 | 13.9%(-1.52)#18,061 |
| 43. | 19808 | 12.4% | 14.8%(-2.43)#43 | 13.9%(-1.53)#18,084 |
| 44. | 19711 | 11.7% | 14.8%(-3.15)#44 | 13.9%(-2.25)#19,755 |
| 45. | 19706 | 11.0% | 14.8%(-3.82)#45 | 13.9%(-2.92)#21,320 |
| 46. | 19707 | 10.5% | 14.8%(-4.33)#46 | 13.9%(-3.44)#22,442 |
| 47. | 19809 | 10.3% | 14.8%(-4.49)#47 | 13.9%(-3.59)#22,774 |
| 48. | 19947 | 10.1% | 14.8%(-4.69)#48 | 13.9%(-3.80)#23,153 |
| 49. | 19964 | 10.1% | 14.8%(-4.69)#49 | 13.9%(-3.80)#23,154 |
| 50. | 19939 | 9.4% | 14.8%(-5.39)#50 | 13.9%(-4.49)#24,462 |
| 51. | 19951 | 9.1% | 14.8%(-5.73)#51 | 13.9%(-4.83)#25,018 |
| 52. | 19950 | 8.9% | 14.8%(-5.91)#52 | 13.9%(-5.01)#25,276 |
| 53. | 19970 | 8.7% | 14.8%(-6.14)#53 | 13.9%(-5.25)#25,625 |
| 54. | 19967 | 8.6% | 14.8%(-6.28)#54 | 13.9%(-5.38)#25,812 |
| 55. | 19713 | 7.8% | 14.8%(-6.99)#55 | 13.9%(-6.09)#26,665 |
| 56. | 19731 | 7.5% | 14.8%(-7.33)#56 | 13.9%(-6.44)#27,007 |
| 57. | 19980 | 7.3% | 14.8%(-7.54)#57 | 13.9%(-6.64)#27,202 |
| 58. | 19979 | 5.1% | 14.8%(-9.73)#58 | 13.9%(-8.83)#29,013 |
| 59. | 19732 | 4.7% | 14.8%(-10.1)#59 | 13.9%(-9.24)#29,238 |
| 60. | 19717 | 4.6% | 14.8%(-10.2)#60 | 13.9%(-9.34)#29,300 |
| 61. | 19930 | 4.3% | 14.8%(-10.6)#61 | 13.9%(-9.66)#29,469 |
| 62. | 19944 | 4.3% | 14.8%(-10.6)#62 | 13.9%(-9.67)#29,471 |
| 63. | 19955 | 1.4% | 14.8%(-13.5)#63 | 13.9%(-12.6)#30,461 |
1
Common Questions
What are the Top 10 Zip Codes with the Highest Percentage of Population Employed in Health Care & Social Assistance in Delaware?
Top 10 Zip Codes with the Highest Percentage of Population Employed in Health Care & Social Assistance in Delaware are:
What zip code has the Highest Percentage of Population Employed in Health Care & Social Assistance in Delaware?
19710 has the Highest Percentage of Population Employed in Health Care & Social Assistance in Delaware with 47.1%.
What is the Percentage of Population Employed in Health Care & Social Assistance in the State of Delaware?
Percentage of Population Employed in Health Care & Social Assistance in Delaware is 14.8%.
What is the Percentage of Population Employed in Health Care & Social Assistance in the United States?
Percentage of Population Employed in Health Care & Social Assistance in the United States is 13.9%.