Zip Codes with the Highest Percentage of Population with a Degree in Literature and Languages in Delaware

RELATED REPORTS & OPTIONS

Literature and Languages
Population
Families and Households
Female Fertility
Female Fertility (Unmarried)
Race (Community Size)
Race (Percentage)
Ancestry (Community Size)
AfghanAfricanAlaska NativeAlaskan AthabascanAlbanianAleutAlsatianAmericanApacheArabArapahoArgentineanArmenianAssyrian / Chaldean / SyriacAustralianAustrianBahamianBangladeshiBarbadianBasqueBelgianBelizeanBermudanBhutaneseBlackfeetBolivianBrazilianBritishBritish West IndianBulgarianBurmeseCajunCambodianCanadianCape VerdeanCarpatho RusynCelticCentral AmericanCentral American IndianCherokeeCheyenneChickasawChileanChineseChippewaChoctawColombianColvilleComancheCosta RicanCreeCreekCroatianCrowCubanCypriotCzechCzechoslovakianDanishDelawareDominicanDutchDutch West IndianEastern EuropeanEcuadorianEgyptianEnglishEstonianEthiopianEuropeanFijianFilipinoFinnishFrenchFrench American IndianFrench CanadianGermanGerman RussianGhanaianGreekGuamanian / ChamorroGuatemalanGuyaneseHaitianHmongHonduranHopiHoumaHungarianIcelanderIndian (Asian)IndonesianInupiatIranianIraqiIrishIroquoisIsraeliItalianJamaicanJapaneseJordanianKenyanKiowaKoreanLaotianLatvianLebaneseLiberianLithuanianLumbeeLuxembourgerMacedonianMalaysianMalteseMarshalleseMenomineeMexicanMexican American IndianMongolianMoroccanNative HawaiianNavajoNepaleseNew ZealanderNicaraguanNigerianNorthern EuropeanNorwegianOkinawanOsageOttawaPaiutePakistaniPalestinianPanamanianParaguayanPennsylvania GermanPeruvianPimaPolishPortuguesePotawatomiPuebloPuerto RicanPuget Sound SalishRomanianRussianSalvadoranSamoanScandinavianScotch-IrishScottishSeminoleSenegaleseSerbianShoshoneSierra LeoneanSiouxSlavicSlovakSloveneSomaliSouth AfricanSouth AmericanSouth American IndianSoviet UnionSpaniardSpanishSpanish AmericanSpanish American IndianSri LankanSubsaharan AfricanSudaneseSwedishSwissSyrianTaiwaneseThaiTlingit-HaidaTohono O'OdhamTonganTrinidadian and TobagonianTsimshianTurkishU.S. Virgin IslanderUgandanUkrainianUruguayanUteVenezuelanVietnameseWelshWest IndianYakamaYaquiYugoslavianYumanYup'ikZimbabwean
Ancestry (Percentage)
AfghanAfricanAlaska NativeAlaskan AthabascanAlbanianAleutAlsatianAmericanApacheArabArapahoArgentineanArmenianAssyrian / Chaldean / SyriacAustralianAustrianBahamianBangladeshiBarbadianBasqueBelgianBelizeanBermudanBhutaneseBlackfeetBolivianBrazilianBritishBritish West IndianBulgarianBurmeseCajunCambodianCanadianCape VerdeanCarpatho RusynCelticCentral AmericanCentral American IndianCherokeeCheyenneChickasawChileanChineseChippewaChoctawColombianColvilleComancheCosta RicanCreeCreekCroatianCrowCubanCypriotCzechCzechoslovakianDanishDelawareDominicanDutchDutch West IndianEastern EuropeanEcuadorianEgyptianEnglishEstonianEthiopianEuropeanFijianFilipinoFinnishFrenchFrench American IndianFrench CanadianGermanGerman RussianGhanaianGreekGuamanian / ChamorroGuatemalanGuyaneseHaitianHmongHonduranHopiHoumaHungarianIcelanderIndian (Asian)IndonesianInupiatIranianIraqiIrishIroquoisIsraeliItalianJamaicanJapaneseJordanianKenyanKiowaKoreanLaotianLatvianLebaneseLiberianLithuanianLumbeeLuxembourgerMacedonianMalaysianMalteseMarshalleseMenomineeMexicanMexican American IndianMongolianMoroccanNative HawaiianNavajoNepaleseNew ZealanderNicaraguanNigerianNorthern EuropeanNorwegianOkinawanOsageOttawaPaiutePakistaniPalestinianPanamanianParaguayanPennsylvania GermanPeruvianPimaPolishPortuguesePotawatomiPuebloPuerto RicanPuget Sound SalishRomanianRussianSalvadoranSamoanScandinavianScotch-IrishScottishSeminoleSenegaleseSerbianShoshoneSierra LeoneanSiouxSlavicSlovakSloveneSomaliSouth AfricanSouth AmericanSouth American IndianSoviet UnionSpaniardSpanishSpanish AmericanSpanish American IndianSri LankanSubsaharan AfricanSudaneseSwedishSwissSyrianTaiwaneseThaiTlingit-HaidaTohono O'OdhamTonganTrinidadian and TobagonianTsimshianTurkishU.S. Virgin IslanderUgandanUkrainianUruguayanUteVenezuelanVietnameseWelshWest IndianYakamaYaquiYugoslavianYumanYup'ikZimbabwean
Immigrant Origin (Total)
AfghanistanAfricaAlbaniaArgentinaArmeniaAsiaAustraliaAustriaAzoresBahamasBangladeshBarbadosBelarusBelgiumBelizeBoliviaBosnia and HerzegovinaBrazilBulgariaBurma / MyanmarCabo VerdeCambodiaCameroonCanadaCaribbeanCentral AmericaChileChinaColombiaCongoCosta RicaCroatiaCubaCzechoslovakiaDenmarkDominicaDominican RepublicEastern AfricaEastern AsiaEastern EuropeEcuadorEgyptEl SalvadorEnglandEritreaEthiopiaEuropeFijiFranceGermanyGhanaGreeceGrenadaGuatemalaGuyanaHaitiHondurasHong KongHungaryIndiaIndonesiaIranIraqIrelandIsraelItalyJamaicaJapanJordanKazakhstanKenyaKoreaKuwaitLaosLatin AmericaLatviaLebanonLiberiaLithuaniaMalaysiaMexicoMicronesiaMiddle AfricaMoldovaMoroccoNepalNetherlandsNicaraguaNigeriaNorth MacedoniaNorthern AfricaNorthern EuropeNorwayOceaniaPakistanPanamaPeruPhilippinesPolandPortugalRomaniaRussiaSaudi ArabiaScotlandSenegalSerbiaSierra LeoneSingaporeSomaliaSouth AfricaSouth AmericaSouth Central AsiaSouth Eastern AsiaSouthern EuropeSpainSri LankaSt. Vincent and the GrenadinesSudanSwedenSwitzerlandSyriaTaiwanThailandTrinidad and TobagoTurkeyUgandaUkraineUruguayUzbekistanVenezuelaVietnamWest IndiesWestern AfricaWestern AsiaWestern EuropeYemenZaireZimbabwe
Immigrant Origin (Percentage)
AfghanistanAfricaAlbaniaArgentinaArmeniaAsiaAustraliaAustriaAzoresBahamasBangladeshBarbadosBelarusBelgiumBelizeBoliviaBosnia and HerzegovinaBrazilBulgariaBurma / MyanmarCabo VerdeCambodiaCameroonCanadaCaribbeanCentral AmericaChileChinaColombiaCongoCosta RicaCroatiaCubaCzechoslovakiaDenmarkDominicaDominican RepublicEastern AfricaEastern AsiaEastern EuropeEcuadorEgyptEl SalvadorEnglandEritreaEthiopiaEuropeFijiFranceGermanyGhanaGreeceGrenadaGuatemalaGuyanaHaitiHondurasHong KongHungaryIndiaIndonesiaIranIraqIrelandIsraelItalyJamaicaJapanJordanKazakhstanKenyaKoreaKuwaitLaosLatin AmericaLatviaLebanonLiberiaLithuaniaMalaysiaMexicoMicronesiaMiddle AfricaMoldovaMoroccoNepalNetherlandsNicaraguaNigeriaNorth MacedoniaNorthern AfricaNorthern EuropeNorwayOceaniaPakistanPanamaPeruPhilippinesPolandPortugalRomaniaRussiaSaudi ArabiaScotlandSenegalSerbiaSierra LeoneSingaporeSomaliaSouth AfricaSouth AmericaSouth Central AsiaSouth Eastern AsiaSouthern EuropeSpainSri LankaSt. Vincent and the GrenadinesSudanSwedenSwitzerlandSyriaTaiwanThailandTrinidad and TobagoTurkeyUgandaUkraineUruguayUzbekistanVenezuelaVietnamWest IndiesWestern AfricaWestern AsiaWestern EuropeYemenZaireZimbabwe
Income
Income (Families)
Income (Households)
Poverty
Poverty (Families)
Unemployment
Employment Occupations
Employment Industries
Employer Class
Commute Time
Commute Means
School Enrollment
Education by Degree Field
Occupancy
Finances
Physical Characteristics
Delaware
Compare Zip Codes
Comparison Subject

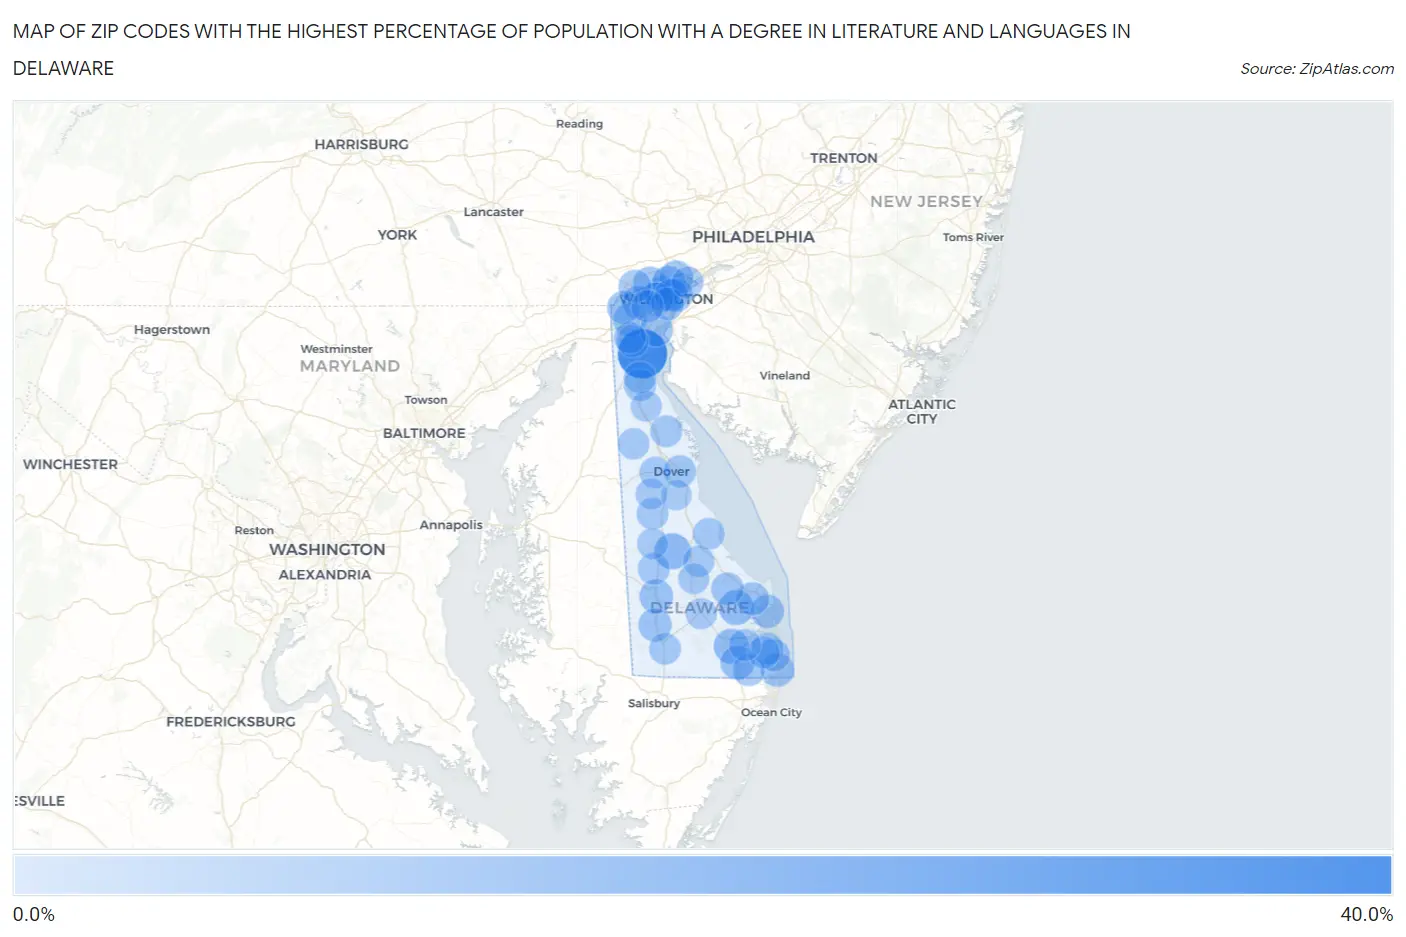
Map of Zip Codes with the Highest Percentage of Population with a Degree in Literature and Languages in Delaware

0.0%
40.0%
Zip Codes with the Highest Percentage of Population with a Degree in Literature and Languages in Delaware Map

Zip Codes with the Highest Percentage of Population with a Degree in Literature and Languages in Delaware

Zip Code % Graduates vs State vs National
1.1973332.3%4.1%(+28.2)#14.4%(+27.9)#181
2.199549.7%4.1%(+5.58)#24.4%(+5.27)#1,962
3.198068.0%4.1%(+3.85)#34.4%(+3.54)#3,023
4.199517.8%4.1%(+3.72)#44.4%(+3.41)#3,140
5.199667.7%4.1%(+3.64)#54.4%(+3.33)#3,209
6.199456.3%4.1%(+2.18)#64.4%(+1.88)#4,947
7.198076.2%4.1%(+2.06)#74.4%(+1.75)#5,155
8.197136.0%4.1%(+1.87)#84.4%(+1.56)#5,456
9.198105.9%4.1%(+1.77)#94.4%(+1.46)#5,650
10.199335.7%4.1%(+1.63)#104.4%(+1.32)#5,879
11.198035.5%4.1%(+1.35)#114.4%(+1.05)#6,402
12.198095.4%4.1%(+1.25)#124.4%(+0.941)#6,620
13.199445.3%4.1%(+1.22)#134.4%(+0.916)#6,672
14.198055.2%4.1%(+1.13)#144.4%(+0.827)#6,871
15.199715.1%4.1%(+1.03)#154.4%(+0.722)#7,068
16.197205.0%4.1%(+0.921)#164.4%(+0.614)#7,300
17.198085.0%4.1%(+0.899)#174.4%(+0.592)#7,342
18.199734.9%4.1%(+0.825)#184.4%(+0.518)#7,536
19.197114.7%4.1%(+0.597)#194.4%(+0.290)#8,164
20.198024.6%4.1%(+0.470)#204.4%(+0.163)#8,515
21.199584.5%4.1%(+0.355)#214.4%(+0.047)#8,839
22.197074.2%4.1%(+0.053)#224.4%(-0.254)#9,754
23.198014.1%4.1%(-0.046)#234.4%(-0.353)#10,030
24.198043.9%4.1%(-0.251)#244.4%(-0.558)#10,668
25.199683.7%4.1%(-0.408)#254.4%(-0.715)#11,180
26.199303.3%4.1%(-0.766)#264.4%(-1.07)#12,388
27.197013.3%4.1%(-0.783)#274.4%(-1.09)#12,467
28.199753.2%4.1%(-0.891)#284.4%(-1.20)#12,864
29.199013.2%4.1%(-0.907)#294.4%(-1.21)#12,931
30.197303.1%4.1%(-0.997)#304.4%(-1.30)#13,192
31.199703.1%4.1%(-1.00)#314.4%(-1.31)#13,213
32.197092.8%4.1%(-1.27)#324.4%(-1.57)#14,133
33.199772.8%4.1%(-1.34)#334.4%(-1.64)#14,385
34.199672.7%4.1%(-1.37)#344.4%(-1.68)#14,517
35.199502.7%4.1%(-1.44)#354.4%(-1.75)#14,748
36.199392.6%4.1%(-1.46)#364.4%(-1.76)#14,772
37.199432.6%4.1%(-1.47)#374.4%(-1.78)#14,824
38.197032.5%4.1%(-1.64)#384.4%(-1.95)#15,474
39.197022.4%4.1%(-1.68)#394.4%(-1.99)#15,590
40.199632.4%4.1%(-1.70)#404.4%(-2.01)#15,667
41.199562.3%4.1%(-1.81)#414.4%(-2.11)#16,059
42.199042.0%4.1%(-2.11)#424.4%(-2.42)#17,134
43.199601.7%4.1%(-2.37)#434.4%(-2.68)#17,927
44.199381.7%4.1%(-2.38)#444.4%(-2.69)#17,960
45.199341.5%4.1%(-2.64)#454.4%(-2.95)#18,796
46.199471.5%4.1%(-2.65)#464.4%(-2.96)#18,827
47.197341.3%4.1%(-2.80)#474.4%(-3.10)#19,273
48.199521.2%4.1%(-2.91)#484.4%(-3.22)#19,601
49.199411.0%4.1%(-3.07)#494.4%(-3.38)#20,045
50.199620.69%4.1%(-3.42)#504.4%(-3.72)#20,878

Common Questions

What are the Top 10 Zip Codes with the Highest Percentage of Population with a Degree in Literature and Languages in Delaware?
Top 10 Zip Codes with the Highest Percentage of Population with a Degree in Literature and Languages in Delaware are:
#1
32.3%
#2
9.7%
#3
8.0%
#4
7.8%
#5
7.7%
#6
6.3%
#7
6.2%
#8
6.0%
#9
5.9%
#10
5.7%
What zip code has the Highest Percentage of Population with a Degree in Literature and Languages in Delaware?
19733 has the Highest Percentage of Population with a Degree in Literature and Languages in Delaware with 32.3%.
What is the Percentage of Population with a Degree in Literature and Languages in the State of Delaware?
Percentage of Population with a Degree in Literature and Languages in Delaware is 4.1%.
What is the Percentage of Population with a Degree in Literature and Languages in the United States?
Percentage of Population with a Degree in Literature and Languages in the United States is 4.4%.