Zip Codes with the Highest Percentage of Self-Employed / Incorporated in Delaware

RELATED REPORTS & OPTIONS

Self-Employed / Incorporated
Population
Families and Households
Female Fertility
Female Fertility (Unmarried)
Race (Community Size)
Race (Percentage)
Ancestry (Community Size)
AfghanAfricanAlaska NativeAlaskan AthabascanAlbanianAleutAlsatianAmericanApacheArabArapahoArgentineanArmenianAssyrian / Chaldean / SyriacAustralianAustrianBahamianBangladeshiBarbadianBasqueBelgianBelizeanBermudanBhutaneseBlackfeetBolivianBrazilianBritishBritish West IndianBulgarianBurmeseCajunCambodianCanadianCape VerdeanCarpatho RusynCelticCentral AmericanCentral American IndianCherokeeCheyenneChickasawChileanChineseChippewaChoctawColombianColvilleComancheCosta RicanCreeCreekCroatianCrowCubanCypriotCzechCzechoslovakianDanishDelawareDominicanDutchDutch West IndianEastern EuropeanEcuadorianEgyptianEnglishEstonianEthiopianEuropeanFijianFilipinoFinnishFrenchFrench American IndianFrench CanadianGermanGerman RussianGhanaianGreekGuamanian / ChamorroGuatemalanGuyaneseHaitianHmongHonduranHopiHoumaHungarianIcelanderIndian (Asian)IndonesianInupiatIranianIraqiIrishIroquoisIsraeliItalianJamaicanJapaneseJordanianKenyanKiowaKoreanLaotianLatvianLebaneseLiberianLithuanianLumbeeLuxembourgerMacedonianMalaysianMalteseMarshalleseMenomineeMexicanMexican American IndianMongolianMoroccanNative HawaiianNavajoNepaleseNew ZealanderNicaraguanNigerianNorthern EuropeanNorwegianOkinawanOsageOttawaPaiutePakistaniPalestinianPanamanianParaguayanPennsylvania GermanPeruvianPimaPolishPortuguesePotawatomiPuebloPuerto RicanPuget Sound SalishRomanianRussianSalvadoranSamoanScandinavianScotch-IrishScottishSeminoleSenegaleseSerbianShoshoneSierra LeoneanSiouxSlavicSlovakSloveneSomaliSouth AfricanSouth AmericanSouth American IndianSoviet UnionSpaniardSpanishSpanish AmericanSpanish American IndianSri LankanSubsaharan AfricanSudaneseSwedishSwissSyrianTaiwaneseThaiTlingit-HaidaTohono O'OdhamTonganTrinidadian and TobagonianTsimshianTurkishU.S. Virgin IslanderUgandanUkrainianUruguayanUteVenezuelanVietnameseWelshWest IndianYakamaYaquiYugoslavianYumanYup'ikZimbabwean
Ancestry (Percentage)
AfghanAfricanAlaska NativeAlaskan AthabascanAlbanianAleutAlsatianAmericanApacheArabArapahoArgentineanArmenianAssyrian / Chaldean / SyriacAustralianAustrianBahamianBangladeshiBarbadianBasqueBelgianBelizeanBermudanBhutaneseBlackfeetBolivianBrazilianBritishBritish West IndianBulgarianBurmeseCajunCambodianCanadianCape VerdeanCarpatho RusynCelticCentral AmericanCentral American IndianCherokeeCheyenneChickasawChileanChineseChippewaChoctawColombianColvilleComancheCosta RicanCreeCreekCroatianCrowCubanCypriotCzechCzechoslovakianDanishDelawareDominicanDutchDutch West IndianEastern EuropeanEcuadorianEgyptianEnglishEstonianEthiopianEuropeanFijianFilipinoFinnishFrenchFrench American IndianFrench CanadianGermanGerman RussianGhanaianGreekGuamanian / ChamorroGuatemalanGuyaneseHaitianHmongHonduranHopiHoumaHungarianIcelanderIndian (Asian)IndonesianInupiatIranianIraqiIrishIroquoisIsraeliItalianJamaicanJapaneseJordanianKenyanKiowaKoreanLaotianLatvianLebaneseLiberianLithuanianLumbeeLuxembourgerMacedonianMalaysianMalteseMarshalleseMenomineeMexicanMexican American IndianMongolianMoroccanNative HawaiianNavajoNepaleseNew ZealanderNicaraguanNigerianNorthern EuropeanNorwegianOkinawanOsageOttawaPaiutePakistaniPalestinianPanamanianParaguayanPennsylvania GermanPeruvianPimaPolishPortuguesePotawatomiPuebloPuerto RicanPuget Sound SalishRomanianRussianSalvadoranSamoanScandinavianScotch-IrishScottishSeminoleSenegaleseSerbianShoshoneSierra LeoneanSiouxSlavicSlovakSloveneSomaliSouth AfricanSouth AmericanSouth American IndianSoviet UnionSpaniardSpanishSpanish AmericanSpanish American IndianSri LankanSubsaharan AfricanSudaneseSwedishSwissSyrianTaiwaneseThaiTlingit-HaidaTohono O'OdhamTonganTrinidadian and TobagonianTsimshianTurkishU.S. Virgin IslanderUgandanUkrainianUruguayanUteVenezuelanVietnameseWelshWest IndianYakamaYaquiYugoslavianYumanYup'ikZimbabwean
Immigrant Origin (Total)
AfghanistanAfricaAlbaniaArgentinaArmeniaAsiaAustraliaAustriaAzoresBahamasBangladeshBarbadosBelarusBelgiumBelizeBoliviaBosnia and HerzegovinaBrazilBulgariaBurma / MyanmarCabo VerdeCambodiaCameroonCanadaCaribbeanCentral AmericaChileChinaColombiaCongoCosta RicaCroatiaCubaCzechoslovakiaDenmarkDominicaDominican RepublicEastern AfricaEastern AsiaEastern EuropeEcuadorEgyptEl SalvadorEnglandEritreaEthiopiaEuropeFijiFranceGermanyGhanaGreeceGrenadaGuatemalaGuyanaHaitiHondurasHong KongHungaryIndiaIndonesiaIranIraqIrelandIsraelItalyJamaicaJapanJordanKazakhstanKenyaKoreaKuwaitLaosLatin AmericaLatviaLebanonLiberiaLithuaniaMalaysiaMexicoMicronesiaMiddle AfricaMoldovaMoroccoNepalNetherlandsNicaraguaNigeriaNorth MacedoniaNorthern AfricaNorthern EuropeNorwayOceaniaPakistanPanamaPeruPhilippinesPolandPortugalRomaniaRussiaSaudi ArabiaScotlandSenegalSerbiaSierra LeoneSingaporeSomaliaSouth AfricaSouth AmericaSouth Central AsiaSouth Eastern AsiaSouthern EuropeSpainSri LankaSt. Vincent and the GrenadinesSudanSwedenSwitzerlandSyriaTaiwanThailandTrinidad and TobagoTurkeyUgandaUkraineUruguayUzbekistanVenezuelaVietnamWest IndiesWestern AfricaWestern AsiaWestern EuropeYemenZaireZimbabwe
Immigrant Origin (Percentage)
AfghanistanAfricaAlbaniaArgentinaArmeniaAsiaAustraliaAustriaAzoresBahamasBangladeshBarbadosBelarusBelgiumBelizeBoliviaBosnia and HerzegovinaBrazilBulgariaBurma / MyanmarCabo VerdeCambodiaCameroonCanadaCaribbeanCentral AmericaChileChinaColombiaCongoCosta RicaCroatiaCubaCzechoslovakiaDenmarkDominicaDominican RepublicEastern AfricaEastern AsiaEastern EuropeEcuadorEgyptEl SalvadorEnglandEritreaEthiopiaEuropeFijiFranceGermanyGhanaGreeceGrenadaGuatemalaGuyanaHaitiHondurasHong KongHungaryIndiaIndonesiaIranIraqIrelandIsraelItalyJamaicaJapanJordanKazakhstanKenyaKoreaKuwaitLaosLatin AmericaLatviaLebanonLiberiaLithuaniaMalaysiaMexicoMicronesiaMiddle AfricaMoldovaMoroccoNepalNetherlandsNicaraguaNigeriaNorth MacedoniaNorthern AfricaNorthern EuropeNorwayOceaniaPakistanPanamaPeruPhilippinesPolandPortugalRomaniaRussiaSaudi ArabiaScotlandSenegalSerbiaSierra LeoneSingaporeSomaliaSouth AfricaSouth AmericaSouth Central AsiaSouth Eastern AsiaSouthern EuropeSpainSri LankaSt. Vincent and the GrenadinesSudanSwedenSwitzerlandSyriaTaiwanThailandTrinidad and TobagoTurkeyUgandaUkraineUruguayUzbekistanVenezuelaVietnamWest IndiesWestern AfricaWestern AsiaWestern EuropeYemenZaireZimbabwe
Income
Income (Families)
Income (Households)
Poverty
Poverty (Families)
Unemployment
Employment Occupations
Employment Industries
Employer Class
Commute Time
Commute Means
School Enrollment
Education by Degree Field
Occupancy
Finances
Physical Characteristics
Delaware
Compare Zip Codes
Comparison Subject

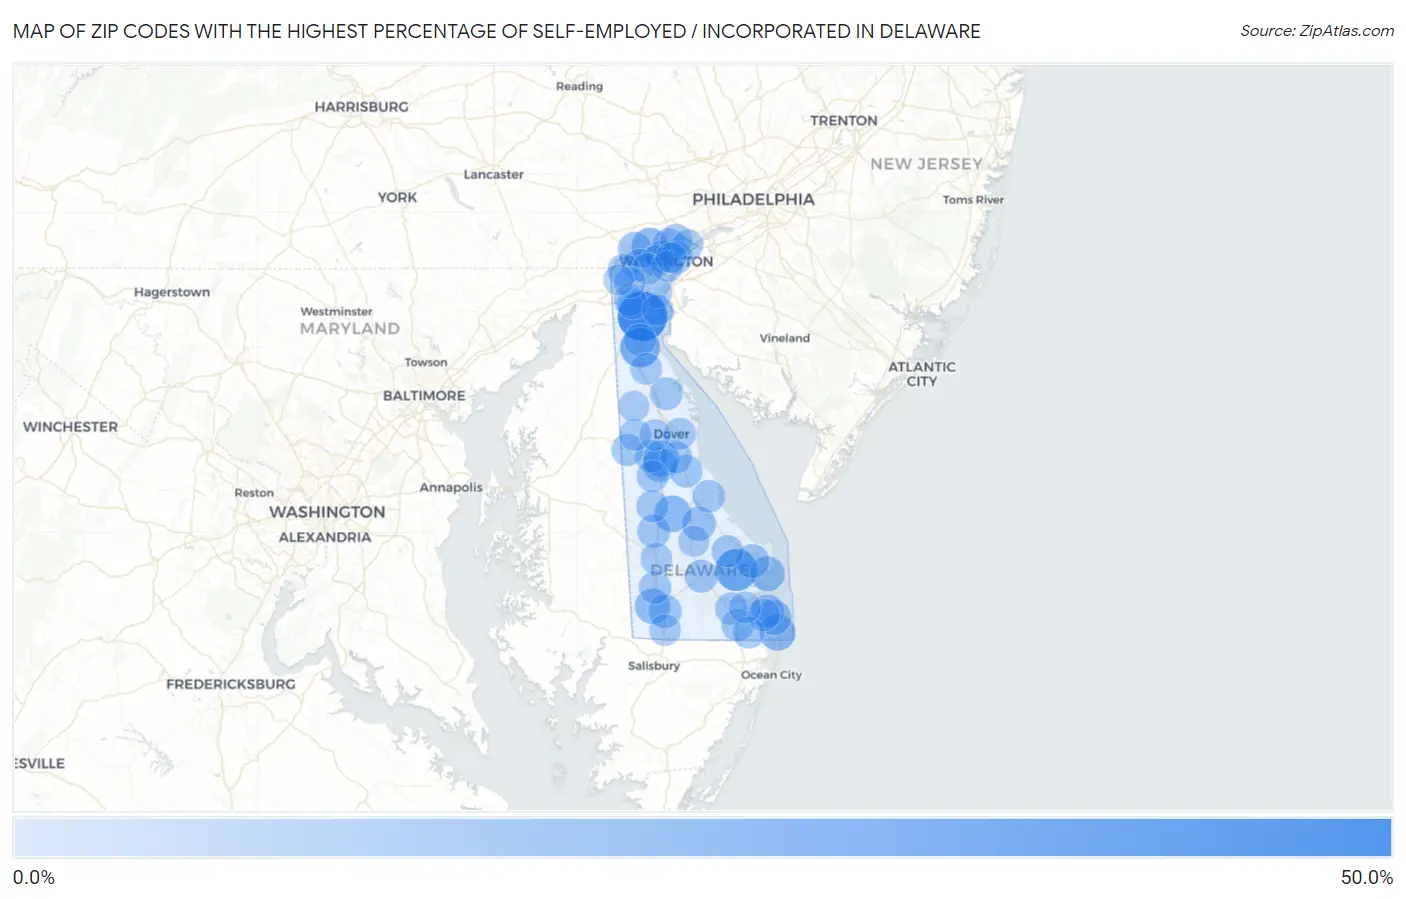
Map of Zip Codes with the Highest Percentage of Self-Employed / Incorporated in Delaware

0.0%
50.0%
Zip Codes with the Highest Percentage of Self-Employed / Incorporated in Delaware Map

Zip Codes with the Highest Percentage of Self-Employed / Incorporated in Delaware

Zip Code % Self-Employed / Incorporated vs State vs National
1.1973341.9%4.2%(+37.7)#13.8%(+38.1)#120
2.1995125.3%4.2%(+21.1)#23.8%(+21.4)#304
3.1973020.4%4.2%(+16.2)#33.8%(+16.6)#488
4.1980713.7%4.2%(+9.53)#43.8%(+9.88)#1,198
5.1995413.5%4.2%(+9.36)#53.8%(+9.71)#1,228
6.1994412.3%4.2%(+8.17)#63.8%(+8.53)#1,486
7.1998012.2%4.2%(+8.05)#73.8%(+8.41)#1,513
8.1993010.8%4.2%(+6.64)#83.8%(+7.00)#1,969
9.1993110.7%4.2%(+6.57)#93.8%(+6.93)#1,996
10.199719.7%4.2%(+5.48)#103.8%(+5.84)#2,491
11.199798.7%4.2%(+4.57)#113.8%(+4.92)#3,051
12.199608.0%4.2%(+3.85)#123.8%(+4.21)#3,643
13.199587.8%4.2%(+3.63)#133.8%(+3.99)#3,857
14.197077.7%4.2%(+3.50)#143.8%(+3.86)#3,999
15.199707.1%4.2%(+2.97)#153.8%(+3.33)#4,566
16.198036.4%4.2%(+2.26)#163.8%(+2.62)#5,577
17.199566.4%4.2%(+2.24)#173.8%(+2.60)#5,602
18.199506.2%4.2%(+2.04)#183.8%(+2.40)#5,945
19.199475.7%4.2%(+1.48)#193.8%(+1.84)#6,986
20.198065.0%4.2%(+0.872)#203.8%(+1.23)#8,472
21.199775.0%4.2%(+0.826)#213.8%(+1.18)#8,618
22.198094.9%4.2%(+0.715)#223.8%(+1.07)#8,908
23.199734.8%4.2%(+0.640)#233.8%(+0.996)#9,140
24.199464.7%4.2%(+0.525)#243.8%(+0.881)#9,490
25.199664.7%4.2%(+0.484)#253.8%(+0.840)#9,591
26.199634.7%4.2%(+0.479)#263.8%(+0.835)#9,608
27.198084.5%4.2%(+0.355)#273.8%(+0.711)#9,997
28.199454.5%4.2%(+0.284)#283.8%(+0.640)#10,240
29.199674.4%4.2%(+0.260)#293.8%(+0.616)#10,321
30.199344.2%4.2%(+0.039)#303.8%(+0.395)#11,135
31.197024.2%4.2%(+0.006)#313.8%(+0.362)#11,244
32.198104.0%4.2%(-0.160)#323.8%(+0.196)#11,875
33.197094.0%4.2%(-0.192)#333.8%(+0.163)#11,989
34.197113.9%4.2%(-0.238)#343.8%(+0.118)#12,206
35.199683.9%4.2%(-0.284)#353.8%(+0.072)#12,388
36.199523.9%4.2%(-0.293)#363.8%(+0.063)#12,417
37.199753.8%4.2%(-0.351)#373.8%(+0.005)#12,666
38.199643.8%4.2%(-0.385)#383.8%(-0.029)#12,807
39.199623.6%4.2%(-0.575)#393.8%(-0.219)#13,615
40.199013.5%4.2%(-0.636)#403.8%(-0.280)#13,864
41.199393.5%4.2%(-0.711)#413.8%(-0.355)#14,205
42.197343.4%4.2%(-0.748)#423.8%(-0.392)#14,376
43.199333.4%4.2%(-0.778)#433.8%(-0.422)#14,508
44.199533.4%4.2%(-0.783)#443.8%(-0.427)#14,539
45.199433.0%4.2%(-1.13)#453.8%(-0.776)#16,176
46.197203.0%4.2%(-1.16)#463.8%(-0.805)#16,326
47.198052.9%4.2%(-1.29)#473.8%(-0.938)#17,000
48.197012.8%4.2%(-1.38)#483.8%(-1.03)#17,420
49.199402.7%4.2%(-1.47)#493.8%(-1.12)#17,893
50.199042.7%4.2%(-1.50)#503.8%(-1.14)#18,036
51.198042.6%4.2%(-1.60)#513.8%(-1.25)#18,573
52.197132.4%4.2%(-1.73)#523.8%(-1.38)#19,192
53.198012.4%4.2%(-1.74)#533.8%(-1.38)#19,226
54.197032.2%4.2%(-2.00)#543.8%(-1.64)#20,490
55.197061.9%4.2%(-2.24)#553.8%(-1.88)#21,675
56.199411.9%4.2%(-2.31)#563.8%(-1.95)#22,002
57.199381.3%4.2%(-2.85)#573.8%(-2.49)#24,153
58.197170.94%4.2%(-3.23)#583.8%(-2.88)#25,455
59.198020.91%4.2%(-3.26)#593.8%(-2.91)#25,523

Common Questions

What are the Top 10 Zip Codes with the Highest Percentage of Self-Employed / Incorporated in Delaware?
Top 10 Zip Codes with the Highest Percentage of Self-Employed / Incorporated in Delaware are:
#1
41.9%
#2
25.3%
#3
20.4%
#4
13.7%
#5
13.5%
#6
12.3%
#7
12.2%
#8
10.8%
#9
10.7%
#10
9.7%
What zip code has the Highest Percentage of Self-Employed / Incorporated in Delaware?
19733 has the Highest Percentage of Self-Employed / Incorporated in Delaware with 41.9%.
What is the Percentage of Self-Employed / Incorporated in the State of Delaware?
Percentage of Self-Employed / Incorporated in Delaware is 4.2%.
What is the Percentage of Self-Employed / Incorporated in the United States?
Percentage of Self-Employed / Incorporated in the United States is 3.8%.