Zip Codes with the Highest Percentage of Population Employed in Farming, Fishing & Forestry in Delaware
RELATED REPORTS & OPTIONS
Farming, Fishing & Forestry
Delaware
Compare Zip Codes
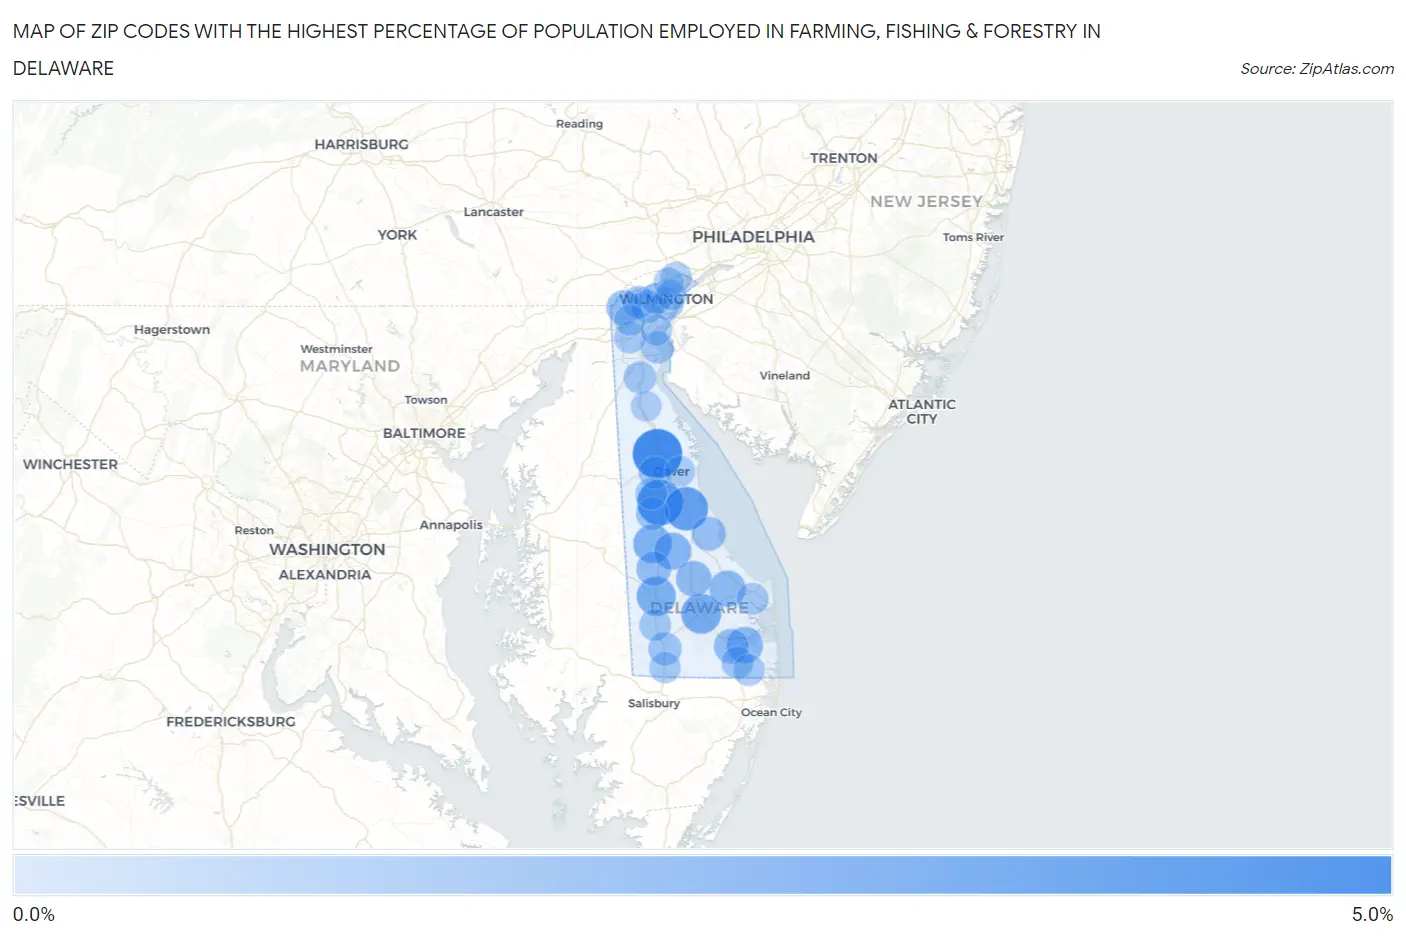
Map of Zip Codes with the Highest Percentage of Population Employed in Farming, Fishing & Forestry in Delaware
0.0%
5.0%
Zip Codes with the Highest Percentage of Population Employed in Farming, Fishing & Forestry in Delaware
| Zip Code | % Employed | vs State | vs National | |
| 1. | 19936 | 4.7% | 0.46%(+4.21)#1 | 0.61%(+4.07)#3,171 |
| 2. | 19979 | 3.7% | 0.46%(+3.28)#2 | 0.61%(+3.14)#3,951 |
| 3. | 19946 | 3.2% | 0.46%(+2.74)#3 | 0.61%(+2.60)#4,549 |
| 4. | 19947 | 2.3% | 0.46%(+1.87)#4 | 0.61%(+1.73)#5,837 |
| 5. | 19933 | 2.1% | 0.46%(+1.66)#5 | 0.61%(+1.52)#6,287 |
| 6. | 19952 | 2.0% | 0.46%(+1.52)#6 | 0.61%(+1.38)#6,599 |
| 7. | 19954 | 1.6% | 0.46%(+1.17)#7 | 0.61%(+1.03)#7,471 |
| 8. | 19968 | 1.5% | 0.46%(+1.00)#8 | 0.61%(+0.860)#7,989 |
| 9. | 19939 | 1.4% | 0.46%(+0.947)#9 | 0.61%(+0.805)#8,170 |
| 10. | 19941 | 1.3% | 0.46%(+0.807)#10 | 0.61%(+0.665)#8,683 |
| 11. | 19950 | 1.1% | 0.46%(+0.592)#11 | 0.61%(+0.451)#9,492 |
| 12. | 19711 | 1.1% | 0.46%(+0.590)#12 | 0.61%(+0.449)#9,501 |
| 13. | 19966 | 1.1% | 0.46%(+0.589)#13 | 0.61%(+0.448)#9,502 |
| 14. | 19963 | 0.91% | 0.46%(+0.443)#14 | 0.61%(+0.302)#10,187 |
| 15. | 19956 | 0.69% | 0.46%(+0.228)#15 | 0.61%(+0.087)#11,423 |
| 16. | 19804 | 0.65% | 0.46%(+0.187)#16 | 0.61%(+0.046)#11,689 |
| 17. | 19943 | 0.65% | 0.46%(+0.181)#17 | 0.61%(+0.040)#11,726 |
| 18. | 19808 | 0.61% | 0.46%(+0.145)#18 | 0.61%(+0.003)#11,974 |
| 19. | 19706 | 0.56% | 0.46%(+0.092)#19 | 0.61%(-0.049)#12,411 |
| 20. | 19904 | 0.53% | 0.46%(+0.063)#20 | 0.61%(-0.078)#12,622 |
| 21. | 19709 | 0.53% | 0.46%(+0.063)#21 | 0.61%(-0.079)#12,626 |
| 22. | 19801 | 0.44% | 0.46%(-0.024)#22 | 0.61%(-0.165)#13,382 |
| 23. | 19945 | 0.41% | 0.46%(-0.056)#23 | 0.61%(-0.198)#13,686 |
| 24. | 19973 | 0.39% | 0.46%(-0.070)#24 | 0.61%(-0.211)#13,804 |
| 25. | 19934 | 0.35% | 0.46%(-0.115)#25 | 0.61%(-0.256)#14,272 |
| 26. | 19702 | 0.35% | 0.46%(-0.119)#26 | 0.61%(-0.260)#14,309 |
| 27. | 19975 | 0.34% | 0.46%(-0.121)#27 | 0.61%(-0.262)#14,324 |
| 28. | 19958 | 0.34% | 0.46%(-0.125)#28 | 0.61%(-0.266)#14,378 |
| 29. | 19720 | 0.29% | 0.46%(-0.174)#29 | 0.61%(-0.316)#14,949 |
| 30. | 19810 | 0.27% | 0.46%(-0.198)#30 | 0.61%(-0.339)#15,206 |
| 31. | 19940 | 0.25% | 0.46%(-0.214)#31 | 0.61%(-0.355)#15,401 |
| 32. | 19713 | 0.23% | 0.46%(-0.232)#32 | 0.61%(-0.373)#15,661 |
| 33. | 19805 | 0.21% | 0.46%(-0.250)#33 | 0.61%(-0.391)#15,922 |
| 34. | 19901 | 0.077% | 0.46%(-0.387)#34 | 0.61%(-0.528)#18,165 |
| 35. | 19802 | 0.056% | 0.46%(-0.408)#35 | 0.61%(-0.549)#18,550 |
| 36. | 19734 | 0.056% | 0.46%(-0.409)#36 | 0.61%(-0.550)#18,558 |
| 37. | 19803 | 0.049% | 0.46%(-0.415)#37 | 0.61%(-0.557)#18,684 |
1
Common Questions
What are the Top 10 Zip Codes with the Highest Percentage of Population Employed in Farming, Fishing & Forestry in Delaware?
Top 10 Zip Codes with the Highest Percentage of Population Employed in Farming, Fishing & Forestry in Delaware are:
What zip code has the Highest Percentage of Population Employed in Farming, Fishing & Forestry in Delaware?
19936 has the Highest Percentage of Population Employed in Farming, Fishing & Forestry in Delaware with 4.7%.
What is the Percentage of Population Employed in Farming, Fishing & Forestry in the State of Delaware?
Percentage of Population Employed in Farming, Fishing & Forestry in Delaware is 0.46%.
What is the Percentage of Population Employed in Farming, Fishing & Forestry in the United States?
Percentage of Population Employed in Farming, Fishing & Forestry in the United States is 0.61%.