Zip Codes with the Highest Percentage of White / Caucasian Population in Delaware
RELATED REPORTS & OPTIONS
White / Caucasian
Delaware
Compare Zip Codes
Map of Zip Codes with the Highest Percentage of White / Caucasian Population in Delaware
0.0%
100.0%
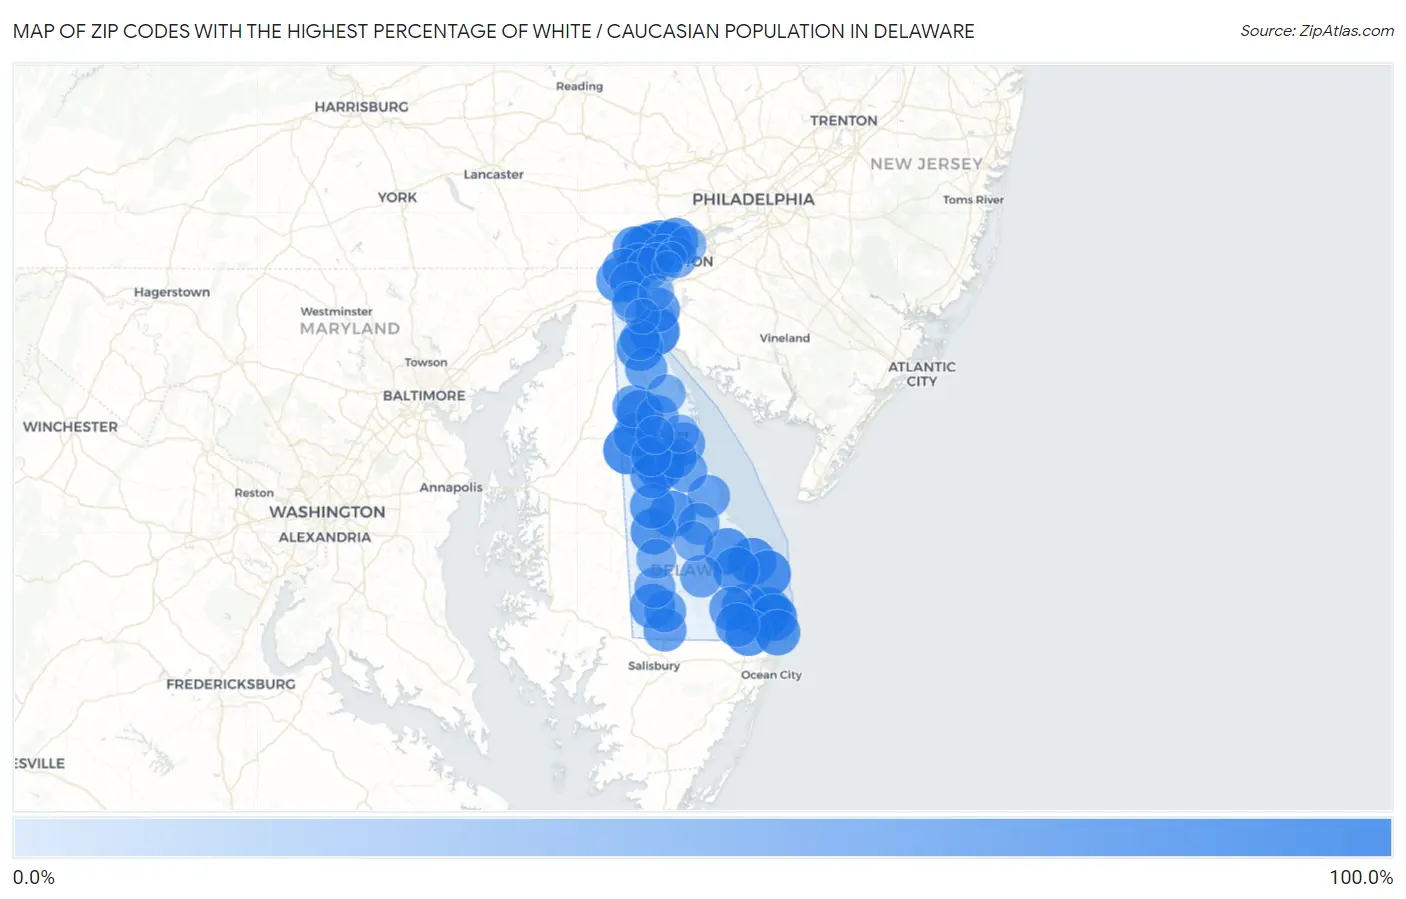
Zip Codes with the Highest Percentage of White / Caucasian Population in Delaware
| Zip Code | White / Caucasian | vs State | vs National | |
| 1. | 19732 | 100.0% | 63.8%(+36.2)#1 | 65.9%(+34.1)#585 |
| 2. | 19731 | 100.0% | 63.8%(+36.2)#2 | 65.9%(+34.1)#678 |
| 3. | 19710 | 100.0% | 63.8%(+36.2)#3 | 65.9%(+34.1)#2,386 |
| 4. | 19736 | 100.0% | 63.8%(+36.2)#4 | 65.9%(+34.1)#2,481 |
| 5. | 19980 | 98.7% | 63.8%(+34.9)#5 | 65.9%(+32.8)#3,693 |
| 6. | 19979 | 97.8% | 63.8%(+34.0)#6 | 65.9%(+31.9)#4,869 |
| 7. | 19964 | 95.9% | 63.8%(+32.1)#7 | 65.9%(+30.1)#7,641 |
| 8. | 19967 | 95.6% | 63.8%(+31.7)#8 | 65.9%(+29.7)#8,172 |
| 9. | 19970 | 93.8% | 63.8%(+30.0)#9 | 65.9%(+27.9)#10,734 |
| 10. | 19958 | 89.9% | 63.8%(+26.0)#10 | 65.9%(+24.0)#15,010 |
| 11. | 19955 | 89.8% | 63.8%(+26.0)#11 | 65.9%(+24.0)#15,027 |
| 12. | 19971 | 89.7% | 63.8%(+25.9)#12 | 65.9%(+23.9)#15,117 |
| 13. | 19939 | 89.5% | 63.8%(+25.6)#13 | 65.9%(+23.6)#15,314 |
| 14. | 19930 | 89.1% | 63.8%(+25.3)#14 | 65.9%(+23.2)#15,612 |
| 15. | 19975 | 88.9% | 63.8%(+25.1)#15 | 65.9%(+23.0)#15,737 |
| 16. | 19730 | 88.9% | 63.8%(+25.1)#16 | 65.9%(+23.0)#15,760 |
| 17. | 19954 | 87.1% | 63.8%(+23.3)#17 | 65.9%(+21.2)#17,062 |
| 18. | 19803 | 87.1% | 63.8%(+23.3)#18 | 65.9%(+21.2)#17,064 |
| 19. | 19968 | 86.6% | 63.8%(+22.8)#19 | 65.9%(+20.8)#17,384 |
| 20. | 19950 | 86.2% | 63.8%(+22.3)#20 | 65.9%(+20.3)#17,700 |
| 21. | 19951 | 85.6% | 63.8%(+21.8)#21 | 65.9%(+19.7)#18,041 |
| 22. | 19807 | 85.3% | 63.8%(+21.4)#22 | 65.9%(+19.4)#18,236 |
| 23. | 19944 | 84.0% | 63.8%(+20.2)#23 | 65.9%(+18.1)#18,938 |
| 24. | 19952 | 81.3% | 63.8%(+17.5)#24 | 65.9%(+15.4)#20,361 |
| 25. | 19931 | 81.1% | 63.8%(+17.3)#25 | 65.9%(+15.2)#20,450 |
| 26. | 19717 | 80.7% | 63.8%(+16.8)#26 | 65.9%(+14.8)#20,690 |
| 27. | 19706 | 80.5% | 63.8%(+16.7)#27 | 65.9%(+14.6)#20,775 |
| 28. | 19707 | 80.1% | 63.8%(+16.3)#28 | 65.9%(+14.2)#20,951 |
| 29. | 19810 | 77.4% | 63.8%(+13.6)#29 | 65.9%(+11.5)#22,098 |
| 30. | 19966 | 77.3% | 63.8%(+13.5)#30 | 65.9%(+11.4)#22,141 |
| 31. | 19943 | 77.3% | 63.8%(+13.5)#31 | 65.9%(+11.4)#22,144 |
| 32. | 19945 | 77.3% | 63.8%(+13.4)#32 | 65.9%(+11.4)#22,162 |
| 33. | 19806 | 76.1% | 63.8%(+12.2)#33 | 65.9%(+10.2)#22,640 |
| 34. | 19953 | 75.9% | 63.8%(+12.1)#34 | 65.9%(+10.0)#22,696 |
| 35. | 19808 | 74.2% | 63.8%(+10.4)#35 | 65.9%(+8.33)#23,324 |
| 36. | 19940 | 72.9% | 63.8%(+9.04)#36 | 65.9%(+6.99)#23,806 |
| 37. | 19711 | 72.7% | 63.8%(+8.84)#37 | 65.9%(+6.79)#23,881 |
| 38. | 19902 | 71.9% | 63.8%(+8.04)#38 | 65.9%(+6.00)#24,136 |
| 39. | 19963 | 71.1% | 63.8%(+7.30)#39 | 65.9%(+5.25)#24,383 |
| 40. | 19938 | 70.4% | 63.8%(+6.54)#40 | 65.9%(+4.49)#24,614 |
| 41. | 19947 | 70.3% | 63.8%(+6.44)#41 | 65.9%(+4.39)#24,643 |
| 42. | 19936 | 70.3% | 63.8%(+6.44)#42 | 65.9%(+4.39)#24,645 |
| 43. | 19956 | 70.1% | 63.8%(+6.31)#43 | 65.9%(+4.26)#24,687 |
| 44. | 19804 | 70.0% | 63.8%(+6.22)#44 | 65.9%(+4.17)#24,720 |
| 45. | 19734 | 69.6% | 63.8%(+5.81)#45 | 65.9%(+3.76)#24,822 |
| 46. | 19946 | 69.1% | 63.8%(+5.26)#46 | 65.9%(+3.21)#24,967 |
| 47. | 19960 | 67.3% | 63.8%(+3.50)#47 | 65.9%(+1.45)#25,469 |
| 48. | 19962 | 66.1% | 63.8%(+2.28)#48 | 65.9%(+0.228)#25,804 |
| 49. | 19809 | 64.8% | 63.8%(+0.964)#49 | 65.9%(-1.08)#26,175 |
| 50. | 19973 | 64.1% | 63.8%(+0.239)#50 | 65.9%(-1.81)#26,378 |
| 51. | 19709 | 61.5% | 63.8%(-2.31)#51 | 65.9%(-4.36)#26,945 |
| 52. | 19713 | 61.3% | 63.8%(-2.49)#52 | 65.9%(-4.54)#26,990 |
| 53. | 19934 | 61.2% | 63.8%(-2.59)#53 | 65.9%(-4.63)#27,012 |
| 54. | 19941 | 60.0% | 63.8%(-3.84)#54 | 65.9%(-5.89)#27,302 |
| 55. | 19933 | 59.6% | 63.8%(-4.22)#55 | 65.9%(-6.27)#27,382 |
| 56. | 19701 | 57.6% | 63.8%(-6.25)#56 | 65.9%(-8.30)#27,788 |
| 57. | 19977 | 55.4% | 63.8%(-8.45)#57 | 65.9%(-10.5)#28,234 |
| 58. | 19901 | 52.5% | 63.8%(-11.3)#58 | 65.9%(-13.4)#28,755 |
| 59. | 19904 | 52.2% | 63.8%(-11.7)#59 | 65.9%(-13.7)#28,814 |
| 60. | 19703 | 51.5% | 63.8%(-12.3)#60 | 65.9%(-14.3)#28,914 |
| 61. | 19805 | 47.4% | 63.8%(-16.4)#61 | 65.9%(-18.5)#29,571 |
| 62. | 19702 | 43.6% | 63.8%(-20.3)#62 | 65.9%(-22.3)#30,095 |
| 63. | 19720 | 41.5% | 63.8%(-22.4)#63 | 65.9%(-24.4)#30,367 |
| 64. | 19733 | 39.9% | 63.8%(-23.9)#64 | 65.9%(-26.0)#30,528 |
| 65. | 19802 | 23.0% | 63.8%(-40.8)#65 | 65.9%(-42.9)#31,957 |
| 66. | 19801 | 18.4% | 63.8%(-45.4)#66 | 65.9%(-47.5)#32,224 |
1
Common Questions
What are the Top 10 Zip Codes with the Highest Percentage of White / Caucasian Population in Delaware?
Top 10 Zip Codes with the Highest Percentage of White / Caucasian Population in Delaware are:
What zip code has the Highest Percentage of White / Caucasian Population in Delaware?
19732 has the Highest Percentage of White / Caucasian Population in Delaware with 100.0%.
What is the Percentage of White / Caucasian Population in the State of Delaware?
Percentage of White / Caucasian Population in Delaware is 63.8%.
What is the Percentage of White / Caucasian Population in the United States?
Percentage of White / Caucasian Population in the United States is 65.9%.