Zip Codes with the Highest Percentage of Families with Income Above $100,000 in Delaware

RELATED REPORTS & OPTIONS

Family Income | $100k+
Population
Families and Households
Female Fertility
Female Fertility (Unmarried)
Race (Community Size)
Race (Percentage)
Ancestry (Community Size)
AfghanAfricanAlaska NativeAlaskan AthabascanAlbanianAleutAlsatianAmericanApacheArabArapahoArgentineanArmenianAssyrian / Chaldean / SyriacAustralianAustrianBahamianBangladeshiBarbadianBasqueBelgianBelizeanBermudanBhutaneseBlackfeetBolivianBrazilianBritishBritish West IndianBulgarianBurmeseCajunCambodianCanadianCape VerdeanCarpatho RusynCelticCentral AmericanCentral American IndianCherokeeCheyenneChickasawChileanChineseChippewaChoctawColombianColvilleComancheCosta RicanCreeCreekCroatianCrowCubanCypriotCzechCzechoslovakianDanishDelawareDominicanDutchDutch West IndianEastern EuropeanEcuadorianEgyptianEnglishEstonianEthiopianEuropeanFijianFilipinoFinnishFrenchFrench American IndianFrench CanadianGermanGerman RussianGhanaianGreekGuamanian / ChamorroGuatemalanGuyaneseHaitianHmongHonduranHopiHoumaHungarianIcelanderIndian (Asian)IndonesianInupiatIranianIraqiIrishIroquoisIsraeliItalianJamaicanJapaneseJordanianKenyanKiowaKoreanLaotianLatvianLebaneseLiberianLithuanianLumbeeLuxembourgerMacedonianMalaysianMalteseMarshalleseMenomineeMexicanMexican American IndianMongolianMoroccanNative HawaiianNavajoNepaleseNew ZealanderNicaraguanNigerianNorthern EuropeanNorwegianOkinawanOsageOttawaPaiutePakistaniPalestinianPanamanianParaguayanPennsylvania GermanPeruvianPimaPolishPortuguesePotawatomiPuebloPuerto RicanPuget Sound SalishRomanianRussianSalvadoranSamoanScandinavianScotch-IrishScottishSeminoleSenegaleseSerbianShoshoneSierra LeoneanSiouxSlavicSlovakSloveneSomaliSouth AfricanSouth AmericanSouth American IndianSoviet UnionSpaniardSpanishSpanish AmericanSpanish American IndianSri LankanSubsaharan AfricanSudaneseSwedishSwissSyrianTaiwaneseThaiTlingit-HaidaTohono O'OdhamTonganTrinidadian and TobagonianTsimshianTurkishU.S. Virgin IslanderUgandanUkrainianUruguayanUteVenezuelanVietnameseWelshWest IndianYakamaYaquiYugoslavianYumanYup'ikZimbabwean
Ancestry (Percentage)
AfghanAfricanAlaska NativeAlaskan AthabascanAlbanianAleutAlsatianAmericanApacheArabArapahoArgentineanArmenianAssyrian / Chaldean / SyriacAustralianAustrianBahamianBangladeshiBarbadianBasqueBelgianBelizeanBermudanBhutaneseBlackfeetBolivianBrazilianBritishBritish West IndianBulgarianBurmeseCajunCambodianCanadianCape VerdeanCarpatho RusynCelticCentral AmericanCentral American IndianCherokeeCheyenneChickasawChileanChineseChippewaChoctawColombianColvilleComancheCosta RicanCreeCreekCroatianCrowCubanCypriotCzechCzechoslovakianDanishDelawareDominicanDutchDutch West IndianEastern EuropeanEcuadorianEgyptianEnglishEstonianEthiopianEuropeanFijianFilipinoFinnishFrenchFrench American IndianFrench CanadianGermanGerman RussianGhanaianGreekGuamanian / ChamorroGuatemalanGuyaneseHaitianHmongHonduranHopiHoumaHungarianIcelanderIndian (Asian)IndonesianInupiatIranianIraqiIrishIroquoisIsraeliItalianJamaicanJapaneseJordanianKenyanKiowaKoreanLaotianLatvianLebaneseLiberianLithuanianLumbeeLuxembourgerMacedonianMalaysianMalteseMarshalleseMenomineeMexicanMexican American IndianMongolianMoroccanNative HawaiianNavajoNepaleseNew ZealanderNicaraguanNigerianNorthern EuropeanNorwegianOkinawanOsageOttawaPaiutePakistaniPalestinianPanamanianParaguayanPennsylvania GermanPeruvianPimaPolishPortuguesePotawatomiPuebloPuerto RicanPuget Sound SalishRomanianRussianSalvadoranSamoanScandinavianScotch-IrishScottishSeminoleSenegaleseSerbianShoshoneSierra LeoneanSiouxSlavicSlovakSloveneSomaliSouth AfricanSouth AmericanSouth American IndianSoviet UnionSpaniardSpanishSpanish AmericanSpanish American IndianSri LankanSubsaharan AfricanSudaneseSwedishSwissSyrianTaiwaneseThaiTlingit-HaidaTohono O'OdhamTonganTrinidadian and TobagonianTsimshianTurkishU.S. Virgin IslanderUgandanUkrainianUruguayanUteVenezuelanVietnameseWelshWest IndianYakamaYaquiYugoslavianYumanYup'ikZimbabwean
Immigrant Origin (Total)
AfghanistanAfricaAlbaniaArgentinaArmeniaAsiaAustraliaAustriaAzoresBahamasBangladeshBarbadosBelarusBelgiumBelizeBoliviaBosnia and HerzegovinaBrazilBulgariaBurma / MyanmarCabo VerdeCambodiaCameroonCanadaCaribbeanCentral AmericaChileChinaColombiaCongoCosta RicaCroatiaCubaCzechoslovakiaDenmarkDominicaDominican RepublicEastern AfricaEastern AsiaEastern EuropeEcuadorEgyptEl SalvadorEnglandEritreaEthiopiaEuropeFijiFranceGermanyGhanaGreeceGrenadaGuatemalaGuyanaHaitiHondurasHong KongHungaryIndiaIndonesiaIranIraqIrelandIsraelItalyJamaicaJapanJordanKazakhstanKenyaKoreaKuwaitLaosLatin AmericaLatviaLebanonLiberiaLithuaniaMalaysiaMexicoMicronesiaMiddle AfricaMoldovaMoroccoNepalNetherlandsNicaraguaNigeriaNorth MacedoniaNorthern AfricaNorthern EuropeNorwayOceaniaPakistanPanamaPeruPhilippinesPolandPortugalRomaniaRussiaSaudi ArabiaScotlandSenegalSerbiaSierra LeoneSingaporeSomaliaSouth AfricaSouth AmericaSouth Central AsiaSouth Eastern AsiaSouthern EuropeSpainSri LankaSt. Vincent and the GrenadinesSudanSwedenSwitzerlandSyriaTaiwanThailandTrinidad and TobagoTurkeyUgandaUkraineUruguayUzbekistanVenezuelaVietnamWest IndiesWestern AfricaWestern AsiaWestern EuropeYemenZaireZimbabwe
Immigrant Origin (Percentage)
AfghanistanAfricaAlbaniaArgentinaArmeniaAsiaAustraliaAustriaAzoresBahamasBangladeshBarbadosBelarusBelgiumBelizeBoliviaBosnia and HerzegovinaBrazilBulgariaBurma / MyanmarCabo VerdeCambodiaCameroonCanadaCaribbeanCentral AmericaChileChinaColombiaCongoCosta RicaCroatiaCubaCzechoslovakiaDenmarkDominicaDominican RepublicEastern AfricaEastern AsiaEastern EuropeEcuadorEgyptEl SalvadorEnglandEritreaEthiopiaEuropeFijiFranceGermanyGhanaGreeceGrenadaGuatemalaGuyanaHaitiHondurasHong KongHungaryIndiaIndonesiaIranIraqIrelandIsraelItalyJamaicaJapanJordanKazakhstanKenyaKoreaKuwaitLaosLatin AmericaLatviaLebanonLiberiaLithuaniaMalaysiaMexicoMicronesiaMiddle AfricaMoldovaMoroccoNepalNetherlandsNicaraguaNigeriaNorth MacedoniaNorthern AfricaNorthern EuropeNorwayOceaniaPakistanPanamaPeruPhilippinesPolandPortugalRomaniaRussiaSaudi ArabiaScotlandSenegalSerbiaSierra LeoneSingaporeSomaliaSouth AfricaSouth AmericaSouth Central AsiaSouth Eastern AsiaSouthern EuropeSpainSri LankaSt. Vincent and the GrenadinesSudanSwedenSwitzerlandSyriaTaiwanThailandTrinidad and TobagoTurkeyUgandaUkraineUruguayUzbekistanVenezuelaVietnamWest IndiesWestern AfricaWestern AsiaWestern EuropeYemenZaireZimbabwe
Income
Income (Families)
Income (Households)
Poverty
Poverty (Families)
Unemployment
Employment Occupations
Employment Industries
Employer Class
Commute Time
Commute Means
School Enrollment
Education by Degree Field
Occupancy
Finances
Physical Characteristics
Delaware
Compare Zip Codes
Comparison Subject

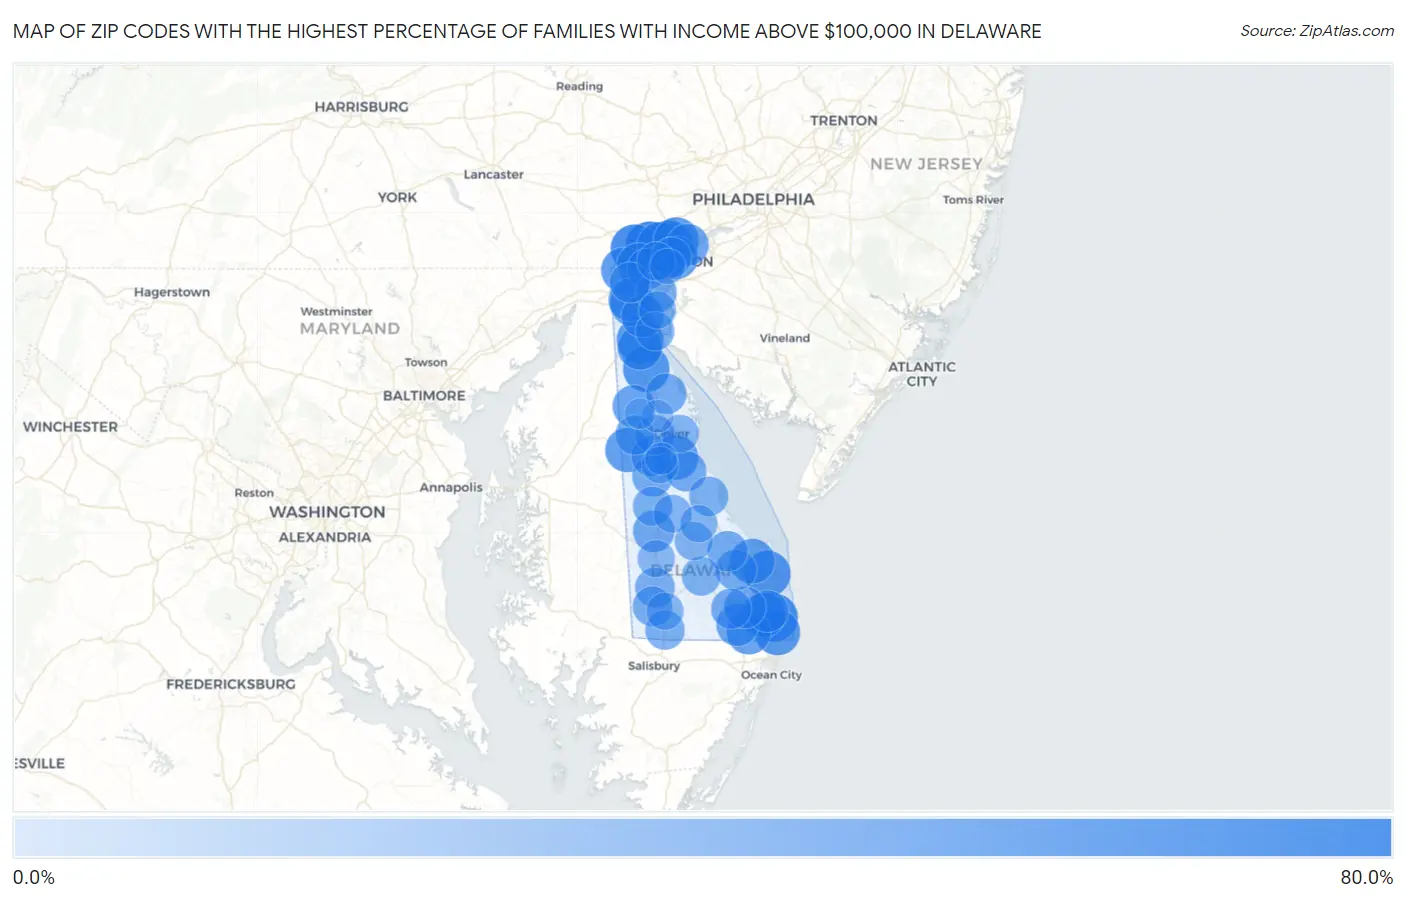
Map of Zip Codes with the Highest Percentage of Families with Income Above $100,000 in Delaware

0.0%
80.0%
Zip Codes with the Highest Percentage of Families with Income Above $100,000 in Delaware Map

Zip Codes with the Highest Percentage of Families with Income Above $100,000 in Delaware

Zip Code Families with Income > $100k vs State vs National
1.1980778.4%48.6%(+29.8)#146.1%(+32.3)#1,221
2.1980375.5%48.6%(+26.9)#246.1%(+29.4)#1,621
3.1970774.9%48.6%(+26.3)#346.1%(+28.8)#1,724
4.1993073.6%48.6%(+25.0)#446.1%(+27.5)#1,939
5.1980668.7%48.6%(+20.1)#546.1%(+22.6)#2,885
6.1970966.8%48.6%(+18.2)#646.1%(+20.7)#3,277
7.1973466.0%48.6%(+17.4)#746.1%(+19.9)#3,499
8.1997164.9%48.6%(+16.3)#846.1%(+18.8)#3,769
9.1973263.3%48.6%(+14.7)#946.1%(+17.2)#4,210
10.1994461.9%48.6%(+13.3)#1046.1%(+15.8)#4,587
11.1981060.8%48.6%(+12.2)#1146.1%(+14.7)#4,910
12.1971160.5%48.6%(+11.9)#1246.1%(+14.4)#4,993
13.1970159.5%48.6%(+10.9)#1346.1%(+13.4)#5,287
14.1995858.8%48.6%(+10.2)#1446.1%(+12.7)#5,510
15.1973058.1%48.6%(+9.50)#1546.1%(+12.0)#5,750
16.1996457.9%48.6%(+9.30)#1646.1%(+11.8)#5,817
17.1996757.3%48.6%(+8.70)#1746.1%(+11.2)#6,014
18.1996257.1%48.6%(+8.50)#1846.1%(+11.0)#6,069
19.1997555.8%48.6%(+7.20)#1946.1%(+9.70)#6,515
20.1980855.7%48.6%(+7.10)#2046.1%(+9.60)#6,538
21.1980952.8%48.6%(+4.20)#2146.1%(+6.70)#7,620
22.1970251.3%48.6%(+2.70)#2246.1%(+5.20)#8,271
23.1973349.0%48.6%(+0.400)#2346.1%(+2.90)#9,297
24.1970348.8%48.6%(+0.200)#2446.1%(+2.70)#9,361
25.1993848.6%48.6%(=0.000)#2546.1%(+2.50)#9,456
26.1994548.4%48.6%(-0.200)#2646.1%(+2.30)#9,562
27.1997046.8%48.6%(-1.80)#2746.1%(+0.700)#10,399
28.1993946.7%48.6%(-1.90)#2846.1%(+0.600)#10,458
29.1995045.3%48.6%(-3.30)#2946.1%(-0.800)#11,174
30.1995143.2%48.6%(-5.40)#3046.1%(-2.90)#12,390
31.1980443.1%48.6%(-5.50)#3146.1%(-3.00)#12,425
32.1972042.7%48.6%(-5.90)#3246.1%(-3.40)#12,675
33.1994342.0%48.6%(-6.60)#3346.1%(-4.10)#13,104
34.1997741.5%48.6%(-7.10)#3446.1%(-4.60)#13,404
35.1980241.3%48.6%(-7.30)#3546.1%(-4.80)#13,537
36.1971341.1%48.6%(-7.50)#3646.1%(-5.00)#13,657
37.1996841.1%48.6%(-7.50)#3746.1%(-5.00)#13,671
38.1996640.7%48.6%(-7.90)#3846.1%(-5.40)#13,915
39.1994640.7%48.6%(-7.90)#3946.1%(-5.40)#13,932
40.1993440.1%48.6%(-8.50)#4046.1%(-6.00)#14,321
41.1990437.9%48.6%(-10.7)#4146.1%(-8.20)#15,814
42.1997337.8%48.6%(-10.8)#4246.1%(-8.30)#15,896
43.1993137.7%48.6%(-10.9)#4346.1%(-8.40)#16,021
44.1995337.1%48.6%(-11.5)#4446.1%(-9.00)#16,457
45.1995236.6%48.6%(-12.0)#4546.1%(-9.50)#16,760
46.1994036.6%48.6%(-12.0)#4646.1%(-9.50)#16,765
47.1996336.1%48.6%(-12.5)#4746.1%(-10.0)#17,108
48.1994734.6%48.6%(-14.0)#4846.1%(-11.5)#18,177
49.1973134.2%48.6%(-14.4)#4946.1%(-11.9)#18,480
50.1980533.4%48.6%(-15.2)#5046.1%(-12.7)#18,979
51.1994132.0%48.6%(-16.6)#5146.1%(-14.1)#20,040
52.1995430.9%48.6%(-17.7)#5246.1%(-15.2)#20,814
53.1990129.9%48.6%(-18.7)#5346.1%(-16.2)#21,474
54.1970628.8%48.6%(-19.8)#5446.1%(-17.3)#22,268
55.1996028.6%48.6%(-20.0)#5546.1%(-17.5)#22,371
56.1995628.2%48.6%(-20.4)#5646.1%(-17.9)#22,636
57.1993328.2%48.6%(-20.4)#5746.1%(-17.9)#22,643
58.1997926.2%48.6%(-22.4)#5846.1%(-19.9)#23,987
59.1980120.4%48.6%(-28.2)#5946.1%(-25.7)#27,061
60.199369.4%48.6%(-39.2)#6046.1%(-36.7)#30,441
61.199806.7%48.6%(-41.9)#6146.1%(-39.4)#30,806
62.199551.2%48.6%(-47.4)#6246.1%(-44.9)#31,247

Common Questions

What are the Top 10 Zip Codes with the Highest Percentage of Families with Income Above $100,000 in Delaware?
Top 10 Zip Codes with the Highest Percentage of Families with Income Above $100,000 in Delaware are:
#1
78.4%
#2
75.5%
#3
74.9%
#4
73.6%
#5
68.7%
#6
66.8%
#7
66.0%
#8
64.9%
#9
63.3%
#10
61.9%
What zip code has the Highest Percentage of Families with Income Above $100,000 in Delaware?
19807 has the Highest Percentage of Families with Income Above $100,000 in Delaware with 78.4%.
What is the Percentage of Families with Income Above $100,000 in the State of Delaware?
Percentage of Families with Income Above $100,000 in Delaware is 48.6%.
What is the Percentage of Families with Income Above $100,000 in the United States?
Percentage of Families with Income Above $100,000 in the United States is 46.1%.