Zip Codes with the Highest Percentage of Households Heated by Fuel Oil / Kerosene in Delaware

RELATED REPORTS & OPTIONS

Fuel Oil Heating
Population
Families and Households
Female Fertility
Female Fertility (Unmarried)
Race (Community Size)
Race (Percentage)
Ancestry (Community Size)
AfghanAfricanAlaska NativeAlaskan AthabascanAlbanianAleutAlsatianAmericanApacheArabArapahoArgentineanArmenianAssyrian / Chaldean / SyriacAustralianAustrianBahamianBangladeshiBarbadianBasqueBelgianBelizeanBermudanBhutaneseBlackfeetBolivianBrazilianBritishBritish West IndianBulgarianBurmeseCajunCambodianCanadianCape VerdeanCarpatho RusynCelticCentral AmericanCentral American IndianCherokeeCheyenneChickasawChileanChineseChippewaChoctawColombianColvilleComancheCosta RicanCreeCreekCroatianCrowCubanCypriotCzechCzechoslovakianDanishDelawareDominicanDutchDutch West IndianEastern EuropeanEcuadorianEgyptianEnglishEstonianEthiopianEuropeanFijianFilipinoFinnishFrenchFrench American IndianFrench CanadianGermanGerman RussianGhanaianGreekGuamanian / ChamorroGuatemalanGuyaneseHaitianHmongHonduranHopiHoumaHungarianIcelanderIndian (Asian)IndonesianInupiatIranianIraqiIrishIroquoisIsraeliItalianJamaicanJapaneseJordanianKenyanKiowaKoreanLaotianLatvianLebaneseLiberianLithuanianLumbeeLuxembourgerMacedonianMalaysianMalteseMarshalleseMenomineeMexicanMexican American IndianMongolianMoroccanNative HawaiianNavajoNepaleseNew ZealanderNicaraguanNigerianNorthern EuropeanNorwegianOkinawanOsageOttawaPaiutePakistaniPalestinianPanamanianParaguayanPennsylvania GermanPeruvianPimaPolishPortuguesePotawatomiPuebloPuerto RicanPuget Sound SalishRomanianRussianSalvadoranSamoanScandinavianScotch-IrishScottishSeminoleSenegaleseSerbianShoshoneSierra LeoneanSiouxSlavicSlovakSloveneSomaliSouth AfricanSouth AmericanSouth American IndianSoviet UnionSpaniardSpanishSpanish AmericanSpanish American IndianSri LankanSubsaharan AfricanSudaneseSwedishSwissSyrianTaiwaneseThaiTlingit-HaidaTohono O'OdhamTonganTrinidadian and TobagonianTsimshianTurkishU.S. Virgin IslanderUgandanUkrainianUruguayanUteVenezuelanVietnameseWelshWest IndianYakamaYaquiYugoslavianYumanYup'ikZimbabwean
Ancestry (Percentage)
AfghanAfricanAlaska NativeAlaskan AthabascanAlbanianAleutAlsatianAmericanApacheArabArapahoArgentineanArmenianAssyrian / Chaldean / SyriacAustralianAustrianBahamianBangladeshiBarbadianBasqueBelgianBelizeanBermudanBhutaneseBlackfeetBolivianBrazilianBritishBritish West IndianBulgarianBurmeseCajunCambodianCanadianCape VerdeanCarpatho RusynCelticCentral AmericanCentral American IndianCherokeeCheyenneChickasawChileanChineseChippewaChoctawColombianColvilleComancheCosta RicanCreeCreekCroatianCrowCubanCypriotCzechCzechoslovakianDanishDelawareDominicanDutchDutch West IndianEastern EuropeanEcuadorianEgyptianEnglishEstonianEthiopianEuropeanFijianFilipinoFinnishFrenchFrench American IndianFrench CanadianGermanGerman RussianGhanaianGreekGuamanian / ChamorroGuatemalanGuyaneseHaitianHmongHonduranHopiHoumaHungarianIcelanderIndian (Asian)IndonesianInupiatIranianIraqiIrishIroquoisIsraeliItalianJamaicanJapaneseJordanianKenyanKiowaKoreanLaotianLatvianLebaneseLiberianLithuanianLumbeeLuxembourgerMacedonianMalaysianMalteseMarshalleseMenomineeMexicanMexican American IndianMongolianMoroccanNative HawaiianNavajoNepaleseNew ZealanderNicaraguanNigerianNorthern EuropeanNorwegianOkinawanOsageOttawaPaiutePakistaniPalestinianPanamanianParaguayanPennsylvania GermanPeruvianPimaPolishPortuguesePotawatomiPuebloPuerto RicanPuget Sound SalishRomanianRussianSalvadoranSamoanScandinavianScotch-IrishScottishSeminoleSenegaleseSerbianShoshoneSierra LeoneanSiouxSlavicSlovakSloveneSomaliSouth AfricanSouth AmericanSouth American IndianSoviet UnionSpaniardSpanishSpanish AmericanSpanish American IndianSri LankanSubsaharan AfricanSudaneseSwedishSwissSyrianTaiwaneseThaiTlingit-HaidaTohono O'OdhamTonganTrinidadian and TobagonianTsimshianTurkishU.S. Virgin IslanderUgandanUkrainianUruguayanUteVenezuelanVietnameseWelshWest IndianYakamaYaquiYugoslavianYumanYup'ikZimbabwean
Immigrant Origin (Total)
AfghanistanAfricaAlbaniaArgentinaArmeniaAsiaAustraliaAustriaAzoresBahamasBangladeshBarbadosBelarusBelgiumBelizeBoliviaBosnia and HerzegovinaBrazilBulgariaBurma / MyanmarCabo VerdeCambodiaCameroonCanadaCaribbeanCentral AmericaChileChinaColombiaCongoCosta RicaCroatiaCubaCzechoslovakiaDenmarkDominicaDominican RepublicEastern AfricaEastern AsiaEastern EuropeEcuadorEgyptEl SalvadorEnglandEritreaEthiopiaEuropeFijiFranceGermanyGhanaGreeceGrenadaGuatemalaGuyanaHaitiHondurasHong KongHungaryIndiaIndonesiaIranIraqIrelandIsraelItalyJamaicaJapanJordanKazakhstanKenyaKoreaKuwaitLaosLatin AmericaLatviaLebanonLiberiaLithuaniaMalaysiaMexicoMicronesiaMiddle AfricaMoldovaMoroccoNepalNetherlandsNicaraguaNigeriaNorth MacedoniaNorthern AfricaNorthern EuropeNorwayOceaniaPakistanPanamaPeruPhilippinesPolandPortugalRomaniaRussiaSaudi ArabiaScotlandSenegalSerbiaSierra LeoneSingaporeSomaliaSouth AfricaSouth AmericaSouth Central AsiaSouth Eastern AsiaSouthern EuropeSpainSri LankaSt. Vincent and the GrenadinesSudanSwedenSwitzerlandSyriaTaiwanThailandTrinidad and TobagoTurkeyUgandaUkraineUruguayUzbekistanVenezuelaVietnamWest IndiesWestern AfricaWestern AsiaWestern EuropeYemenZaireZimbabwe
Immigrant Origin (Percentage)
AfghanistanAfricaAlbaniaArgentinaArmeniaAsiaAustraliaAustriaAzoresBahamasBangladeshBarbadosBelarusBelgiumBelizeBoliviaBosnia and HerzegovinaBrazilBulgariaBurma / MyanmarCabo VerdeCambodiaCameroonCanadaCaribbeanCentral AmericaChileChinaColombiaCongoCosta RicaCroatiaCubaCzechoslovakiaDenmarkDominicaDominican RepublicEastern AfricaEastern AsiaEastern EuropeEcuadorEgyptEl SalvadorEnglandEritreaEthiopiaEuropeFijiFranceGermanyGhanaGreeceGrenadaGuatemalaGuyanaHaitiHondurasHong KongHungaryIndiaIndonesiaIranIraqIrelandIsraelItalyJamaicaJapanJordanKazakhstanKenyaKoreaKuwaitLaosLatin AmericaLatviaLebanonLiberiaLithuaniaMalaysiaMexicoMicronesiaMiddle AfricaMoldovaMoroccoNepalNetherlandsNicaraguaNigeriaNorth MacedoniaNorthern AfricaNorthern EuropeNorwayOceaniaPakistanPanamaPeruPhilippinesPolandPortugalRomaniaRussiaSaudi ArabiaScotlandSenegalSerbiaSierra LeoneSingaporeSomaliaSouth AfricaSouth AmericaSouth Central AsiaSouth Eastern AsiaSouthern EuropeSpainSri LankaSt. Vincent and the GrenadinesSudanSwedenSwitzerlandSyriaTaiwanThailandTrinidad and TobagoTurkeyUgandaUkraineUruguayUzbekistanVenezuelaVietnamWest IndiesWestern AfricaWestern AsiaWestern EuropeYemenZaireZimbabwe
Income
Income (Families)
Income (Households)
Poverty
Poverty (Families)
Unemployment
Employment Occupations
Employment Industries
Employer Class
Commute Time
Commute Means
School Enrollment
Education by Degree Field
Occupancy
Finances
Physical Characteristics
Delaware
Compare Zip Codes
Comparison Subject

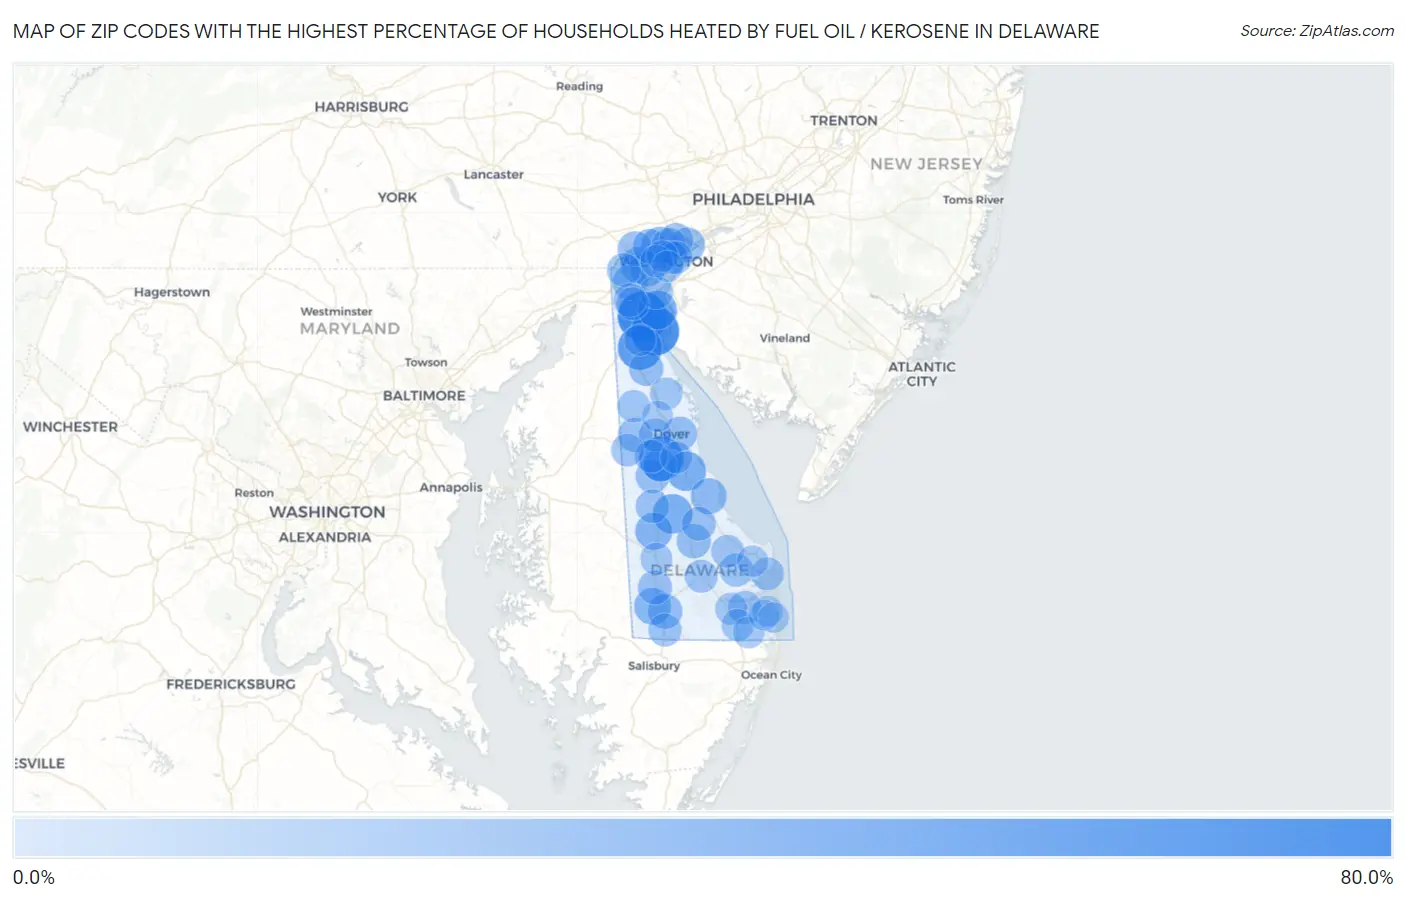
Map of Zip Codes with the Highest Percentage of Households Heated by Fuel Oil / Kerosene in Delaware

0.0%
80.0%
Zip Codes with the Highest Percentage of Households Heated by Fuel Oil / Kerosene in Delaware Map

Zip Codes with the Highest Percentage of Households Heated by Fuel Oil / Kerosene in Delaware

Zip Code Fuel Oil Heating vs State vs National
1.1973363.9%10.1%(+53.8)#14.2%(+59.7)#861
2.1973159.9%10.1%(+49.8)#24.2%(+55.7)#1,113
3.1998046.9%10.1%(+36.8)#34.2%(+42.7)#2,052
4.1973046.4%10.1%(+36.3)#44.2%(+42.2)#2,084
5.1994630.1%10.1%(+20.0)#54.2%(+25.9)#3,324
6.1995430.0%10.1%(+19.9)#64.2%(+25.8)#3,336
7.1970628.9%10.1%(+18.8)#74.2%(+24.7)#3,420
8.1995021.8%10.1%(+11.7)#84.2%(+17.6)#4,089
9.1993121.1%10.1%(+11.0)#94.2%(+16.9)#4,168
10.1973219.9%10.1%(+9.80)#104.2%(+15.7)#4,307
11.1980819.7%10.1%(+9.60)#114.2%(+15.5)#4,319
12.1996318.3%10.1%(+8.20)#124.2%(+14.1)#4,480
13.1971315.9%10.1%(+5.80)#134.2%(+11.7)#4,841
14.1980415.6%10.1%(+5.50)#144.2%(+11.4)#4,895
15.1970315.1%10.1%(+5.00)#154.2%(+10.9)#4,969
16.1970714.6%10.1%(+4.50)#164.2%(+10.4)#5,066
17.1995614.5%10.1%(+4.40)#174.2%(+10.3)#5,084
18.1980714.0%10.1%(+3.90)#184.2%(+9.80)#5,168
19.1980313.1%10.1%(+3.00)#194.2%(+8.90)#5,317
20.1990112.9%10.1%(+2.80)#204.2%(+8.70)#5,360
21.1973412.9%10.1%(+2.80)#214.2%(+8.70)#5,361
22.1994112.9%10.1%(+2.80)#224.2%(+8.70)#5,367
23.1997312.5%10.1%(+2.40)#234.2%(+8.30)#5,456
24.1995312.4%10.1%(+2.30)#244.2%(+8.20)#5,484
25.1996012.0%10.1%(+1.90)#254.2%(+7.80)#5,568
26.1981011.7%10.1%(+1.60)#264.2%(+7.50)#5,634
27.1994311.6%10.1%(+1.50)#274.2%(+7.40)#5,662
28.1995210.8%10.1%(+0.700)#284.2%(+6.60)#5,864
29.1997910.8%10.1%(+0.700)#294.2%(+6.60)#5,874
30.1971110.5%10.1%(+0.400)#304.2%(+6.30)#5,938
31.1972010.3%10.1%(+0.200)#314.2%(+6.10)#5,987
32.199399.8%10.1%(-0.300)#324.2%(+5.60)#6,119
33.199519.7%10.1%(-0.400)#334.2%(+5.50)#6,154
34.197029.6%10.1%(-0.500)#344.2%(+5.40)#6,164
35.199409.2%10.1%(-0.900)#354.2%(+5.00)#6,290
36.199048.6%10.1%(-1.50)#364.2%(+4.40)#6,477
37.199478.6%10.1%(-1.50)#374.2%(+4.40)#6,478
38.197018.5%10.1%(-1.60)#384.2%(+4.30)#6,507
39.199718.2%10.1%(-1.90)#394.2%(+4.00)#6,627
40.199348.2%10.1%(-1.90)#404.2%(+4.00)#6,628
41.198028.1%10.1%(-2.00)#414.2%(+3.90)#6,665
42.199688.1%10.1%(-2.00)#424.2%(+3.90)#6,666
43.199647.8%10.1%(-2.30)#434.2%(+3.60)#6,799
44.198097.2%10.1%(-2.90)#444.2%(+3.00)#7,025
45.199387.1%10.1%(-3.00)#454.2%(+2.90)#7,060
46.199776.8%10.1%(-3.30)#464.2%(+2.60)#7,186
47.198056.2%10.1%(-3.90)#474.2%(+2.00)#7,475
48.199666.2%10.1%(-3.90)#484.2%(+2.00)#7,476
49.199335.9%10.1%(-4.20)#494.2%(+1.70)#7,622
50.199455.8%10.1%(-4.30)#504.2%(+1.60)#7,676
51.199625.6%10.1%(-4.50)#514.2%(+1.40)#7,779
52.197095.1%10.1%(-5.00)#524.2%(+0.900)#8,054
53.198064.6%10.1%(-5.50)#534.2%(+0.400)#8,377
54.199754.2%10.1%(-5.90)#544.2%(=0.000)#8,648
55.199583.2%10.1%(-6.90)#554.2%(-1.00)#9,484
56.198012.9%10.1%(-7.20)#564.2%(-1.30)#9,769
57.199362.2%10.1%(-7.90)#574.2%(-2.00)#10,723
58.199701.2%10.1%(-8.90)#584.2%(-3.00)#12,332
59.199671.1%10.1%(-9.00)#594.2%(-3.10)#12,618
60.199300.50%10.1%(-9.60)#604.2%(-3.70)#14,614

Common Questions

What are the Top 10 Zip Codes with the Highest Percentage of Households Heated by Fuel Oil / Kerosene in Delaware?
Top 10 Zip Codes with the Highest Percentage of Households Heated by Fuel Oil / Kerosene in Delaware are:
#1
63.9%
#2
59.9%
#3
46.9%
#4
46.4%
#5
30.1%
#6
30.0%
#7
28.9%
#8
21.8%
#9
21.1%
#10
19.9%
What zip code has the Highest Percentage of Households Heated by Fuel Oil / Kerosene in Delaware?
19733 has the Highest Percentage of Households Heated by Fuel Oil / Kerosene in Delaware with 63.9%.
What is the Percentage of Households Heated by Fuel Oil / Kerosene in the State of Delaware?
Percentage of Households Heated by Fuel Oil / Kerosene in Delaware is 10.1%.
What is the Percentage of Households Heated by Fuel Oil / Kerosene in the United States?
Percentage of Households Heated by Fuel Oil / Kerosene in the United States is 4.2%.