Zip Codes with the Highest Percentage of Population Employed in Community & Social Service in Delaware

RELATED REPORTS & OPTIONS

Community & Social Service
Population
Families and Households
Female Fertility
Female Fertility (Unmarried)
Race (Community Size)
Race (Percentage)
Ancestry (Community Size)
AfghanAfricanAlaska NativeAlaskan AthabascanAlbanianAleutAlsatianAmericanApacheArabArapahoArgentineanArmenianAssyrian / Chaldean / SyriacAustralianAustrianBahamianBangladeshiBarbadianBasqueBelgianBelizeanBermudanBhutaneseBlackfeetBolivianBrazilianBritishBritish West IndianBulgarianBurmeseCajunCambodianCanadianCape VerdeanCarpatho RusynCelticCentral AmericanCentral American IndianCherokeeCheyenneChickasawChileanChineseChippewaChoctawColombianColvilleComancheCosta RicanCreeCreekCroatianCrowCubanCypriotCzechCzechoslovakianDanishDelawareDominicanDutchDutch West IndianEastern EuropeanEcuadorianEgyptianEnglishEstonianEthiopianEuropeanFijianFilipinoFinnishFrenchFrench American IndianFrench CanadianGermanGerman RussianGhanaianGreekGuamanian / ChamorroGuatemalanGuyaneseHaitianHmongHonduranHopiHoumaHungarianIcelanderIndian (Asian)IndonesianInupiatIranianIraqiIrishIroquoisIsraeliItalianJamaicanJapaneseJordanianKenyanKiowaKoreanLaotianLatvianLebaneseLiberianLithuanianLumbeeLuxembourgerMacedonianMalaysianMalteseMarshalleseMenomineeMexicanMexican American IndianMongolianMoroccanNative HawaiianNavajoNepaleseNew ZealanderNicaraguanNigerianNorthern EuropeanNorwegianOkinawanOsageOttawaPaiutePakistaniPalestinianPanamanianParaguayanPennsylvania GermanPeruvianPimaPolishPortuguesePotawatomiPuebloPuerto RicanPuget Sound SalishRomanianRussianSalvadoranSamoanScandinavianScotch-IrishScottishSeminoleSenegaleseSerbianShoshoneSierra LeoneanSiouxSlavicSlovakSloveneSomaliSouth AfricanSouth AmericanSouth American IndianSoviet UnionSpaniardSpanishSpanish AmericanSpanish American IndianSri LankanSubsaharan AfricanSudaneseSwedishSwissSyrianTaiwaneseThaiTlingit-HaidaTohono O'OdhamTonganTrinidadian and TobagonianTsimshianTurkishU.S. Virgin IslanderUgandanUkrainianUruguayanUteVenezuelanVietnameseWelshWest IndianYakamaYaquiYugoslavianYumanYup'ikZimbabwean
Ancestry (Percentage)
AfghanAfricanAlaska NativeAlaskan AthabascanAlbanianAleutAlsatianAmericanApacheArabArapahoArgentineanArmenianAssyrian / Chaldean / SyriacAustralianAustrianBahamianBangladeshiBarbadianBasqueBelgianBelizeanBermudanBhutaneseBlackfeetBolivianBrazilianBritishBritish West IndianBulgarianBurmeseCajunCambodianCanadianCape VerdeanCarpatho RusynCelticCentral AmericanCentral American IndianCherokeeCheyenneChickasawChileanChineseChippewaChoctawColombianColvilleComancheCosta RicanCreeCreekCroatianCrowCubanCypriotCzechCzechoslovakianDanishDelawareDominicanDutchDutch West IndianEastern EuropeanEcuadorianEgyptianEnglishEstonianEthiopianEuropeanFijianFilipinoFinnishFrenchFrench American IndianFrench CanadianGermanGerman RussianGhanaianGreekGuamanian / ChamorroGuatemalanGuyaneseHaitianHmongHonduranHopiHoumaHungarianIcelanderIndian (Asian)IndonesianInupiatIranianIraqiIrishIroquoisIsraeliItalianJamaicanJapaneseJordanianKenyanKiowaKoreanLaotianLatvianLebaneseLiberianLithuanianLumbeeLuxembourgerMacedonianMalaysianMalteseMarshalleseMenomineeMexicanMexican American IndianMongolianMoroccanNative HawaiianNavajoNepaleseNew ZealanderNicaraguanNigerianNorthern EuropeanNorwegianOkinawanOsageOttawaPaiutePakistaniPalestinianPanamanianParaguayanPennsylvania GermanPeruvianPimaPolishPortuguesePotawatomiPuebloPuerto RicanPuget Sound SalishRomanianRussianSalvadoranSamoanScandinavianScotch-IrishScottishSeminoleSenegaleseSerbianShoshoneSierra LeoneanSiouxSlavicSlovakSloveneSomaliSouth AfricanSouth AmericanSouth American IndianSoviet UnionSpaniardSpanishSpanish AmericanSpanish American IndianSri LankanSubsaharan AfricanSudaneseSwedishSwissSyrianTaiwaneseThaiTlingit-HaidaTohono O'OdhamTonganTrinidadian and TobagonianTsimshianTurkishU.S. Virgin IslanderUgandanUkrainianUruguayanUteVenezuelanVietnameseWelshWest IndianYakamaYaquiYugoslavianYumanYup'ikZimbabwean
Immigrant Origin (Total)
AfghanistanAfricaAlbaniaArgentinaArmeniaAsiaAustraliaAustriaAzoresBahamasBangladeshBarbadosBelarusBelgiumBelizeBoliviaBosnia and HerzegovinaBrazilBulgariaBurma / MyanmarCabo VerdeCambodiaCameroonCanadaCaribbeanCentral AmericaChileChinaColombiaCongoCosta RicaCroatiaCubaCzechoslovakiaDenmarkDominicaDominican RepublicEastern AfricaEastern AsiaEastern EuropeEcuadorEgyptEl SalvadorEnglandEritreaEthiopiaEuropeFijiFranceGermanyGhanaGreeceGrenadaGuatemalaGuyanaHaitiHondurasHong KongHungaryIndiaIndonesiaIranIraqIrelandIsraelItalyJamaicaJapanJordanKazakhstanKenyaKoreaKuwaitLaosLatin AmericaLatviaLebanonLiberiaLithuaniaMalaysiaMexicoMicronesiaMiddle AfricaMoldovaMoroccoNepalNetherlandsNicaraguaNigeriaNorth MacedoniaNorthern AfricaNorthern EuropeNorwayOceaniaPakistanPanamaPeruPhilippinesPolandPortugalRomaniaRussiaSaudi ArabiaScotlandSenegalSerbiaSierra LeoneSingaporeSomaliaSouth AfricaSouth AmericaSouth Central AsiaSouth Eastern AsiaSouthern EuropeSpainSri LankaSt. Vincent and the GrenadinesSudanSwedenSwitzerlandSyriaTaiwanThailandTrinidad and TobagoTurkeyUgandaUkraineUruguayUzbekistanVenezuelaVietnamWest IndiesWestern AfricaWestern AsiaWestern EuropeYemenZaireZimbabwe
Immigrant Origin (Percentage)
AfghanistanAfricaAlbaniaArgentinaArmeniaAsiaAustraliaAustriaAzoresBahamasBangladeshBarbadosBelarusBelgiumBelizeBoliviaBosnia and HerzegovinaBrazilBulgariaBurma / MyanmarCabo VerdeCambodiaCameroonCanadaCaribbeanCentral AmericaChileChinaColombiaCongoCosta RicaCroatiaCubaCzechoslovakiaDenmarkDominicaDominican RepublicEastern AfricaEastern AsiaEastern EuropeEcuadorEgyptEl SalvadorEnglandEritreaEthiopiaEuropeFijiFranceGermanyGhanaGreeceGrenadaGuatemalaGuyanaHaitiHondurasHong KongHungaryIndiaIndonesiaIranIraqIrelandIsraelItalyJamaicaJapanJordanKazakhstanKenyaKoreaKuwaitLaosLatin AmericaLatviaLebanonLiberiaLithuaniaMalaysiaMexicoMicronesiaMiddle AfricaMoldovaMoroccoNepalNetherlandsNicaraguaNigeriaNorth MacedoniaNorthern AfricaNorthern EuropeNorwayOceaniaPakistanPanamaPeruPhilippinesPolandPortugalRomaniaRussiaSaudi ArabiaScotlandSenegalSerbiaSierra LeoneSingaporeSomaliaSouth AfricaSouth AmericaSouth Central AsiaSouth Eastern AsiaSouthern EuropeSpainSri LankaSt. Vincent and the GrenadinesSudanSwedenSwitzerlandSyriaTaiwanThailandTrinidad and TobagoTurkeyUgandaUkraineUruguayUzbekistanVenezuelaVietnamWest IndiesWestern AfricaWestern AsiaWestern EuropeYemenZaireZimbabwe
Income
Income (Families)
Income (Households)
Poverty
Poverty (Families)
Unemployment
Employment Occupations
Employment Industries
Employer Class
Commute Time
Commute Means
School Enrollment
Education by Degree Field
Occupancy
Finances
Physical Characteristics
Delaware
Compare Zip Codes
Comparison Subject

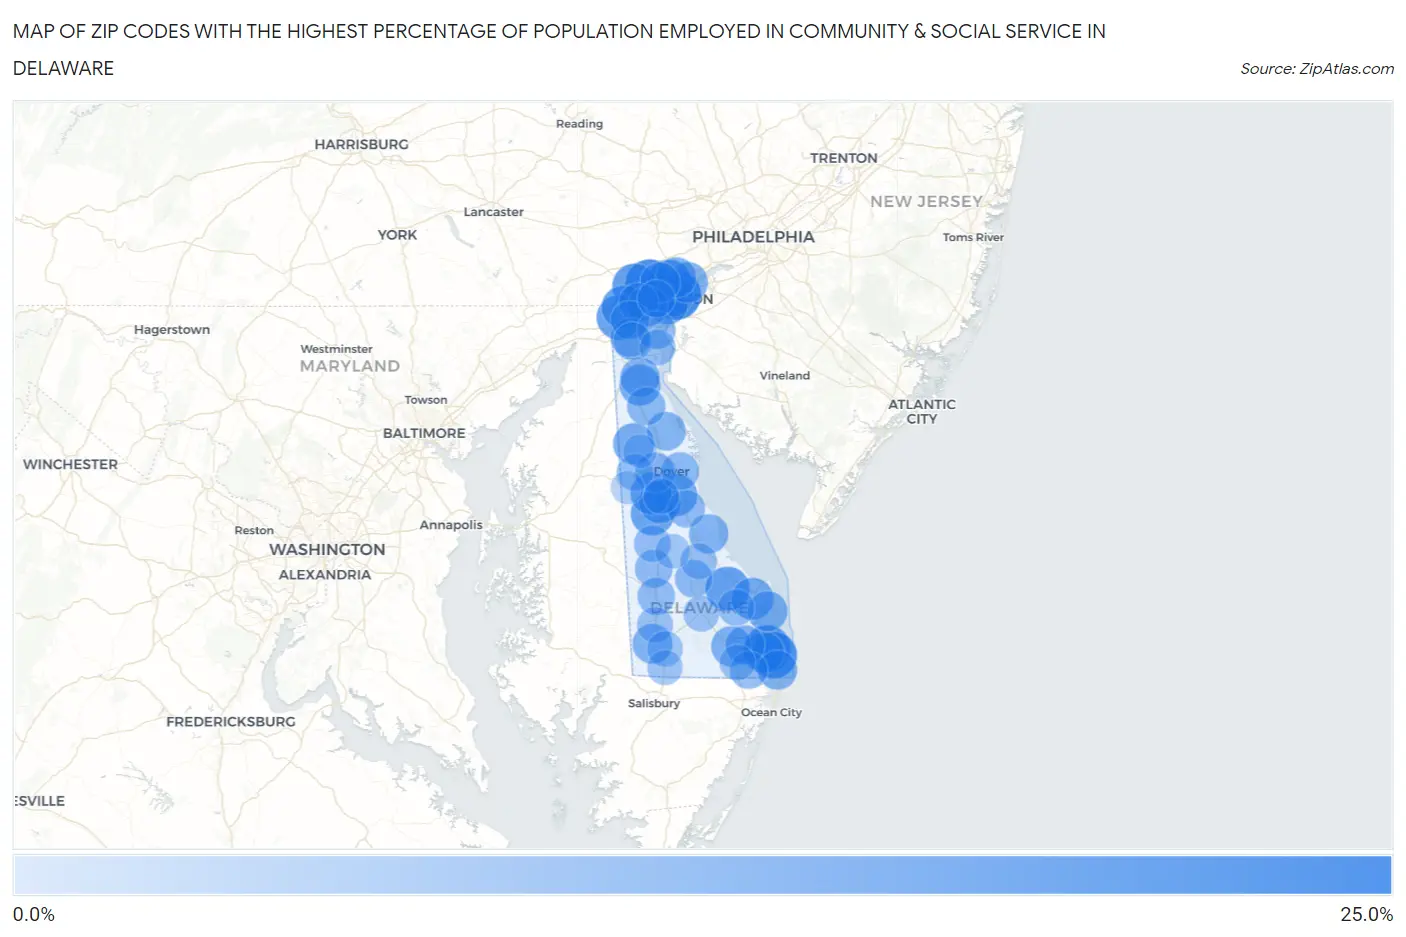
Map of Zip Codes with the Highest Percentage of Population Employed in Community & Social Service in Delaware

0.0%
25.0%
Zip Codes with the Highest Percentage of Population Employed in Community & Social Service  in Delaware Map

Zip Codes with the Highest Percentage of Population Employed in Community & Social Service in Delaware

Zip Code % Employed vs State vs National
1.1980922.0%11.2%(+10.8)#111.2%(+10.8)#1,482
2.1980621.5%11.2%(+10.3)#211.2%(+10.3)#1,583
3.1980721.0%11.2%(+9.84)#311.2%(+9.82)#1,707
4.1997018.9%11.2%(+7.69)#411.2%(+7.68)#2,437
5.1993018.7%11.2%(+7.49)#511.2%(+7.47)#2,517
6.1980317.5%11.2%(+6.26)#611.2%(+6.24)#3,081
7.1970717.0%11.2%(+5.84)#711.2%(+5.82)#3,355
8.1971716.0%11.2%(+4.77)#811.2%(+4.76)#4,086
9.1971116.0%11.2%(+4.77)#911.2%(+4.75)#4,091
10.1980215.9%11.2%(+4.67)#1011.2%(+4.65)#4,176
11.1996815.8%11.2%(+4.61)#1111.2%(+4.60)#4,226
12.1994314.9%11.2%(+3.73)#1211.2%(+3.72)#5,032
13.1996213.5%11.2%(+2.31)#1311.2%(+2.29)#6,743
14.1995813.5%11.2%(+2.26)#1411.2%(+2.25)#6,806
15.1997913.3%11.2%(+2.07)#1511.2%(+2.05)#7,132
16.1993412.9%11.2%(+1.72)#1611.2%(+1.71)#7,694
17.1993812.5%11.2%(+1.33)#1711.2%(+1.32)#8,354
18.1996712.4%11.2%(+1.24)#1811.2%(+1.23)#8,521
19.1980112.4%11.2%(+1.21)#1911.2%(+1.20)#8,575
20.1973012.2%11.2%(+1.01)#2011.2%(+1.000)#8,942
21.1970312.1%11.2%(+0.946)#2111.2%(+0.931)#9,066
22.1981011.5%11.2%(+0.282)#2211.2%(+0.267)#10,497
23.1980411.5%11.2%(+0.259)#2311.2%(+0.243)#10,551
24.1973211.4%11.2%(+0.210)#2411.2%(+0.195)#10,645
25.1997111.4%11.2%(+0.165)#2511.2%(+0.150)#10,748
26.1996611.3%11.2%(+0.090)#2611.2%(+0.074)#10,916
27.1993110.9%11.2%(-0.275)#2711.2%(-0.290)#11,835
28.1990410.8%11.2%(-0.355)#2811.2%(-0.370)#12,026
29.1980810.5%11.2%(-0.748)#2911.2%(-0.763)#12,991
30.1970910.4%11.2%(-0.760)#3011.2%(-0.775)#13,017
31.1994410.4%11.2%(-0.833)#3111.2%(-0.848)#13,197
32.1993910.4%11.2%(-0.833)#3211.2%(-0.849)#13,199
33.1996310.3%11.2%(-0.884)#3311.2%(-0.900)#13,321
34.199779.9%11.2%(-1.31)#3411.2%(-1.33)#14,445
35.197029.8%11.2%(-1.42)#3511.2%(-1.44)#14,699
36.197139.4%11.2%(-1.78)#3611.2%(-1.80)#15,640
37.197209.2%11.2%(-2.02)#3711.2%(-2.04)#16,331
38.197349.2%11.2%(-2.04)#3811.2%(-2.06)#16,385
39.197019.1%11.2%(-2.07)#3911.2%(-2.08)#16,453
40.199018.9%11.2%(-2.28)#4011.2%(-2.29)#17,035
41.199758.6%11.2%(-2.63)#4111.2%(-2.65)#17,992
42.199508.4%11.2%(-2.80)#4211.2%(-2.82)#18,471
43.199418.3%11.2%(-2.86)#4311.2%(-2.87)#18,625
44.199468.3%11.2%(-2.92)#4411.2%(-2.93)#18,812
45.199338.3%11.2%(-2.94)#4511.2%(-2.96)#18,864
46.198058.2%11.2%(-3.04)#4611.2%(-3.06)#19,151
47.199527.6%11.2%(-3.64)#4711.2%(-3.65)#20,736
48.199537.4%11.2%(-3.80)#4811.2%(-3.81)#21,156
49.199517.2%11.2%(-3.98)#4911.2%(-4.00)#21,607
50.199606.9%11.2%(-4.34)#5011.2%(-4.35)#22,474
51.197066.6%11.2%(-4.64)#5111.2%(-4.65)#23,118
52.199736.5%11.2%(-4.71)#5211.2%(-4.72)#23,281
53.199456.4%11.2%(-4.80)#5311.2%(-4.82)#23,502
54.199476.3%11.2%(-4.94)#5411.2%(-4.95)#23,797
55.199806.2%11.2%(-4.95)#5511.2%(-4.96)#23,849
56.199566.1%11.2%(-5.14)#5611.2%(-5.16)#24,257
57.199405.5%11.2%(-5.68)#5711.2%(-5.70)#25,305
58.199545.0%11.2%(-6.15)#5811.2%(-6.17)#26,115
59.199554.1%11.2%(-7.09)#5911.2%(-7.10)#27,424
60.199643.3%11.2%(-7.92)#6011.2%(-7.94)#28,302

Common Questions

What are the Top 10 Zip Codes with the Highest Percentage of Population Employed in Community & Social Service in Delaware?
Top 10 Zip Codes with the Highest Percentage of Population Employed in Community & Social Service in Delaware are:
#1
22.0%
#2
21.5%
#3
21.0%
#4
18.9%
#5
18.7%
#6
17.5%
#7
17.0%
#8
16.0%
#9
16.0%
#10
15.9%
What zip code has the Highest Percentage of Population Employed in Community & Social Service in Delaware?
19809 has the Highest Percentage of Population Employed in Community & Social Service in Delaware with 22.0%.
What is the Percentage of Population Employed in Community & Social Service in the State of Delaware?
Percentage of Population Employed in Community & Social Service in Delaware is 11.2%.
What is the Percentage of Population Employed in Community & Social Service in the United States?
Percentage of Population Employed in Community & Social Service in the United States is 11.2%.