Zip Codes with the Highest Percentage of Population Employed in Education Instruction & Library in Delaware
RELATED REPORTS & OPTIONS
Education Instruction & Library
Delaware
Compare Zip Codes
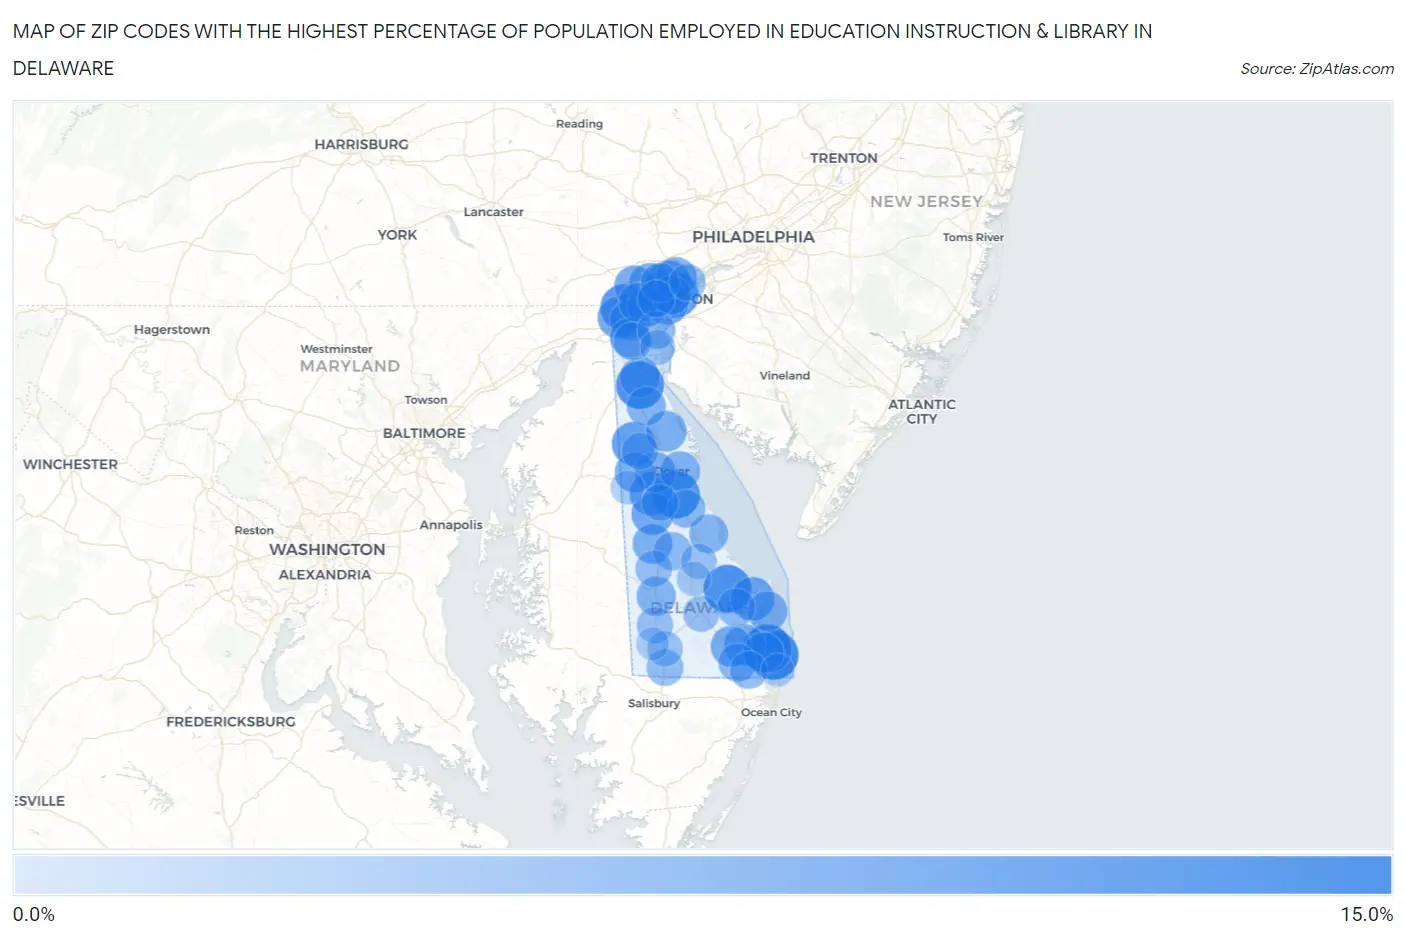
Map of Zip Codes with the Highest Percentage of Population Employed in Education Instruction & Library in Delaware
0.0%
15.0%
Zip Codes with the Highest Percentage of Population Employed in Education Instruction & Library in Delaware
| Zip Code | % Employed | vs State | vs National | |
| 1. | 19930 | 12.1% | 6.3%(+5.79)#1 | 6.2%(+5.93)#2,332 |
| 2. | 19970 | 11.6% | 6.3%(+5.31)#2 | 6.2%(+5.44)#2,612 |
| 3. | 19730 | 11.1% | 6.3%(+4.75)#3 | 6.2%(+4.89)#3,015 |
| 4. | 19968 | 11.1% | 6.3%(+4.74)#4 | 6.2%(+4.87)#3,023 |
| 5. | 19962 | 10.7% | 6.3%(+4.40)#5 | 6.2%(+4.53)#3,261 |
| 6. | 19711 | 10.3% | 6.3%(+3.97)#6 | 6.2%(+4.10)#3,656 |
| 7. | 19809 | 9.2% | 6.3%(+2.88)#7 | 6.2%(+3.01)#4,947 |
| 8. | 19803 | 8.6% | 6.3%(+2.31)#8 | 6.2%(+2.44)#5,883 |
| 9. | 19938 | 8.5% | 6.3%(+2.16)#9 | 6.2%(+2.29)#6,145 |
| 10. | 19958 | 8.3% | 6.3%(+2.03)#10 | 6.2%(+2.16)#6,414 |
| 11. | 19806 | 8.3% | 6.3%(+1.95)#11 | 6.2%(+2.08)#6,591 |
| 12. | 19934 | 8.1% | 6.3%(+1.80)#12 | 6.2%(+1.93)#6,893 |
| 13. | 19717 | 7.6% | 6.3%(+1.27)#13 | 6.2%(+1.40)#8,226 |
| 14. | 19943 | 7.4% | 6.3%(+1.11)#14 | 6.2%(+1.24)#8,646 |
| 15. | 19801 | 7.2% | 6.3%(+0.848)#15 | 6.2%(+0.981)#9,383 |
| 16. | 19807 | 7.1% | 6.3%(+0.799)#16 | 6.2%(+0.931)#9,527 |
| 17. | 19707 | 7.1% | 6.3%(+0.773)#17 | 6.2%(+0.905)#9,633 |
| 18. | 19939 | 7.0% | 6.3%(+0.681)#18 | 6.2%(+0.813)#9,918 |
| 19. | 19966 | 6.7% | 6.3%(+0.407)#19 | 6.2%(+0.539)#10,837 |
| 20. | 19904 | 6.6% | 6.3%(+0.276)#20 | 6.2%(+0.409)#11,293 |
| 21. | 19977 | 6.6% | 6.3%(+0.249)#21 | 6.2%(+0.381)#11,381 |
| 22. | 19810 | 6.5% | 6.3%(+0.172)#22 | 6.2%(+0.304)#11,652 |
| 23. | 19953 | 6.5% | 6.3%(+0.154)#23 | 6.2%(+0.286)#11,712 |
| 24. | 19967 | 6.4% | 6.3%(+0.061)#24 | 6.2%(+0.193)#12,076 |
| 25. | 19713 | 6.2% | 6.3%(-0.079)#25 | 6.2%(+0.053)#12,621 |
| 26. | 19804 | 6.2% | 6.3%(-0.090)#26 | 6.2%(+0.042)#12,672 |
| 27. | 19709 | 6.2% | 6.3%(-0.125)#27 | 6.2%(+0.007)#12,798 |
| 28. | 19702 | 6.1% | 6.3%(-0.167)#28 | 6.2%(-0.035)#12,952 |
| 29. | 19971 | 6.1% | 6.3%(-0.259)#29 | 6.2%(-0.126)#13,288 |
| 30. | 19808 | 6.0% | 6.3%(-0.300)#30 | 6.2%(-0.167)#13,437 |
| 31. | 19952 | 6.0% | 6.3%(-0.347)#31 | 6.2%(-0.214)#13,624 |
| 32. | 19901 | 6.0% | 6.3%(-0.359)#32 | 6.2%(-0.226)#13,668 |
| 33. | 19802 | 5.8% | 6.3%(-0.483)#33 | 6.2%(-0.351)#14,182 |
| 34. | 19933 | 5.6% | 6.3%(-0.683)#34 | 6.2%(-0.551)#15,029 |
| 35. | 19734 | 5.5% | 6.3%(-0.786)#35 | 6.2%(-0.653)#15,429 |
| 36. | 19963 | 5.4% | 6.3%(-0.901)#36 | 6.2%(-0.769)#15,927 |
| 37. | 19732 | 5.4% | 6.3%(-0.947)#37 | 6.2%(-0.814)#16,112 |
| 38. | 19946 | 5.0% | 6.3%(-1.31)#38 | 6.2%(-1.18)#17,642 |
| 39. | 19701 | 4.9% | 6.3%(-1.37)#39 | 6.2%(-1.24)#17,876 |
| 40. | 19945 | 4.9% | 6.3%(-1.37)#40 | 6.2%(-1.24)#17,884 |
| 41. | 19954 | 4.9% | 6.3%(-1.40)#41 | 6.2%(-1.27)#18,001 |
| 42. | 19951 | 4.9% | 6.3%(-1.43)#42 | 6.2%(-1.30)#18,139 |
| 43. | 19975 | 4.8% | 6.3%(-1.55)#43 | 6.2%(-1.42)#18,639 |
| 44. | 19720 | 4.8% | 6.3%(-1.56)#44 | 6.2%(-1.42)#18,685 |
| 45. | 19805 | 4.4% | 6.3%(-1.92)#45 | 6.2%(-1.78)#20,143 |
| 46. | 19940 | 4.1% | 6.3%(-2.18)#46 | 6.2%(-2.05)#21,153 |
| 47. | 19703 | 4.1% | 6.3%(-2.20)#47 | 6.2%(-2.07)#21,257 |
| 48. | 19955 | 4.1% | 6.3%(-2.21)#48 | 6.2%(-2.07)#21,270 |
| 49. | 19979 | 4.1% | 6.3%(-2.23)#49 | 6.2%(-2.10)#21,366 |
| 50. | 19950 | 4.0% | 6.3%(-2.27)#50 | 6.2%(-2.14)#21,497 |
| 51. | 19973 | 3.8% | 6.3%(-2.54)#51 | 6.2%(-2.41)#22,489 |
| 52. | 19947 | 3.7% | 6.3%(-2.63)#52 | 6.2%(-2.50)#22,776 |
| 53. | 19956 | 3.4% | 6.3%(-2.93)#53 | 6.2%(-2.79)#23,691 |
| 54. | 19960 | 3.3% | 6.3%(-3.02)#54 | 6.2%(-2.89)#24,032 |
| 55. | 19706 | 3.1% | 6.3%(-3.20)#55 | 6.2%(-3.07)#24,567 |
| 56. | 19941 | 2.5% | 6.3%(-3.77)#56 | 6.2%(-3.64)#25,918 |
| 57. | 19964 | 2.2% | 6.3%(-4.13)#57 | 6.2%(-4.00)#26,622 |
| 58. | 19944 | 1.8% | 6.3%(-4.49)#58 | 6.2%(-4.35)#27,206 |
| 59. | 19931 | 1.7% | 6.3%(-4.63)#59 | 6.2%(-4.50)#27,420 |
1
Common Questions
What are the Top 10 Zip Codes with the Highest Percentage of Population Employed in Education Instruction & Library in Delaware?
Top 10 Zip Codes with the Highest Percentage of Population Employed in Education Instruction & Library in Delaware are:
What zip code has the Highest Percentage of Population Employed in Education Instruction & Library in Delaware?
19930 has the Highest Percentage of Population Employed in Education Instruction & Library in Delaware with 12.1%.
What is the Percentage of Population Employed in Education Instruction & Library in the State of Delaware?
Percentage of Population Employed in Education Instruction & Library in Delaware is 6.3%.
What is the Percentage of Population Employed in Education Instruction & Library in the United States?
Percentage of Population Employed in Education Instruction & Library in the United States is 6.2%.