Zip Codes with the Highest Percentage of Population Employed in Legal Services & Support in Delaware

RELATED REPORTS & OPTIONS

Legal Services & Support
Population
Families and Households
Female Fertility
Female Fertility (Unmarried)
Race (Community Size)
Race (Percentage)
Ancestry (Community Size)
AfghanAfricanAlaska NativeAlaskan AthabascanAlbanianAleutAlsatianAmericanApacheArabArapahoArgentineanArmenianAssyrian / Chaldean / SyriacAustralianAustrianBahamianBangladeshiBarbadianBasqueBelgianBelizeanBermudanBhutaneseBlackfeetBolivianBrazilianBritishBritish West IndianBulgarianBurmeseCajunCambodianCanadianCape VerdeanCarpatho RusynCelticCentral AmericanCentral American IndianCherokeeCheyenneChickasawChileanChineseChippewaChoctawColombianColvilleComancheCosta RicanCreeCreekCroatianCrowCubanCypriotCzechCzechoslovakianDanishDelawareDominicanDutchDutch West IndianEastern EuropeanEcuadorianEgyptianEnglishEstonianEthiopianEuropeanFijianFilipinoFinnishFrenchFrench American IndianFrench CanadianGermanGerman RussianGhanaianGreekGuamanian / ChamorroGuatemalanGuyaneseHaitianHmongHonduranHopiHoumaHungarianIcelanderIndian (Asian)IndonesianInupiatIranianIraqiIrishIroquoisIsraeliItalianJamaicanJapaneseJordanianKenyanKiowaKoreanLaotianLatvianLebaneseLiberianLithuanianLumbeeLuxembourgerMacedonianMalaysianMalteseMarshalleseMenomineeMexicanMexican American IndianMongolianMoroccanNative HawaiianNavajoNepaleseNew ZealanderNicaraguanNigerianNorthern EuropeanNorwegianOkinawanOsageOttawaPaiutePakistaniPalestinianPanamanianParaguayanPennsylvania GermanPeruvianPimaPolishPortuguesePotawatomiPuebloPuerto RicanPuget Sound SalishRomanianRussianSalvadoranSamoanScandinavianScotch-IrishScottishSeminoleSenegaleseSerbianShoshoneSierra LeoneanSiouxSlavicSlovakSloveneSomaliSouth AfricanSouth AmericanSouth American IndianSoviet UnionSpaniardSpanishSpanish AmericanSpanish American IndianSri LankanSubsaharan AfricanSudaneseSwedishSwissSyrianTaiwaneseThaiTlingit-HaidaTohono O'OdhamTonganTrinidadian and TobagonianTsimshianTurkishU.S. Virgin IslanderUgandanUkrainianUruguayanUteVenezuelanVietnameseWelshWest IndianYakamaYaquiYugoslavianYumanYup'ikZimbabwean
Ancestry (Percentage)
AfghanAfricanAlaska NativeAlaskan AthabascanAlbanianAleutAlsatianAmericanApacheArabArapahoArgentineanArmenianAssyrian / Chaldean / SyriacAustralianAustrianBahamianBangladeshiBarbadianBasqueBelgianBelizeanBermudanBhutaneseBlackfeetBolivianBrazilianBritishBritish West IndianBulgarianBurmeseCajunCambodianCanadianCape VerdeanCarpatho RusynCelticCentral AmericanCentral American IndianCherokeeCheyenneChickasawChileanChineseChippewaChoctawColombianColvilleComancheCosta RicanCreeCreekCroatianCrowCubanCypriotCzechCzechoslovakianDanishDelawareDominicanDutchDutch West IndianEastern EuropeanEcuadorianEgyptianEnglishEstonianEthiopianEuropeanFijianFilipinoFinnishFrenchFrench American IndianFrench CanadianGermanGerman RussianGhanaianGreekGuamanian / ChamorroGuatemalanGuyaneseHaitianHmongHonduranHopiHoumaHungarianIcelanderIndian (Asian)IndonesianInupiatIranianIraqiIrishIroquoisIsraeliItalianJamaicanJapaneseJordanianKenyanKiowaKoreanLaotianLatvianLebaneseLiberianLithuanianLumbeeLuxembourgerMacedonianMalaysianMalteseMarshalleseMenomineeMexicanMexican American IndianMongolianMoroccanNative HawaiianNavajoNepaleseNew ZealanderNicaraguanNigerianNorthern EuropeanNorwegianOkinawanOsageOttawaPaiutePakistaniPalestinianPanamanianParaguayanPennsylvania GermanPeruvianPimaPolishPortuguesePotawatomiPuebloPuerto RicanPuget Sound SalishRomanianRussianSalvadoranSamoanScandinavianScotch-IrishScottishSeminoleSenegaleseSerbianShoshoneSierra LeoneanSiouxSlavicSlovakSloveneSomaliSouth AfricanSouth AmericanSouth American IndianSoviet UnionSpaniardSpanishSpanish AmericanSpanish American IndianSri LankanSubsaharan AfricanSudaneseSwedishSwissSyrianTaiwaneseThaiTlingit-HaidaTohono O'OdhamTonganTrinidadian and TobagonianTsimshianTurkishU.S. Virgin IslanderUgandanUkrainianUruguayanUteVenezuelanVietnameseWelshWest IndianYakamaYaquiYugoslavianYumanYup'ikZimbabwean
Immigrant Origin (Total)
AfghanistanAfricaAlbaniaArgentinaArmeniaAsiaAustraliaAustriaAzoresBahamasBangladeshBarbadosBelarusBelgiumBelizeBoliviaBosnia and HerzegovinaBrazilBulgariaBurma / MyanmarCabo VerdeCambodiaCameroonCanadaCaribbeanCentral AmericaChileChinaColombiaCongoCosta RicaCroatiaCubaCzechoslovakiaDenmarkDominicaDominican RepublicEastern AfricaEastern AsiaEastern EuropeEcuadorEgyptEl SalvadorEnglandEritreaEthiopiaEuropeFijiFranceGermanyGhanaGreeceGrenadaGuatemalaGuyanaHaitiHondurasHong KongHungaryIndiaIndonesiaIranIraqIrelandIsraelItalyJamaicaJapanJordanKazakhstanKenyaKoreaKuwaitLaosLatin AmericaLatviaLebanonLiberiaLithuaniaMalaysiaMexicoMicronesiaMiddle AfricaMoldovaMoroccoNepalNetherlandsNicaraguaNigeriaNorth MacedoniaNorthern AfricaNorthern EuropeNorwayOceaniaPakistanPanamaPeruPhilippinesPolandPortugalRomaniaRussiaSaudi ArabiaScotlandSenegalSerbiaSierra LeoneSingaporeSomaliaSouth AfricaSouth AmericaSouth Central AsiaSouth Eastern AsiaSouthern EuropeSpainSri LankaSt. Vincent and the GrenadinesSudanSwedenSwitzerlandSyriaTaiwanThailandTrinidad and TobagoTurkeyUgandaUkraineUruguayUzbekistanVenezuelaVietnamWest IndiesWestern AfricaWestern AsiaWestern EuropeYemenZaireZimbabwe
Immigrant Origin (Percentage)
AfghanistanAfricaAlbaniaArgentinaArmeniaAsiaAustraliaAustriaAzoresBahamasBangladeshBarbadosBelarusBelgiumBelizeBoliviaBosnia and HerzegovinaBrazilBulgariaBurma / MyanmarCabo VerdeCambodiaCameroonCanadaCaribbeanCentral AmericaChileChinaColombiaCongoCosta RicaCroatiaCubaCzechoslovakiaDenmarkDominicaDominican RepublicEastern AfricaEastern AsiaEastern EuropeEcuadorEgyptEl SalvadorEnglandEritreaEthiopiaEuropeFijiFranceGermanyGhanaGreeceGrenadaGuatemalaGuyanaHaitiHondurasHong KongHungaryIndiaIndonesiaIranIraqIrelandIsraelItalyJamaicaJapanJordanKazakhstanKenyaKoreaKuwaitLaosLatin AmericaLatviaLebanonLiberiaLithuaniaMalaysiaMexicoMicronesiaMiddle AfricaMoldovaMoroccoNepalNetherlandsNicaraguaNigeriaNorth MacedoniaNorthern AfricaNorthern EuropeNorwayOceaniaPakistanPanamaPeruPhilippinesPolandPortugalRomaniaRussiaSaudi ArabiaScotlandSenegalSerbiaSierra LeoneSingaporeSomaliaSouth AfricaSouth AmericaSouth Central AsiaSouth Eastern AsiaSouthern EuropeSpainSri LankaSt. Vincent and the GrenadinesSudanSwedenSwitzerlandSyriaTaiwanThailandTrinidad and TobagoTurkeyUgandaUkraineUruguayUzbekistanVenezuelaVietnamWest IndiesWestern AfricaWestern AsiaWestern EuropeYemenZaireZimbabwe
Income
Income (Families)
Income (Households)
Poverty
Poverty (Families)
Unemployment
Employment Occupations
Employment Industries
Employer Class
Commute Time
Commute Means
School Enrollment
Education by Degree Field
Occupancy
Finances
Physical Characteristics
Delaware
Compare Zip Codes
Comparison Subject

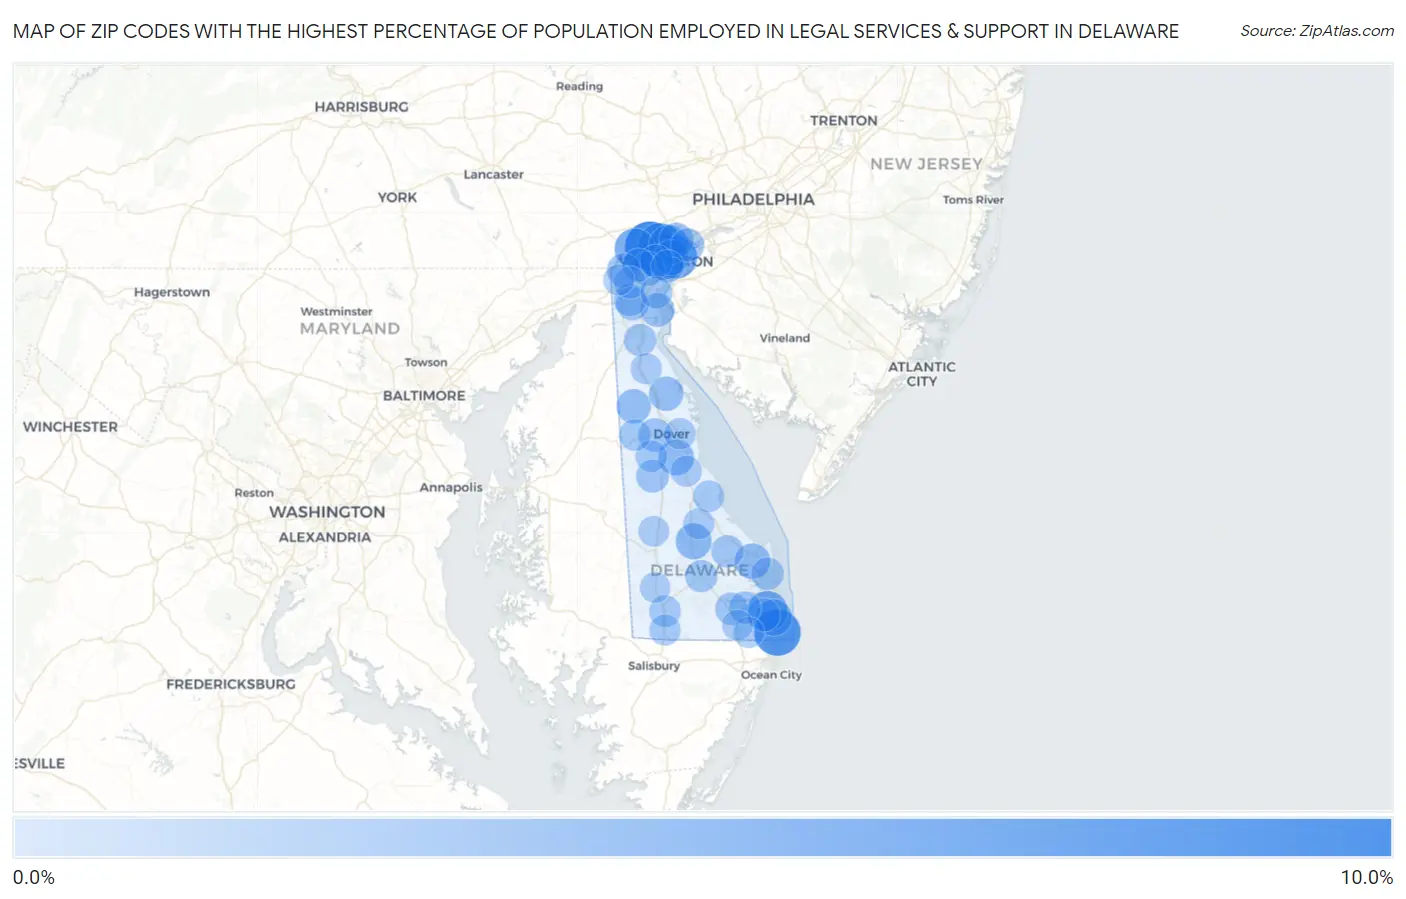
Map of Zip Codes with the Highest Percentage of Population Employed in Legal Services & Support in Delaware

0.0%
10.0%
Zip Codes with the Highest Percentage of Population Employed in Legal Services & Support in Delaware Map

Zip Codes with the Highest Percentage of Population Employed in Legal Services & Support in Delaware

Zip Code % Employed vs State vs National
1.198078.7%1.4%(+7.29)#11.2%(+7.53)#209
2.198067.6%1.4%(+6.20)#21.2%(+6.45)#292
3.199447.3%1.4%(+5.89)#31.2%(+6.13)#311
4.197326.0%1.4%(+4.61)#41.2%(+4.86)#472
5.198095.2%1.4%(+3.81)#51.2%(+4.06)#652
6.197074.7%1.4%(+3.23)#61.2%(+3.47)#826
7.199704.6%1.4%(+3.14)#71.2%(+3.39)#869
8.198034.3%1.4%(+2.87)#81.2%(+3.12)#977
9.199302.8%1.4%(+1.39)#91.2%(+1.63)#2,060
10.199412.5%1.4%(+1.11)#101.2%(+1.36)#2,452
11.199622.4%1.4%(+0.992)#111.2%(+1.24)#2,634
12.199582.4%1.4%(+0.936)#121.2%(+1.18)#2,725
13.198022.2%1.4%(+0.808)#131.2%(+1.05)#2,958
14.199381.8%1.4%(+0.410)#141.2%(+0.657)#3,888
15.199771.8%1.4%(+0.380)#151.2%(+0.627)#3,974
16.198101.8%1.4%(+0.371)#161.2%(+0.618)#4,002
17.198041.7%1.4%(+0.225)#171.2%(+0.471)#4,474
18.197061.6%1.4%(+0.127)#181.2%(+0.373)#4,817
19.198051.4%1.4%(+0.004)#191.2%(+0.251)#5,316
20.197111.4%1.4%(-0.033)#201.2%(+0.214)#5,488
21.197031.4%1.4%(-0.064)#211.2%(+0.183)#5,625
22.199041.3%1.4%(-0.081)#221.2%(+0.166)#5,686
23.199671.2%1.4%(-0.186)#231.2%(+0.060)#6,248
24.197011.2%1.4%(-0.234)#241.2%(+0.013)#6,516
25.198081.2%1.4%(-0.237)#251.2%(+0.010)#6,537
26.199431.1%1.4%(-0.337)#261.2%(-0.090)#7,218
27.199711.0%1.4%(-0.411)#271.2%(-0.164)#7,693
28.198010.97%1.4%(-0.459)#281.2%(-0.212)#8,026
29.197020.96%1.4%(-0.470)#291.2%(-0.224)#8,124
30.199660.93%1.4%(-0.501)#301.2%(-0.254)#8,352
31.197090.91%1.4%(-0.521)#311.2%(-0.275)#8,515
32.199680.91%1.4%(-0.525)#321.2%(-0.278)#8,550
33.197130.88%1.4%(-0.547)#331.2%(-0.300)#8,751
34.197200.83%1.4%(-0.605)#341.2%(-0.358)#9,228
35.199390.81%1.4%(-0.624)#351.2%(-0.378)#9,389
36.199470.80%1.4%(-0.631)#361.2%(-0.384)#9,444
37.199340.61%1.4%(-0.822)#371.2%(-0.576)#11,371
38.199530.61%1.4%(-0.824)#381.2%(-0.577)#11,385
39.199560.57%1.4%(-0.856)#391.2%(-0.609)#11,764
40.199630.49%1.4%(-0.936)#401.2%(-0.690)#12,705
41.199010.46%1.4%(-0.966)#411.2%(-0.719)#13,071
42.199400.38%1.4%(-1.05)#421.2%(-0.808)#14,124
43.197340.36%1.4%(-1.07)#431.2%(-0.823)#14,314
44.199600.33%1.4%(-1.10)#441.2%(-0.854)#14,711
45.199460.32%1.4%(-1.11)#451.2%(-0.864)#14,816
46.199750.27%1.4%(-1.16)#461.2%(-0.914)#15,392
47.197170.24%1.4%(-1.19)#471.2%(-0.947)#15,792
48.199500.20%1.4%(-1.23)#481.2%(-0.983)#16,182
49.199450.18%1.4%(-1.25)#491.2%(-1.01)#16,413
50.199730.12%1.4%(-1.32)#501.2%(-1.07)#17,004

Common Questions

What are the Top 10 Zip Codes with the Highest Percentage of Population Employed in Legal Services & Support in Delaware?
Top 10 Zip Codes with the Highest Percentage of Population Employed in Legal Services & Support in Delaware are:
#1
8.7%
#2
7.6%
#3
7.3%
#4
6.0%
#5
5.2%
#6
4.7%
#7
4.6%
#8
4.3%
#9
2.8%
#10
2.5%
What zip code has the Highest Percentage of Population Employed in Legal Services & Support in Delaware?
19807 has the Highest Percentage of Population Employed in Legal Services & Support in Delaware with 8.7%.
What is the Percentage of Population Employed in Legal Services & Support in the State of Delaware?
Percentage of Population Employed in Legal Services & Support in Delaware is 1.4%.
What is the Percentage of Population Employed in Legal Services & Support in the United States?
Percentage of Population Employed in Legal Services & Support in the United States is 1.2%.